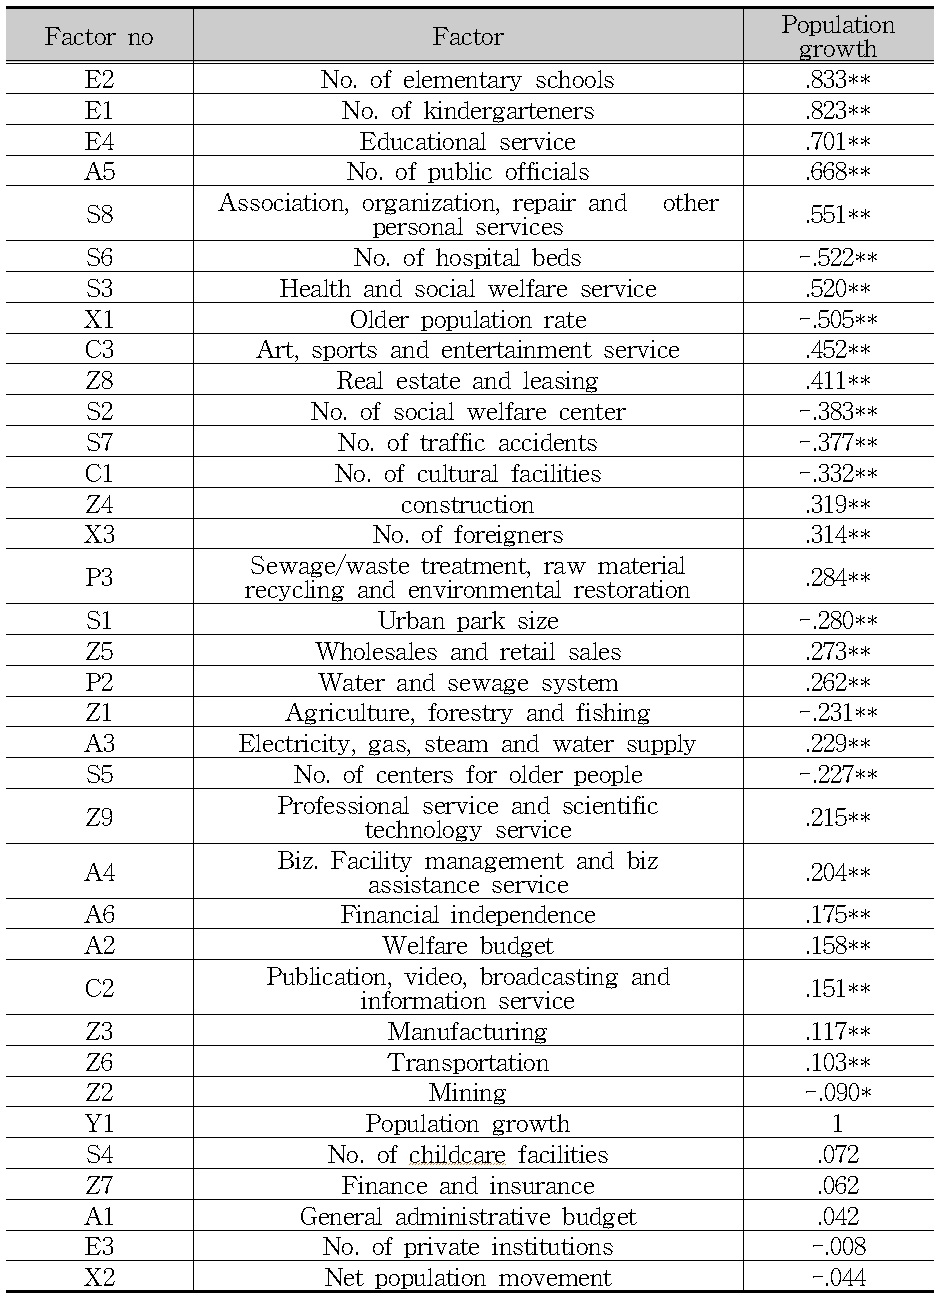
본 연구는 경제, 사회, 문화적 요인 중 어떠한 요인이 도시성장에 미치는 영향요인인지 밝혀내기 위하여 통계분석을 시도하였다. 한국의 전체 시를 대상으로 도시성장의 요인에 관한 분석을 하기 위한 선행과정으로 도시성장과 그 요인에 관한 각종 문헌을 고찰하여 종속변수, 독립변수를 선정하였다. 도시성장 요인에 대한 경험적 분석을 함에 있어 먼저 종속변수와 개별 독립변수들 간의 상관관계를 살펴보았다. 전반적으로 각 변수와 종속변수 간에는 서로 정(+)의 상관관계가 많이 나타나고 있는 가운데 일부 변수는 부(-)의 관계도 나타내고 있다. 그 이유는 이론적 논의와 같이 측정지표의 선정과정에서 종속변수에 대한 독립변수의 효과를 사전 고려하였고, 대부분 인구성장에 긍정적인 효과를 나타내는 지표를 선정했기 때문이다. 일부 종속변수와 부(-)의 상관관계를 나타내는 지표로는 사회적 요인의 병상수, 사회복지시설 수, 교통사고 발생건수, 도시공원면적, 노인여가복지시설수, 인구적 요인의 고령인구비율, 문화적 요인의 문화기반시설수, 경제적 요인의 농업 및 임업, 어업, 광업 등이 나타나고 있다. 변수 사이의 선후관계를 알 수 없는 상관관계의 속성상, 이러한 요인들이 부(-)의 관계로 나타난 이유는 도시가 성장할수록 각 요인에 관계된 상황이 열악해지질 수도 있음을 의미한다. 즉 도시의 사회서비스 시설이나 기타 물리적 시설 수준은 인구성장 수준과 반비례적인 가정을 할 수도 있다. 따라서 전반적으로 대부분 변수들의 상관관계는 어느 정도 수용할 수 있는 결과로 보여진다.
Cities are growing and changing in characteristics over time. Since the industrial revolution, industrialization led to rapid urbanization and produced modern industrial cities. Deindustrialization, however, has brought about so called post-modern cities that are dominated not by the manufacturing industry but by the service industry, especially the new cultural industry. The flagship strategy has been adopted to regenerate old cities in decline, starting from European cities.
The space where manufacturing left has been filled with post-modern industries like culture. While many cities in the world, especially in developing countries, still have industrial traits, many cities in developed countries show post-modern features. Creative and symbolic industries are thriving in these cities, while manufacturing is declining.
Cities around the world are building and branding urban cultural life as a way to develop local economies and revitalize urban centers. Such “culture-led development” or “cultural development” plans and programs have led many cities to expand existing cultural agencies and programs, and to establish new ones. These cultural agencies and programs serve nonprofit cultural amenities such as museums and theaters, target cultural industries such as film and music production and, more recently, have begun to focus on supporting the artistic workforce (Rosenstein 2009).
This does not mean that the landscape has been wholly transformed. Older manufacturing centers may continue for a long decline, killing off a city or transforming it as something new blooms from the decline. Newer industry coexists with the old as more vital transportation, services, and arts and culture develop alongside the older signs of the urban center. Smarter cities have guided this growth in esthetic ways that soften the blow on those displaced even as it provides an attractive boost to get the new drivers of growth off the ground. Regardless of the mix or the stage of the transition, however, there comes a time when the new winners become clear as they are the dynamic growth industries.
The purpose of this study is to find what factors affect urban development as population growth. Which factor is more important, economic, social and cultural?
This theory regards place as commodification, which is socially and economically valued land. In order to expand the value of land, there are coalitions of actors and organizations (i.e. growth machines) (Logan and Molotch 1987; Molotch 1976, 1993; Molotch and Vicari 1988). Coalitions are formed to seek rent by increasing the exchange value of land. Growth coalitions involve many actors like local politicians, realtors, construction companies, local media, utilities, lawyers, banks, accountants, and universities.
In the case of growth coalitions, the arts coalition was analyzed as a strategy of urban development in New York City (Whitt 1987). Whitt argued that, as tourism emerged as a growth strategy, the arts coalition used cultural districts as a strategy. Even though there were some conflicts of interest among rent-seekers, common and overlapping interests dominated the development of cultural districts in New York. The driving force of development was the arts coalition formed according to the growth of public and private subsidies for the arts. It had the special appeal of the arts as a strategy. The new arts-centered development coalition including corporations, developers, banks, arts groups, federal government officials, local and state governments, city planners, local arts organizations and arts advocates, and often historic preservationists (Whitt 1987). The incentives for the coalition partners include cultural MXDs and special legal, tax and financial arrangements.
The traditional understanding of cities, their development is based on jobs and industry. Cities are located for economic reasons. This traditional perspective is based on the triple inputs of land, labor, and capital (Clark 2004). Cities grow up according to proximity to key resources, to transportation hubs like rivers and ports and crossroads and railheads, and to manufacturing centers that promote industry through processes like agglomeration and economies of scale (Lee, Tao, and Anderson 2012). Capital inputs are drawn to the strategic placement of the city in order to finance the transformation of these inputs into practical industry. Factories are built. Industries gather. Industry draws people (labor, or more recently, human capital) to work in the various industries, developing the urban area and completing the inputs. Urban development in this sense goes hand in hand with economic development. This old paradigm stressed that “land, labor, capital, and management generate economic development” (Clark 2004). The city may not exist without all three and each is a precondition of the others. This model relied on economic factors, stressing work and production. In short, it is a materialist view of urban development.
3. Cultural and Amenity Perspective
There are many researchers who have raised the role of amenities in driving urban growth. As local governments in Korea become more independent in respect to policy and local autonomy, mayors have been interested in attracting cultural festivals to repeat the success of cultural events like the Busan International Film Festival and the Gwangju Biennale. Amenities have also been developed to support these festivals as well as culture and arts districts, as prestige projects, and to improve the quality of urban life that had been affected by rapid industrialization.
The argument for the role of amenities in urban growth and development considers “reversing the causal processes normally assumed to drive cities.” This means that attracting people and attracting business is linked as “People both live and work in cities. And where they choose to live shifts where and how they work.” The old paradigm is incomplete whereas the new paradigm helps to make up for factors that have received too little attention in the past (Clark 2004).
Florida argues that cities are complicated and that multiple causes and processes are at work simultaneously (Clark 2004). The important thing, though, is that amenities and environmental quality matter in the attraction of quality workers and the development of high tech regional economies (Florida 2000, 2002). Workers with high levels of human capital, known as “talent,” are the key to success in the new era of economic growth. Tolerance and diversity are among the factors that seem to attract such workers to high-tech concentrations (Florida and Gates 2004).
Culture is crucial to economic vitality (Clark et al 2004).1) On top of the old physical capital stock, new growth factors include the clustering of the same industry in a single area as well as the rise of the importance of human capital (Clark and Rothfield 2005). Moreover, cities have already been making big investments in culture, entertainment, and other amenities in order to improve the value of their location (Clark 2004). Part of this new culture has been the primacy of consumption issues over production issues (Bartlett et al 2004).
Glaeser et al. look at what attracts business to the city, they identify the city as more than just the site of production. They explore the role of cities in facilitating and fostering consumption (Glaeser et al 2004). The city has become “an entertainment machine” under Clark’s theory of consumption that asserts that consumption has become a new central issue. Urban actors such as governments and businesses can design mixes of amenities to attract the mix of workers to supply the labor for the industries they want in their cities. Each urban neighborhood provides some overall experience that matches a package of amenities that can attract a particular sort of urban resident or tourist. By identifying and promoting the scenes desirable to the groups they wish to attract, urban actors may be able to succeed at “making culture into magic” (Silver et al 2006, Clark 2006)
The literature review in the prior section pertains to research in the areas of urban policy, city growth factor, and urban growth. We now turn our attention to research areas in urbanization processes, features, and laws which are also related to urban growth analysis. In Korea, culture-based development has been positively associated with housing price(Lee 1998: 337-351); and open space and proximity to parks have been shown to be important urban growth determinants for Seoul. This result reinforces Florida’s finding that outdoor recreation and lifestyle amenities have become more important.
Moon(1996) stated that Korean urbanization was led by Seoul initiated metropolitan area growth and expansion, causing main function concentration in the metropolitan area. In addition, based on industrialization, population movement pattern, and urbanism in the mid-1990s, Korean urbanization was about to enter the mature stage similar to that of the advanced country type.
Yoon(1992) focused on using metropolitan area over-population in explaining Korean urbanization, that Seoul’s metropolitan area population concentration was caused by the political, economical, social, and cultural advantages. In addition, he insisted that such advantages should be able to keep pace with the population decentralization policy. In conclusion, he proposed that future research should refrain from forced and direct analysis, instead he insisted population decentralization by problem solving approach in association with the localization period.
Furthermore, other the city growth factor the research regarded population growth laws as urban growth laws on the assumption that population is the most important indicator of urban growth level. This line of research identified various other socioeconomic indicators in addition to population.
1) Population scale based city growth factor research
The key element of the definition of a city its population, expressed by the number of residents in a city since it is the most basic element of the city. Being absolute to city conceptualization and selfish diversity definition, population size is the most valid standard and a lot of city population size based pattern analyses have been conducted.
Park(1997) established that social, economical, and environmental laws could be used as explanatory variables and annual population as dependent variable in analyzing the urban development determination laws. Therefore, he divided the overall urbanization features into the high urbanization rate point and high senior city concentrativeness point. He said that the city growth factor would be determined by the relation among the economical elements like job and unemployment rate, the social elements like education, and the environmental elements like comfort and convenience.
Song(1997) studied various urban development processes and models: he divided his subject cities into rapidly growing city, growing city, standstill city, and declining city groups on the basis of their average urban population growth rate, the standard deviation, and the comparisons to the national population growth rate. According to Song(1997), Korean cities made rapid development progresses until the early 1980s from the early 1970s, the intercity growth gap was not negligible, the highest growth rate were achieved mostly by the cities in the metropolitan area. These cities experienced little recession while the cities in the southeastern part of Korea showed mixed development, some with recession and others without, and most of the cities in the southwestern part suffered from recession. In addition, the Korean urban development was highlighted by the fact that both Seoul and Busan stood in the center of urban development was that the manufacturing industry was the growth engine, and that the diversity and continuous industrial employment growth in the manufacturing sector was very important for urban development.
Kim(2004) divided the cities into rapidly growing city, growing city, backward city, and gridlock city according to their annual average population growth rate in identifying population scale, inter-city transfer, housing penetration, major service function, public facility project budget, manufacturing business employment density, export potential, and financial independence as factors affecting Korean urban growth. However, such growth laws were significantly different for different cities and that they are, ever-changing over time.
2) Other factors based city growth factor research
Considering, that construct are used in studying urban development, factors other than population change factor began to emerge in research on urban development. Hence, there have been many research using various data for city patternization and status understanding, in addition to population scale related indicators.
Lee(1989) divided the urban development promotion laws into 5 categories, basic factor, economic factors, SOC factors, social factors, and policy (administrative) factors to investigate their effect on city growth. His results showed that: small cities were affected by the social factor, medium-sized cities by the economic factor, and big cities by a combination of the economic factors, the social factors, the SOC factors, and the policy factors and that the most important of these factors was the economic factors.
Lee(1992) proposed using the structural features, city growth factor analysis result, and development strategy between small and medium-sized city growth analysis indicator patterns in his study. He classified the Korean small and medium-sized city growth patterns on the basis of their annual average population growth rate and divided them into rapidly growing city, growing city, and gridlock city groups. In his study, he noted, with respect to using population factor as the urban development core factor, both the quantity side called ‘population scale’ as well as the quality side called ‘population structure’ are important. Forthermore, the economical elements could be divided into employment opportunity accumulatise, economic activity foundation, and manufacturing business based industrial structure. He also noted that culture, education, medical service functions, provision of income consumption opportunity, and membership as importance social elements.
Lim(1994) proposed using small and medium-sized city development model to identify the structural features of economic and infrastructure conditions for urban area development. He established that, societal environment related variables and economy related variables be used to group the small and medium-sized city patterns and divided them into financially sound city, environment-friendly city, education city, hygienic city, employment growth city, light industry development city, industrial development city, heavy industry and development city in studying the pattern-specific development.
Hong(1998) studied Korean urban development and focused using population, economic power, and life infrastructure as differentiators and divided the urban development patterns into high growth type, standard growth type, and recession type. His results revealed that there was a significant growth gap between cities, regions, and city classes in terms of population and that economy and there was an overall symptom of falling behind throughout the city in terms of facilities.
In his study, Song(2007) divided the urban feature indicators into status and trend groups for 159 cities and counties except Seoul and other megalopolises. Thereafter, he conducted factor analysis for these cities and divided them into 4 patterns, growing city, temporarily growing city, standstill city, and temporarily standstill city. Finally, he looked at the standstill city features and the reasons of their decline to propose a reasonable urban regeneration method.
Chang(2007) used data on 75 cities in Korea to investigate urban competitive power determination factor and competitive power evaluation model development research and he could proposed more improved research models than the existing researches which had problems like measurement indicator overlapping, subjective weighting method, and intermittent time series. As a result, restrictions on the existing models were considerably improved in terms of analysis content objectiveness and stability. His result was confirmed by comparison with other models.
Koreans have varied, but selective and specific preferences for cultural activities. Differences were found to be greatest by gender and age, with little occupational differences(Lee 2003). In the city of Incheon itself, data from 1995 to 2005 show that a number of cultural amenities are positively related to population growth at the district level(Lee 2006).
Jung(2013) analyzed the relationship between local government investment expenditures and local growth domestic production in Korea, focusing on using data from metropolitan city of Busan. He showed that an increase in investment expenditure by 10 percent brought about increase GRDP by about 3.6 percent. Expenditure in education/culture/tourism had effects on the product as causal relation. Since 2000 the impact of education/culture/tourism expenditure on output has been decreased while the impact of transportation/national land expenditure on output has been increasing.
The city growth factor related research review is summarized in Urban growth factor related prior-research Ha, Kim, and Jeon(1995) showed, the internal structure of a city might be dependent on the citizen, enterprise, and public institute position. Therefore, the spatial structures like lower housing market and land use pattern are reflected by economic activities. They added that a city tended to continually change as if it was an organic body. In addition, urban policy is very useful for the understanding of urban special structure and change direction prediction since it can cure the special supply imbalance and predict the urban space structure change pattern. Cho and Lim(2001) investigated the centrality of various regions in the metropolitan area in order to understand urban spatial structure. The first method they adopted the urban activity concentration based on the fact the more concentration of urban activities such as employment, education, and commercial service, the higher the centrality of that region and the higher their effects on the other areas. This method relied on the total population in/out and the influence power indicator of each region (total inflow/total outflow). Lee and Kim(2002) showed, in their research, with respect to urban spatial structure, it was very important to reveal the pattern change of urban activity based position distribution and the interaction system definition based position distribution pattern and that it was meaningful to review the urban section pattern change chronologically for the city. Moreover, according to them, research on urban spatial structure pattern change began when the paradigm called industrialization began and led to urbanization in the early 20th century. Hence, Korea began her urbanization and industrialization in the cities when her economic development started in the 1960s. On the basis of such a change process, they showed that City of Suweon had the most desirable urban development direction from the viewpoint of its spatial structure alteration process. Choi(2008) analyzed the urban development process of the city of Seongnam proposing the sustainable development method. He defined urban spatial structure features and rules precisely and separated the physical and functional feature of the old section and the new section of the city, and analyzed the resident feeling life quality gap and urban growth direction to propose the most reasonable, efficient, and balanced urban development method. The urban development related research results are summarized in Urban development related prior Research Overall, within this line of research, urban development judgment criteria have become more diverse where population was used exclusively. Analytial methods have also been divided into multiple regression analysis, group analysis, and discriminant analysis groups to accommodate the modern complexity and diversity of cities. Moreover, many approaches have been used in solving problems, for example, data problem on time series for dynamic model data application. Similarly, research on urban development and management method have been focusing on searching for the various urban development laws and subsequently searching for the best way of city growth; however, some efforts have been made to study the efficient urban management method to narrow the regional gap in. We identified urban development laws and revealed the regional gap and we were able to propose the macro growth method; however, we failed at the microscopic level in suggesting any specific and practical method for urban development. Furthermore, prior research feiled in identifying a set of genuine growth laws since all of them were based on data from nationwide cities and counties, i.e. there remained the issue of generality. Therefore, we decided to investigate the major city growth change of Korea based on several variables and how such a change was affected by urban policy. Since urban competitive power improvement is a key national policy and major cities have been under the influence of the national policy, it cannot be emphasized enough to investigate the relation between such policies and city change. This approach can be differentiated from the existing policy or urban analysis approached in that we take a general view on the past policy trend and actual urban growth change pattern in my evaluation and search for future improvement. 1)At least 90 American cities use culture as a revitalization tool (Clark and Rothfield 2005). The change is not just in the US. A new political culture has emerged in England due to the move away from the class-based politics towards alternative identities that are not linked to the established parties.
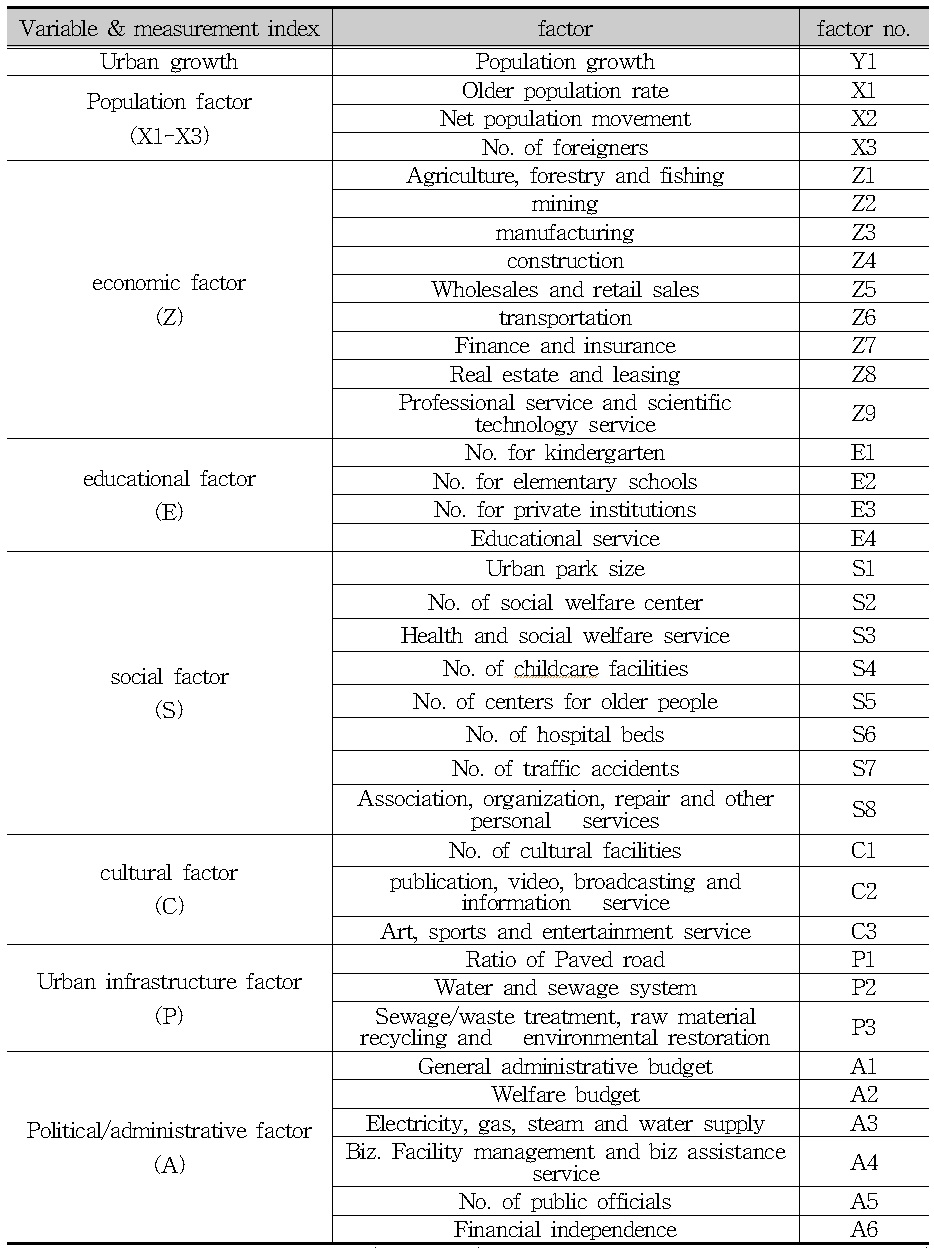
City Panel Analysis, we conducted time based analysis on the city change laws to find how the relative policy trend in Step 1 affected the actual urban growth change. For this purpose, we investigated the relative annual urban data and analyzed the subsequent change laws after we categotiged all the urban data for the 10 years from 2000 to 2010 into population, economy, education, society, culture, urban infrastructure, and administrative factors. This is useful for understanding the validity of policy effect for urban growth. This study uses pooled data from more than 69 districts of 7 metropolitan governments in South Korea across a ten year period to investigate the factors affecting urban development. The statistical analysis includes variables from economic, educational, social, cultural, urban infrastructure and public administration factors as independent variables. The dependent variable population growth is used as a proxy for urban development. In this analysis, correlation study and multiple regression analysis are employed. This research utilized data on all cities in South Korea to identify factors affecting urban growth. Based on my examinations of prior research in the previous sections, we are able to select relevant factors that drive urban growth and formulate a practical research model and using thes factors as its independent variables. These city growth factors can be categorized as variables on population, economy, society, physical aspect, politics, and administration. And based on this, we select further detail sub-indexes for the study. we perform regression analysis using Ordinary Least Squares (OLS), method on the model formulated. In this model, urban growth (Y) is the dependent variable proxied by the annual growth rate of the cities in the nation by combining two indices, population growth rate, and economic growth rate. Independent variables include population factors of (X1~X3), economic factors of (Z1~Z9), educational factors of (E1~E4), social factors of (S1~S8), cultural factors of (C1~C3), urban factors of (P1~P3), and political and administrative factors of (A1~A6). Both the dependent and independent variables in this model are based on my examination on existing literature scholars in the field of urban ecology, urban economy, urban social science, urban politics and administration, and urban planning in previous sections. For urban growth indices, as dependent variables, in this research, will use Korea’s annual population size normalized by natural logarithm (LN). Economic and financial variables are expressed in financial amount using constant price of 2000 (the official baseline year announced by the statistics service of the country). On the basis that urban development encompasses both population growth and economic growth, I have selected urban population size and economic size as the most appropriate variables of measurement. This means that the urban growth represented by the aspect of population is a result of various preceding factors. Variables affecting urban growth in this research are divided into groups of population factors, economic factors, educational factors, social factors, physical factors, and political and administrative factors and measurements applied. First, as population factors, we shall use the ratio of older population, net population movement and the number of foreign resident. Second, for economic factors, we shall use the number of employees in manufacturing, wholesale and retail sale, service, etc(Hyeonok Hong, 1998; McDonald, 2007; McManus, 2007; Graf, 2009). Third, for educational factor, we shall use on education level kindergartens, elementary schools, private institutions, college. Fourth, for social factors we shall use the number of cultural facilities, urban park size, number of sports facilities, number of social welfare centers, number of childcare facilities, number of centers for elder people relaxation, number of hospital beds, number of traffic accidents, suicide rate, divorce rate, etc. (Frumkin, 2004; Hatry, et. al, 2006). Fifth, for physical factors, we shall use the rate of paved road, and water and sewage system rate (Klaassen & Paelinck, 1979; Pred, 1980; Keiner; Wilson, 2007; Dierwechter, 2008; Jihyeong Park, Junhyeon Hong, 2007). Sixth, political and administrative factors include general administrative budget, welfare budget, number of public officials, degree of financial independence, etc. (Thompson, 1981; Heilbrun, 1981; Sharp, 1990; Keiner, 2005; Wilson, 2007; Yunho Kang, 2008). As discussed previously, the selection of the explanatory variables are based primarily our literature review. we have also consider the issues of data availability. The level of representation that has a probability high possibility of relation to urban growth. Overall, we control for external variables such as maturation effect or historical effect. The variables selected, as explained above are summarized in Research Variables
Our data is time-series panel data on metropolitan cities by the district unit of ‘Gu’ for the past 10 years in Korea. Specifically analysis, we use data from the national statistics service, e-Nara index for nationwide view, and each metropolitan city’s own statistics. Using empirical data improves research credibility and validity. However, there remains unavoidable limitations such as measurement error given the nature of data being produced long 10 years ago. In fact, long term urban social and economic data and time-series statistical data on cities have not been systematically organized yet for the Gu of metropolitan cities. That is, considering the status of Korea’s nationwide city panel data, and regional statistics, we expect that there will be some restrictions in identifying growth factor by empirical analysis. In order to overcome possible restrictions, my research is based in large part the availability of panel data, and consistency, them. we use, for instance, raw data that were not omitted and processed while showing detailed statistics clearly and whose general total matches the sum of section totals. Nationwide data and regional data used are the most updated version under the same principle and in cases where multiple data do not match, we use statistics closest to their raw form which we believe are more reliable since we do not have to decluce where a problem arose. Regional data has an advantage over nationwide data since the former was surveyed in a more appropriate manner for the specific conditions of the corresponding city, providing a closer look at the actual urban status while resolving the mismatch between data sets. Specifically, in the process of organizing pre-set data from 2000 to 2010, we perform the following to overcome data limitations. First, unlike the inclusive panel data, for sub-divided scale data, in order to deal with missing values, etc., where the corresponding were not released in the same values year, or if the year’s data are simply missing we exclude indices from data that were not systematically organized, difficult to assess, or having considerable missing values from our analysis. Second, there is the issue of consistency where the criteria may not be clear if multiple statistics exist for a single index. In this case, we choose metropolis-produced data rather than nationwide materials. Third, some variable-specific data did not exist or that only the year’s data existed if any. These were also excluded from the final analysis herein as converting them quantitatively by using greater-city statistics up to the unit of do. Fourth, in some cases, statistical complement was not consistent, causing mismatch between general data and scope/section-specific materials. In this study we adopted the general data for economic indices, social indices, etc. by the national statistics service who had finally modified its data for time series consistency. For this reason, some statistics did not correspond with the metropolitan cites’ own data. Urban growth indices are defined as public sector information or statistics providing a simple and inclusive view on urban system conditions and changes. They are, at the same time, a city social indicators that show certain city’s characteristics or conditions most effectively. They are based on, rather than any individual’s subjective recognition, objective analysis and quantitative statistics and a measurement tool reflecting a city’s status in a given unit. And many major indices inform a city’s current status and trend on its value and purpose, while serving as evidence and statistics to evaluate concrete business plans and its effectiveness (Sharp 1990:1-21). The unit of urban population growth is expressed as the unit of persons and independent variables are mostly the value of different weights and measures. Therefore, dummy variables and natural logarithm are used to normalized the question. If there is no valid and objective baseline for division, it would be more stable to take natural logarithm to make the dispersion closer to normal distribution. Natural logarithm (LN) of nonlinear value was found to elevate the explanation power of regression model and the result of determination coefficient. It is true that, for the recent half century, there has not been a scientific or long term discussion or argument based on urban growth process and factors by the unit of Gu of metropolitan cities. Certainly, it is also very significant to look at city-specific histories or estimate short term changes. However we take a more empirical perspective to examine long term urban changes based on statistics according to scope and sections. Only then, we can understand a city’s identity and current status more accurately and make a more reasonable projection for the future of a city. As touched on in the previous discussions, the first important idea in urban growth is population growth. Population in a city increases due to, natural increase reflected by the difference between the resulting from birth and death rates, population movement effects, net population movement, and neighboring population absorption through administrative district expansion. Population distribution change in Korean cities exhibit a trend towards an unbalanced pattern of urbanization. A group of these 40 largest cities covers most of above medium-sized cities that have more than 200, 000 inhabitants. For instance, the population of the city of Asan-si in the Gyeonggi-do province in the Capital Region placed 40th in population rankings as of 2009, at 256, 000. Several other trends can be highlighted: Firstly, like many OECD countries, the capital city and some large cities in Korea have continuously accounted for the overwhelming share of the population, and the population rankings among them have barely changed for the past several decades. The seven “1 million-plus and provincial-level cities” in Korea as of 2009 correspond to the seven largest cities in 1980. There were minor changes in ranking among them: Daejeon rose from sixth to fifth over 1990-95; Incheon rose from fourth to third between 1995 and 2000, while Daegu fell from third to fourth between 1995 and 2000. Secondly, most of the other 40 largest cities experienced frequent population rank changes through the late 1990s, but have shown markedly reduced variations since the 2000s. For a decade between1970-80, 21 out of 33 medium-sized cities that ranked between 8th and 40th as of 2009 experienced drastic leap in their population rankings. However, between 2005 and 2009, there was no change of population rank of Korean cities from 8th and 17th and notably, all medium-sized cities remained among the 40 largest cities in 2009. Thirdly, there has been an increase in the population rankings of medium-sized cities in the Seoul Metropolitan Area(Seoul, Incheon and Gyeonggi province) and the Chungcheongnam province. In 1970, there were only nine cities (27.2%) in the Capital Region, out of 33 medium-sized cities, but this has since risen to 14 (42.4%), mainly due to new town development, especially in Goyang-si and Yongin-si. Medium-sized cities in the Chungcheongnam province benefited from the rise of the Chinese economy in the 1990s. For instance, Cheonan-si, home to the high-tech industry, was placed at 147th in 1970, with 76,000 inhabitants, but moved up to 17th in 2009, with 540,000 inhabitants. Expanding this analysis to small-sized cities (including a few gun, rural areas in administrative terms) reinforces the trends of the unbalanced urbanization growth in Korea. Overall, for the four decades between 1970 and 2009, large- and medium-sized cities gained population but small-sized cities experienced population loss. This is well indicated by the trend line of 2009, which becomes flatter relative to the trend line of 1970 up to the top 61 places, but then rises more steeply. During that period, the population rise of medium-sized cities with a population ranging between 500,000 and 1 million as of 2009(matching approximately with the 8th and 20th rankings) was remarkable. The population of those cities increased by 2.5 to 4 times compared to that of the same rankings in 1970. This trend has two different paths divided by the year of 1995. Between 1970 and 1995, obvious trade-offs between large and mediumsized cities, on the one hand, and small-sized cities on the other hand, were observed: the large and medium-sized cities showed significant population gains, while the small-sized cities exhibited steady population loss. However, between 1995 and 2009, a strong convergence of trend lines and population growth has been more evenly distributed throughout.
For our empirical analysis of urban growth, below.
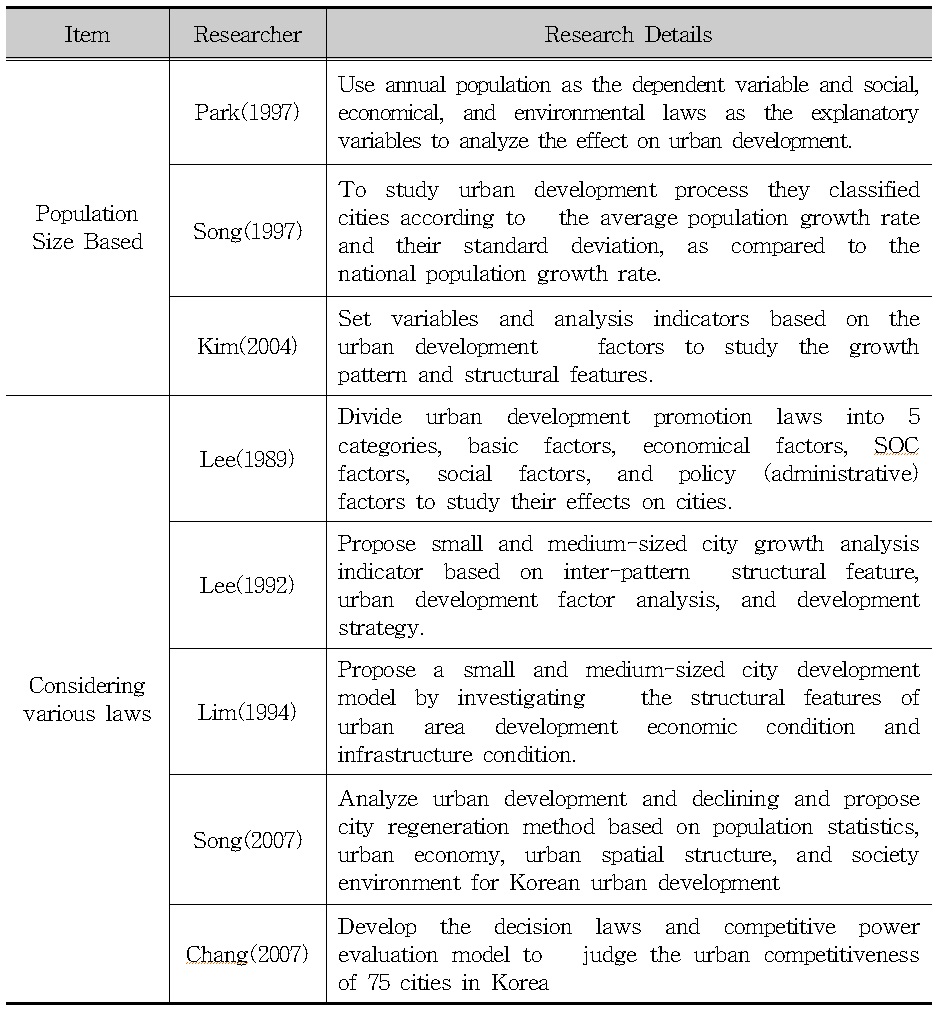
] Urban growth factor related prior-research
below.
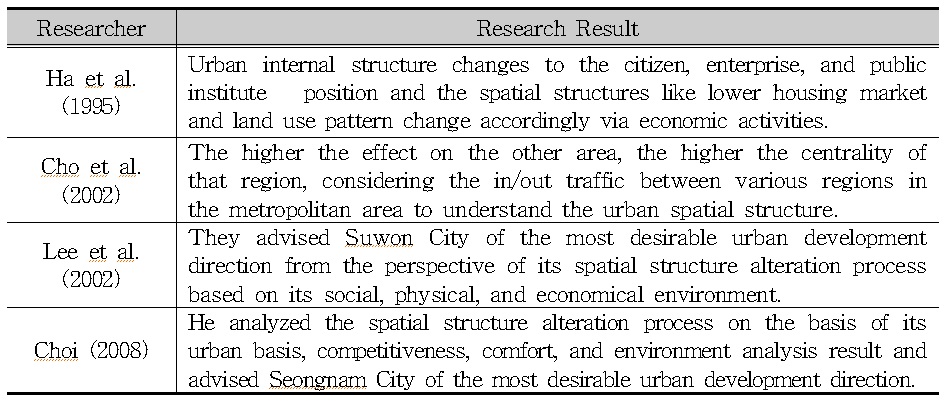
] Urban development related prior Research
Ⅲ. Analysis of Urban Development
.
] Research Variables
2. Data Selection and Measurement
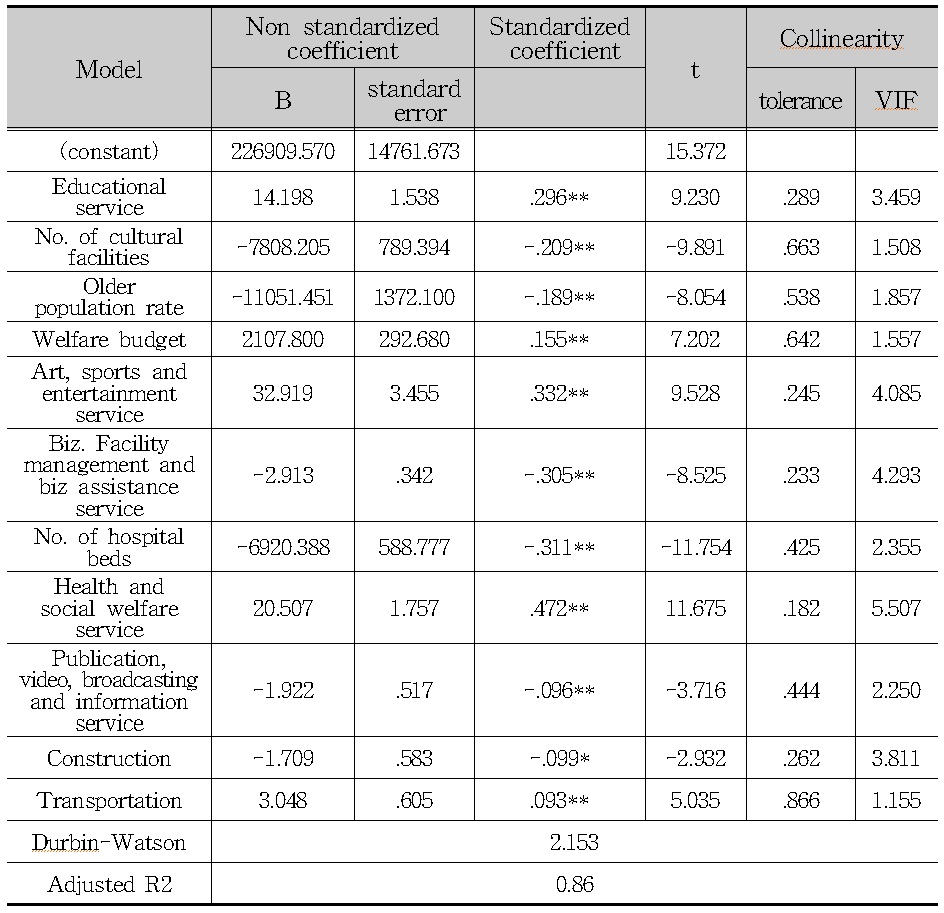
4. Factors Affecting Population Growth