The growth of population size is essential to the transition from a “post-Malthusian regime” to a “modern economy regime.” The post-Malthusian implies the stage after the escape from the Malthusian trap. This argument is rooted in the Boserupian viewpoint (1981) on the positive effects of population size on technical progress. Large-scale economies, which result from the increased demand caused by the increase in population size, generate technical progress. The unified growth model of Galor and Weil (1980) demonstrates that large-scale economies lead to economic conditions in which investments on human capital are favored. However, a gap remains between a “post-Malthusian population economy” and a “modern economy” with respect to determining population size. How the increase in population is achieved remains unclear, and how such an increase provides economic environments that are conducive for human capital investments is poorly understood.
This study employs capital accumulation to determine the “post-Malthusian population equilibrium,” which can fill the gap in the research on the population equilibrium between the “Malthusian stationary state” and the “Modern neo-classical population equilibrium” of family size choice. The function of capital goods in the context of the British Industrial Revolution as a growth model is rarely discussed. The function of capital goods in the transitional growth path of a unified growth model remains uncertain. Voigtländer and Voth (2006) presented a growth model of the British Industrial Revolution. This model considered capital goods. Their study indicated that an Ashton “wave of gadgets” in the Industrial Revolution generated the growth of the British economy. The endogenous growth model of a “variety” kind did not determine the population size.
We employ the “Unlimited Supply of Labor model” of Lewis to discuss the function of capital accumulation during the British Industrial Revolution and relate it to the determination of population size. Yang and Kim (2013) suggested a population equilibrium for the Malthusian economy of a one-sector agricultural economy. Their study emphasized the improvement of the marginal physical productivity of the agricultural worker in escaping the Malthusian trap. The present work retains the biophysical wage rate hypothesis of Fogel. Thus, the post-Malthusian model implies that income significantly affects the choice of family size.
The three factors of economic production are land, labor, and capital. Land is specific to the agricultural sector, whereas labor and capital move between the manufacturing and agricultural sectors. Capital and labor are utilized in fixed proportions for agricultural produce but are interchangeable for the production of goods. Land is specific to agricultural produce.
An economy is Malthusian when the land factor can effectively constrain population increase. A huge amount of land available for agricultural produce provides a huge amount of food to support a huge population size. Similarly, an increase in population size can be caused by the per capita rise in land ratio. The transfer of an agricultural worker into the manufacturing sector raises the per capita land ratio. The marginal physical productivity of the agricultural worker rises, such that this worker can, in turn, support a large number of children. A division of labor between the manufacturing and agricultural sectors relates to the endowment of land and capital stock of the economy. This study focuses on how the total size of capital stock determines the division of labor between the two sectors.
Another factor associated with structural changes in the economy is the relative productivity between the manufacturing and agricultural sectors. A high relative productivity of the manufacturing sector to the agricultural sector causes a huge pulling effect of labor in the manufacturing sector from the agricultural sector. The migration cost of rural workers to urban cities, where the manufacturing sector is located, also relates to a division of labor between the two sectors. The high migration cost of rural workers to urban cities hinders structural changes in the economy and delays the increase in population size. Notably, international trade is a crucial factor influencing structural changes in the economy because it alters the relative prices of agricultural foods relative to those of manufacturing goods. In an open-economy with a comparative advantage in terms of manufacturing goods, we can predict that trade contracts the employment of the agricultural sector.
Section II describes the division of labor between the agricultural and manufacturing sectors in 19th century Britain. This section presents the interrelations among changes in capital stock, total trade volume, and population size in relation to the distribution of employment in the two sectors. Section III presents the model used in this study. Section IV presents the Granger causality test results among the variables of the model. The causality test determines the effects of structural changes in the economy on the population size. Section V reviews the British experience of economic growth and population change during the Industrial Revolution with respect to the increase in capital stock and structural changes in the British economy. Section VI concludes the paper.
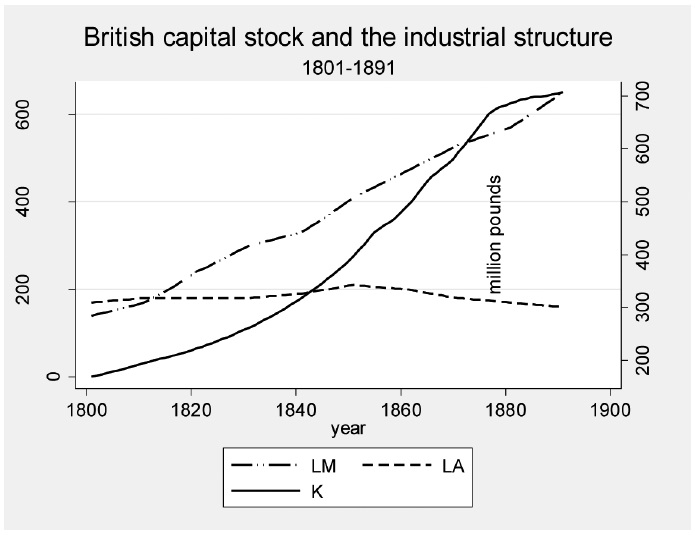
“Studies in Capital Formation in the United Kingdom” of Feinstein and Pollard (1988) demonstrated the capital stock trend during the British Industrial Revolution. The study analyzed the allocation of capital stock among sectors. The British capital stock increased more than eight times during the 19
In this section, we categorize the fixed capital formation among the agricultural, mining, quarrying, and manufacturing sectors, as well as the remainder of the total fixed capital formation in 19
Table 1 summarizes the per capita capital by sector and the population change during the British Industrial Revolution.
[TABLE 1] AMOUNT OF CAPITAL AND PER CAPITA CAPITAL STOCK OF BRITAIN BY SECTOR FROM 1801 TO 1891
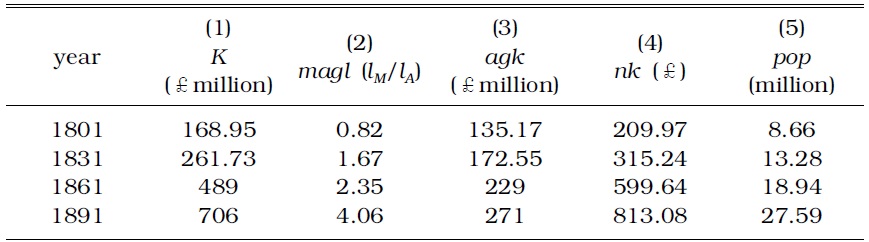
AMOUNT OF CAPITAL AND PER CAPITA CAPITAL STOCK OF BRITAIN BY SECTOR FROM 1801 TO 1891
In column (1) of Table 1,
Figure 1 shows the major macro-indicators of Table 1. The capital stock, which is represented by
The macroeconomic description (Table 1) and graph (Figure 1) of the British economy during the Industrial Revolution demonstrate the interrelations among structural change, capital accumulation, and population growth. We take structural change as the focal point for explaining population change, as inspired by the “unlimited labor supply hypothesis” of Lewis (1954). The thesis emphasized capital accumulation of the manufacturing sector for economic development with the agricultural sector as the source of labor.
We discuss the interrelations among population, capital accumulation, and structural change in the context of a post-Malthusian economy. A post-Malthusian economy in this study is characterized as follows:
The mechanism by which population increase influences structural changes in the economy is as follows: The increased amount of labor attributed to population increase causes employment in the manufacturing sector to meet the infinitely elastic demand for labor at a given subsistence wage rate in the Lewis model.3 By condition (2) of the post-Malthusian economy, profits increase at the manufacturing sector, which accrue to the owner of the capital good as rentals. Reinvestments of rentals from capital goods in the manufacturing sector draw agricultural workers to the manufacturing sector. The reduction of the number of agricultural farmers increases marginal productivity by condition (1). The number of a family unit increases by condition (3), which results in an increase in population size. Consequently, a feedback effect of the population increase occurs. Section III demonstrates this self-generating population equilibrium.
Section III presents a model to capture the stylized facts between the population and the change in the share of labor between the agricultural and manufacturing sectors associated with capital accumulation, as shown in Table 1.
1These data are obtained from Feinstein and Pollard’s (1988) “Capital Formation” Table XIII in its Appendix. The value of the capital stock on the first half of the century is adjusted for the 1900 constant prices. 2This ratio was obtained from Deane and Cole's Table 30 (1962). We note that 1814 is the year in which the employment share of labor of the agricultural sector was equal to that of the manufacturing sector. 3Instead of the surplus from the agricultural sector, the increase of the population is an alternative source for supplying labor to the manufacturing sector.
We assume that using a farm machine or vehicle for agricultural production is complementary to farm labor. A fixed bundle of a unit of farm capital and of farm labor is applied to a given plot of land for agricultural production. Given that this unit is a fixed bundle, the number of farm workers, denoted by
A productive farm capital results in efficient farm labor because of the increase in efficiency. For example, soil cultivation is more efficient when using a tractor than a horse or a cow-harness cart. The efficiency level of agricultural capital is denoted by 1<
Equation (1) is the production function for agricultural foods in Cobb-Douglas form:

where
We then consider a production function for the manufacturing sector. Unlike the case of production for agricultural produce, capital and labor are interchangeable in the production of manufacturing goods. We also express the production function for manufacturing goods in Cobb-Douglas form:4

where 0<
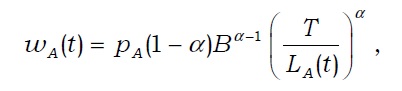
The wage rate of the agricultural worker for the given price of agricultural produce
Meanwhile, the wage rate of the manufacturing worker for the given price of manufacturing good
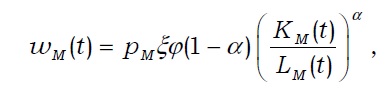
where 0<(1-
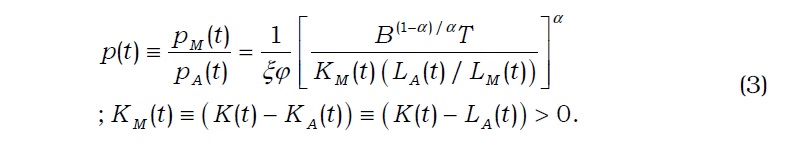
Equality of wage rates across the two sectors provides equation (3) of the price of manufacture goods

We assume that (
The wage-parity condition of (3) yields a distribution of labor between the agricultural and manufacturing sectors,
The wage-parity condition of (3) suggests that a higher share of labor for the manufacturing sector relative to that of the agricultural sector yields high capital stock. Thus, a high relative employment share in the manufacturing sector facilitates the easy movement of agricultural workers to the manufacturing sector, and the technological level of the manufacturing sector is higher than that of the agricultural sector. The functions of
We then consider the capital funds market. We consider the hypothesis that the reinvestment of profits in the manufacturing sector mostly involves the financing of investments (Neal 1994). In this context, we are in line with Allen (2009) in utilizing the capital market for the growth and income distribution model of the British Industrial Revolution. However, we extend his one-sector model to a two-sector model, retaining the “unlimited labor supply” in the hypothesis of Lewis. We assume that wages and rents are consumed.6 For a simple model, we employ a classical savings assumption.
Capital fund is malleable. We assume that such fund can be transformed into capital goods. A capital owner consumes a constant fraction 0<1-

A manufacturing firm employs labor at wage rate
where
This hypothesis is consistent with the trend of wage rate and population size in the British economy in the 19
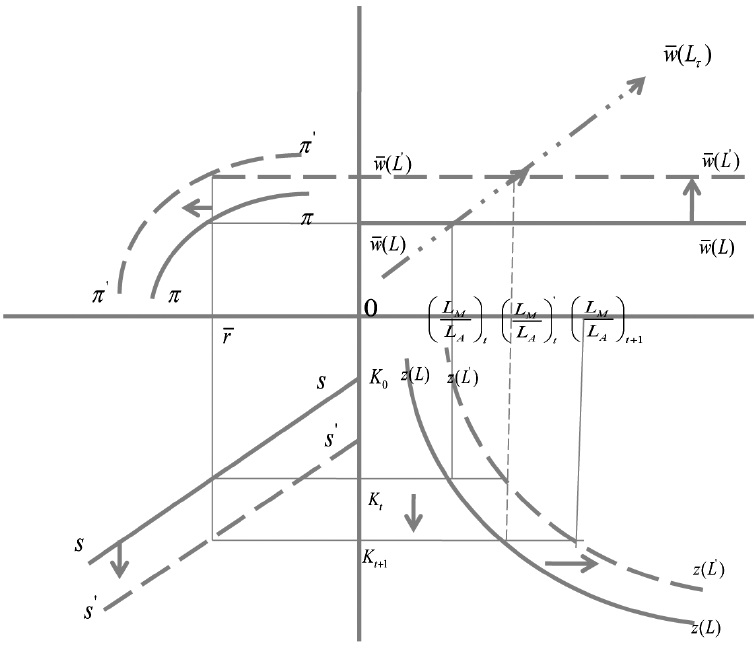
Figure 2 illustrates the endogenous determination of population size in relation to capital accumulation in the manufacturing sector.
The horizontal line of the north-east (NE) quadrant in Figure 2 indicates the relative share of manufacturing labor to agricultural labor,
Multiplying the rental on the manufacturing capital goods,
Finally, the upward-sloping curve on the south-east (SE) quadrant, denoted as curve
We discuss the equilibrium in this economy. We assume that a given amount of labor,
The wage-parity condition (3) on the SE quadrant yields the amount of capital stock,
Result 1 summarizes the discussion on the equilibrium share of manufacturing labor to agricultural labor.
Result 1: In our post-Malthusian economy, an equilibrium distribution of labor exists between the agricultural and manufacturing sectors at the given relative price of the manufacturing good,
We discuss the effects of the increase in labor supply on capital accumulation and on the labor distribution between the manufacturing and agricultural sectors.
The increase in wage rate from
The profits of a manufacturing firm increases when the employment share of the manufacturing sector increases. Investments in the manufacturing sector increase the capital for the manufacturing sector
The amount of capital stock is crucial in discussing self-generating population equilibrium. An economy endowed with the amount of capital stock at the initial period above critical level
However, the endogenous increase in population size is determined when a negative substitution effect of the quality-choice of a child instead of the number of children comes into effect with respect to the increase in wage rate. Considering the critical wage rate
Result 2: In our post-Malthusian economy, a population equilibrium exists at critical wage rate ŵ.
Structural change is influenced by the level of relative productivity of the manufacturing sector to that of the agricultural sector and by the opening of international trade instead of capital accumulation. These factors could also determine the population equilibrium.
For example, the opening of trade increased the profits of the manufacturing sector, yielded a high capital accumulation, and reinforced structural change in favor of the manufacturing sector in the British economy during the Industrial Revolution.9 The increase in relative productivity in the manufacturing sector relative to that of the agricultural sector not only reinforced the movement of the labor force from the latter to the former, but also contributed to the increase in trade volume.
4To avoid complexity in notation, we simply use the same distributive parameter α for capital and land for agricultural produce. A variation of this parameter between the two sectors does not change the substance of the model. 5The relative productivity of the two sectors is reflective of international trade on the basis of a Ricardian comparative advantage doctrine. 6The land-owner's investment for agriculture sector infrastructure, such as irrigation, and for the reformation of the arable land is not included in our discussion of capital stock. 7We assume that the profits of a manufacturing firm accrue to the owners of the capital goods in the form of rentals. 8We can verify this observation in the parity condition of (3). 9In terms of Figure 2 the curveππ in the NW quadrant shifts upward by the opening of trade, whereas the savings curve ss in the SW quadrant shifts downward, resulting in the accumulation of capital goods. A draw of the agricultural workers to the manufacturing sector contributes to the increase in the marginal productivity of agricultural workers. As a result, the opening of trade in our model contributes to the increase in population.
IV. Granger Causality Wald Test Results in Vector Auto Regressions (VAR)
VAR is performed on four variables from 1801 to 1891, listed on Appendix
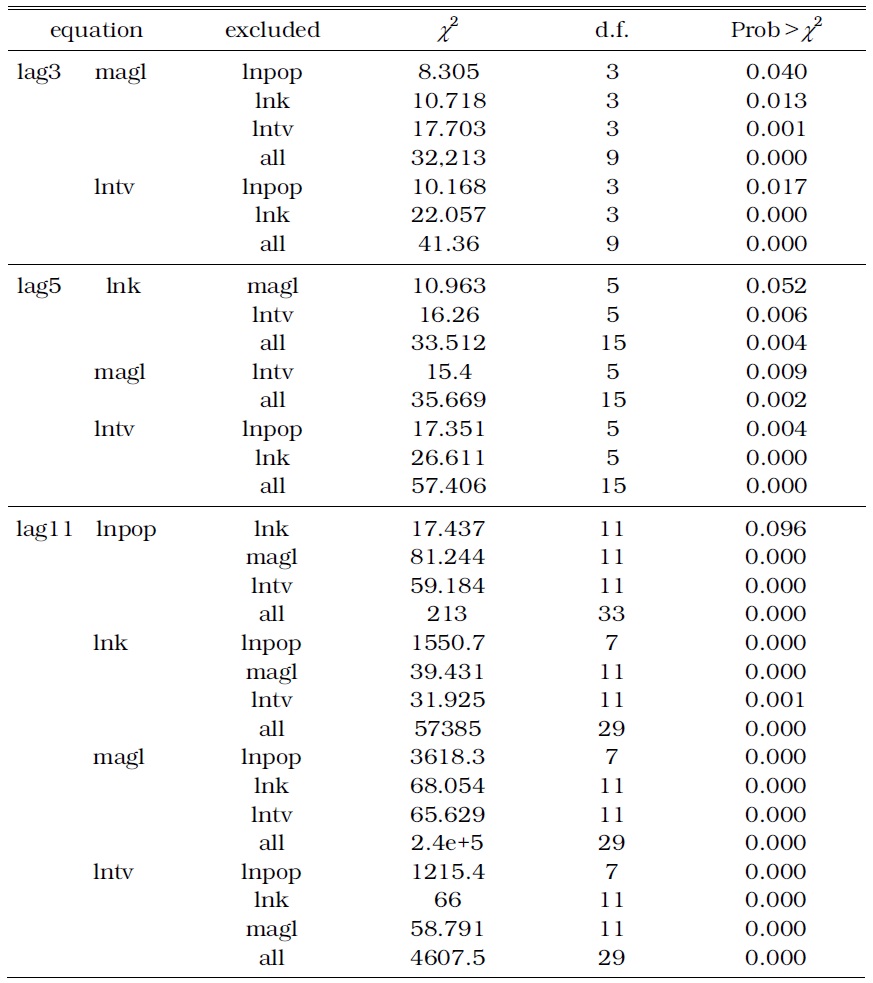
Table 2 presents the Granger causality test results on the structural changes in the British economy during the 19th century.12 The results on causality vary with the time lags allowed. Table 2 reports the results based on time lags of 3, 5, and 11.
[TABLE 2] GRANGER CAUSALITY WALD TESTS

GRANGER CAUSALITY WALD TESTS
The first row reports the test results for time lag 3. Both
The second row extends to the time lag 5 and shows that
The causality effects took more time for the population increase and capital accumulation than for the structural and trade volume changes.
10Here, magl≡LM/LA. 11Natural logs of the variables are prefixed by ln on them. 12We use a software-package, STATA11, for running the VAR.
V. Implication of Population Increase for the Growth of the British Economy during the 19th Century
The function of structural change in the British Industrial Revolution is rarely explored, except by Crafts (1985). We address this issue by employing the endogenous determination of the population equilibrium of a post-Malthusian economy. Given that our focal point is on augmenting the population associated with capital accumulation during the British Industrial Revolution, the present model can be categorized as a factor-driven growth model. The estimates of Crafts on the contribution of production factors during the Industrial Revolution (1760 to 1831) indicates that approximately 70% to 80% of growth is attributed to the inputs of capital and labor (Crafts 1981, Table 3.4). The present model conflicts with the estimates of Crafts. The contribution of technical progress for growth, measured by the residuals, only takes the share of the remaining 20%.
However, our argument does not undermine the importance of technical progress for growth. The ultimate cause of growth in an economy is technical progress or productivity improvement, which relieves the diminishing returns effect that rises from factor-driven growth. Therefore, direct or indirect effects are associated with factor-driven growth.
Population increase results in large-scale economies, which yields growth in an economy as in the argument of Boserup (1982) on population. Tsoulouhas (1992) proved the correlation of the number of printpatents with population size during the British Industrial Revolution, which supports the hypothesis of Boserup. Besides the mere size of population per se, we examine the growth effect of population from the aspect of supply, which varies with the way in which population growth is brought about. On the basis of a Lewis model, we determine that population increase is caused by capital accumulation. Capital accumulation transitions from manufacturing on the cottage level to that on the factory level. The factory system brings technical progress.
“Learning effects” as presented by Usher (1920) under the mills factory system illustrate the increase in productivity. Although the share of fixed capital investments for the manufacturing sector is not as high as its secondary effects (Field 1985), forthcoming growth is anticipated for the factory system (Berg 1994). Thus, a momentum in the accumulation of knowledge is generated when population increases.
However, the increase in population size associated with capital accumulation in the Lewis model carries “micro-inventions’’ of Mokyr accumulated over generations. Population increase implies an increase in apprenticeship, craftsmanship, and accumulated knowledge from past cohorts and passed over to forthcoming ones. Capital goods are the vehicles that transmit this accumulated knowledge over to the next generations and provide “learning by doing” effects. The accumulated knowledge embodied on capital goods allows the next generation to invest in human capital, which would sustain the growth of a modern economy. A factor-driven growth model of the present model in this respect is consistent with a Mokyr’s statement: Regardless of its source, the Industrial Revolution was above all an age of rapidly changing production technology propelled by technological creativity (Mokyr 2009).
Consequently, population increase associated with capital accumulation provides an economic environment favorable for technical progress and human capital investment. The increase in the amount of labor employed for the manufacturing sector instead of the agricultural sector results in a shift in the economic structure. The function of land input for production decreases, whereas the function of capital input increases. This observation is consistent with the hypothesis of Hansen and Prescott (2002) in the transition of technology from
Economic historians view the technologically innovative economic environments of Britain as one of the causes of the Industrial Revolution. In the rapidly changing British economy during the Industrial Revolution, interactions among population change, capital accumulation, economic structure, and international trade associated with technical changes are observed. Among these economic factors, determining which ones are primary, secondary, and tertiary or a derivative remains controversial. A two-sector model in the Lewis version abstracts itself from the complexities in the interactions among variables. A change in the economic associated with capital accumulation can explain the population size of the economy.
The Granger causality tests among these variables during the British Industrial Revolution are divided into three periods: (1) three years, (2) five years, and (3) 11 years.
A change in the economic structure is Granger-caused by population size, total trade volume, and total capital stock. In the five-year period, capital stock is Granger-caused by the total trade volume and by the rest of the variables. A Granger causality test on the population size occurs only after a lapse of eleven years. The test is crucial to structural change and total trade volume, which can be explained by population change taking more time than the rest of the variables.
Although technical change is presumed to propel the revolution, population increase drives economic growth in a post-Malthusian model. Productivity growth can effectively contribute to population growth. Our two-sector model demonstrates that capital accumulation shifts population upward. Population grows endogenously on this track of capital accumulation. Another important institutional factor is international trade, associated with a relative high technological level of the manufacturing sector to that of the agricultural sector, which contributes to population growth and the growth of the British economy by diversifying labor toward the manufacturing sector.