This paper examines downward nominal wage rigidity in Korea using aggregate and individual-level data. We find that the degree of downward nominal wage rigidity differs depending on the data sources used. Results from the aggregate data indicate that, on average, wages have been flexible. By contrast, evidence from the micro data suggests that nominal wages are downwardly rigid most of the time. We also find that downward nominal wage rigidity can differ across industries at both industry and individual levels. At the individual level, wage rigidity is greater in the service than in the manufacturing sector, even though the latter exhibits smaller volatility in its rate of wage growth.
After the Global Financial Crisis in 2008, many countries experienced a sudden increase in unemployment as they suffered from economic recession. Even after several years of financial crisis, unemployment has not returned to its previous level; instead, high unemployment rates have persisted. This phenomenon is somewhat puzzling. One may expect a high unemployment rate to lead to lower wages (the price of labor). In such a situation, unemployment can be alleviated through wage cuts. In reality, however, this adjustment rarely happens. Schmitt-Grohé and Uribe (2013) confirm that countries in the Eurozone have failed to adjust wages (measured as nominal hourly wages), which has resulted in widespread unemployment. The phenomenon by which the (nominal) wage is resistant to change is called the downward nominal wage rigidity (DNWR).1
Downward nominal wage rigidity can be particularly costly in a low inflation environment, a situation that many countries have faced in recent years.2 For example, when inflation is high, firms can adjust their labor costs by paying relatively lower real wages without cutting nominal wages. They can offset increases in labor costs with high inflation, resulting in the real increases in labor cost to be well below the nominal figures. On the contrary, avoiding large labor costs in a low inflation environment is more difficult for firms because they cannot reduce their real labor costs without actual wage cuts. Therefore, the unemployment rate may rise because the only way for a firm to cut labor costs is through adjustments in employment. Thus, the existence of DNWR may be an important force to account for the high unemployment rate during low inflation. Examining the existence or degree of DNWR may provide some insights into how the labor market responds flexibly to a sudden (exogenous) negative shock or to changing economic conditions.
A large volume of existing literature has examined micro data on the distribution of individual wage increases. In addition, many scholars have attempted to explain the sustained high unemployment rates in U.S. and Europe since the Great Recession by investigating the existence of nominal or real wage rigidity. Several studies suggest that nominal wage rigidity may have contributed to the persistence of high unemployment since the recent crisis. Similar studies have unveiled specific factors responsible for the high unemployment rates in Japan during its Lost Decade when concerns on deflation were high. Nevertheless, research on nominal wage rigidity in Korea has been scant. Thus, our paper attempts to provide certain evidence of nominal wage rigidity in Korea by using micro and macro data. In the past, the lack of proper individual wage data hindered researchers from examining this issue. However, household income panel data has become available since 1999, enabling us to document evidence based on existing literature and provide our own to support the existence of nominal wage rigidity in Korea.
Several strands of the literature have studied nominal wage rigidity; hence, before proceeding with our study, we present several strands closely linked to the concerns of this paper.
One strand of the literature assesses the extent of wage rigidity based on micro data by analyzing the distribution of wage growth (McLaughlin 1994, 1999, 2000; Kuroda and Yamamoto 2003; Lebow
Relevant studies on nominal wage rigidity in Japan are also noteworthy. For example, using industry- and aggregate-level data, Kimura and Ueda (2001) and Kuroda and Yamamoto (2005, 2014) establish that nominal wages were downwardly rigid until the late 1990s, but became flexible afterwards in respond to economic conditions. Yasui and Takenaka (2005), present different results, finding that nominal wage rigidity appears to be present even after the 1990s.
Most existing studies are quite limited in providing results comparable across different countries because of the lack of available data. Recently, Dickens
Very few studies on the downward wage rigidity in Korea exist, especially in the 2000s. Lee (1999) and Yoon (1994) investigate this issue, but finding other studies is difficult. Yoon (1994) assesses wage rigidity based on the wage equation using aggregate level data. Using Daewoo Panel data from 1992 to 1995, Lee (1999) documents that real wage rigidity is acyclical. The current paper attempts to provide empirical evidence of the existence of nominal wage rigidity using micro and macro level data. We also look for possible labor market implications.
This paper is organized as follows. Section II explains how we measure wage rigidity. Section III attempts to compare the degrees of nominal wage rigidity across countries using the relationships between inflation and the degree of nominal wage rigidity as well as between the rate of economic growth and the degree of nominal wage rigidity. Section IV presents evidence on how wages have evolved based on average rates of wage increase. Section V presents the degrees of nominal wage rigidity using individual wage data, and Section VI examines nominal wage rigidity based on industry-level data. Section VII concludes and suggests specific related issues for future research.
1Firms do not cut their employees’ wages for several reasons. One possible explanation is that firms fear the occurrence of moral hazards or worker’s resistance because of wage cuts. For further explanations, please see Akerlof et al. (1996). 2The U.S. inflation rate is below 2% as of September 2014, which is the same as Korea’s.
II. Measuring Downward Nominal Wage Rigidity
Downward nominal wage rigidity can be assessed in several ways depending on the data used and the way this rigidity is defined. Broadly speaking, the data used can be classified into two categories: macro level data, which tracks average wage growth for all workers in the economy, and individual-level data, which captures changes in wages in a survey sample.
In this paper, we scrutinize the degree of nominal wage rigidity based on aggregate level data, which refers to the average wage growth (or change) for all workers, along with individual-level data.3 The findings from these two data sources reveal that average wages have been flexible. They changed in the late 1990s and during the recent financial crisis. However, the evidence based on micro data suggests that nominal wages have been downwardly rigid most of the time. We also illustrate that DNWR can differ across industries both at industry and individual levels.
We provide descriptive evidence of DNWR based on our different two data sets. First, using the individual-level data, we calculate the wage growth of workers reporting earnings who held the same job for at least two consecutive years. Previous studies draw the distribution of wage changes and assess the existence of DNWR to determine i) whether a spike at zero exists, and ii) whether the distribution is skewed to the right. Instead of focusing on the distribution of individual worker’s wage growth, Dickens
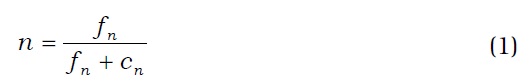
In Equation (1) from their paper,
We then evaluate the existence of DNWR along with other macroeconomic variables. We show how the wage growth of all workers has evolved over time. This approach enables us to examine the consequences of DNWR for macroeconomic adjustment through changes in unemployment when an economy is hit by a sudden shock. Using the same approach, Schmitt-Grohé and Uribe (2013) point out that DNWR has played a significant role in the Eurozone area, accounting for the rise in unemployment since 2008.
Discrepancies between the downward nominal wage rigidities can be observed in individual- and aggregate-level (defined by average wage growth among all workers in the economy) data. Considering that firms can adjust their wage bills based on the changes in their worker compositions, finding discrepancies is logical. Overall, even if DNWR exists in an economy, observing is difficult (Fuhrer
3We use data from the Korea Labor and Income Panel Study (KLIPS) from 1999 to 2010. KLIPS is a longitudinal survey of households in urban areas. The sample is about 5,000 households, and information is collected on labor force supply and mobility, income, consumption, education, job training, and so on.
This section tries to compare the degree of DNWR in Korea with the degree of DNWR in other countries. Most of the existing literature typically restricts attention to individual countries based on data availability. In contrast with other studies, Dickens
A number of issues arise when we attempt to compare nominal wage rigidity across countries. One such issue is the challenge of finding a consistent definition of nominal wage rigidity. We use the measure presented in Equation (1) because it is relatively easy to calculate and in-tuitively understandable. We also need to address the issue of time periods. When using individual-level data for cross-country comparison, exact matching of the time periods for different countries can be difficult. Dickens
Because n is the average value for different time periods and lengths of time from various countries, it is not ideal for direct comparison. Thus, we perform a cross-country comparison corresponding to inflation and growth rates.
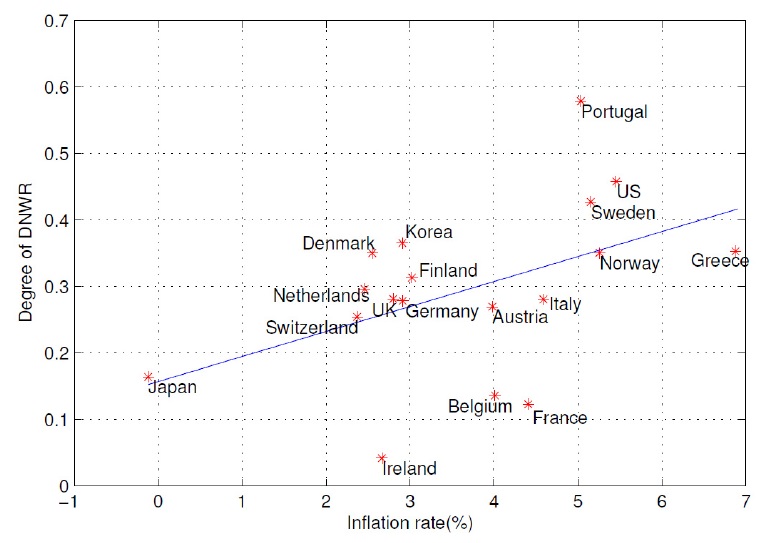
Figure 1 plots the degrees of DNWR5 and inflation rates for different countries. We run a regression of the measure of nominal wage rigidity, n, on inflation rates to determine whether countries with higher inflation experience lower nominal wage rigidity. The regression results indicate a slope of 0.04, which means that countries experiencing high inflation may have higher downward nominal wage rigidities. Most countries are at around the regression trend line. Ireland has the least DNWR, whereas Portugal has the highest. Countries with inflation rates of 2% to 3% (Denmark, Germany, and so on) have an average measure of nominal wage rigidity of between 0.2 and 0.4. Korea also experienced inflation in the 2% to 3% range from 1999 to 2010, but has a relatively higher degree of DNWR compared with other countries with similar inflation. Thus, Korea had a higher degree of DNWR during this period.
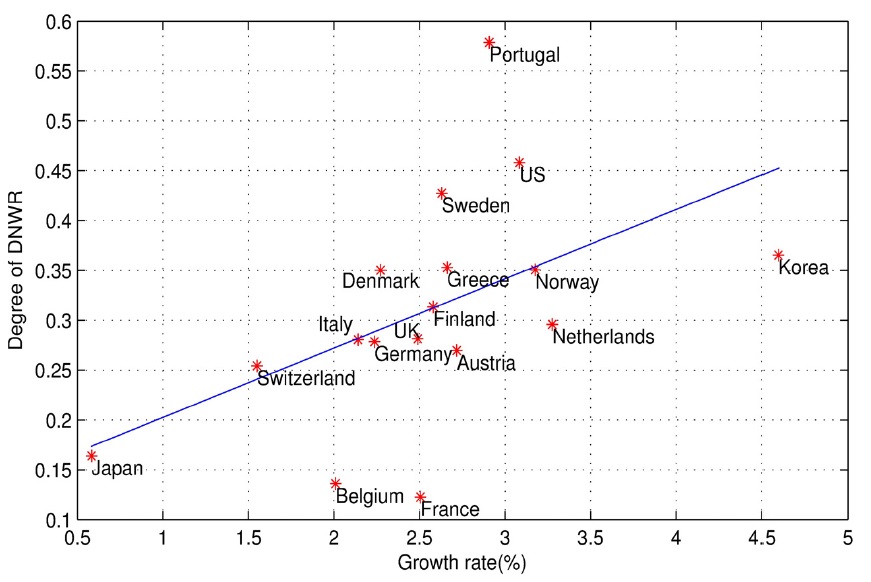
For another cross-country comparison, we examine the relationship between real economic growth rates and the degrees of DNWR. Figure 2 shows a scatter plot of economic growth rates and the degrees of DNWR. We run another regression using the degree of DNWR as the dependent variable and real growth as independent variable. We obtain a slope of 0.07 from this regression, and similar to our previous results, countries with higher rates of growth may experience higher degrees of DNWR. However, although this relationship appears clearly within countries with rates of annual growth below 3.5%, observing this relationship in countries with higher growth is difficult.
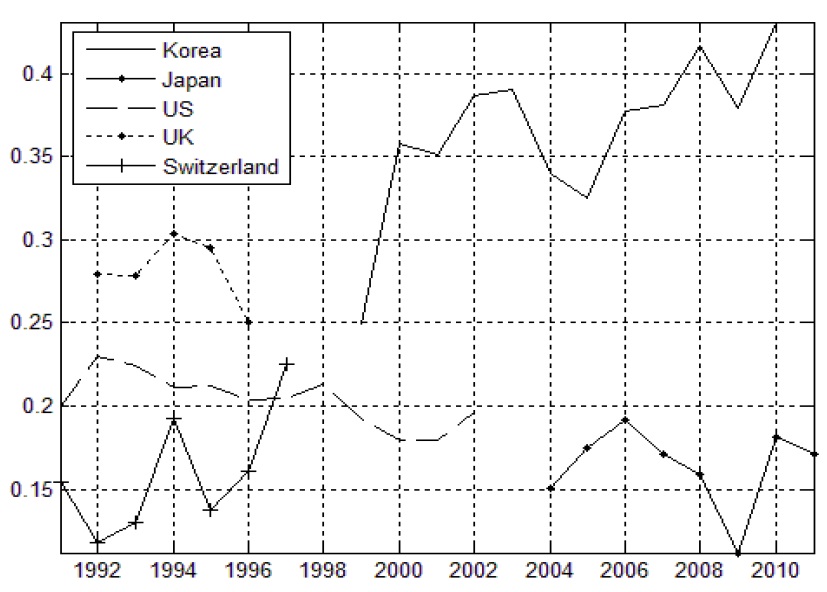
Figure 3 plots the times series of nominal wage rigidity for Korea, Japan, the U.S., the U.K., and Switzerland for the periods of data availability. The data for Korea are from Figures 1 and 2, and those for other countries are from Smith (2000), Fehr and Goette (2005), Elsby (2009), and Kuroda and Yamamoto (2013). Overall, n does not exceed 0.3 for most countries. In Korea, n is greater than 0.3 except in 1999, and tends to increase over time. This simple comparison reveals that nominal wage rigidity is greater in Korea than in other countries.
Plotting the average degrees of DNWR, the figure shows that countries with higher inflation experience greater DNWR. However, Korea has a higher degree of DNWR compared with other countries with similar rates of inflation. A positive relationship between the rate of economic growth and the degree of DNWR may exist; however, the data indicate that the relationship is not strong with few outliers. We do not attempt to claim that either higher inflation or higher growth is the cause of a greater DNWR. Our purpose is to determine the degrees of DNWR of Korea, along with those in other countries. Based on Figures 1 and 2, Korea appears to have experienced a relatively higher DNWR compared with countries with similar rates of inflation or growth.
4Ireland, Denmark, France, Belgium, the UK, Switzerland, Austria, Germany, Italy, the Netherlands, Finland, Norway, Greece, Sweden, the U.S., and Portugal 5Figure 1 uses the average value of n for each country and time period.
IV. Downward Nominal Wage Rigidity in Korea
Thus far, our analyses have focused mainly on the average degree of DNWR in Korea compared with the average degree of DNWR in other countries. We have demonstrated that DNWR is higher in Korea than in countries with similar inflation or growth rates. What then does this mean? If DNWR exists, asking whether it plays an important role in economic performance is logical. In particular, does a higher degree of DNWR cause a higher unemployment rate when an economy is hit by a negative shock? We analyze overall rates of wage increase along with other economic variables such as inflation, growth, and unemployment to address this question. The results will give us an idea as to how the rate of wage increase changes in accordance with the economic conditions in Korea.
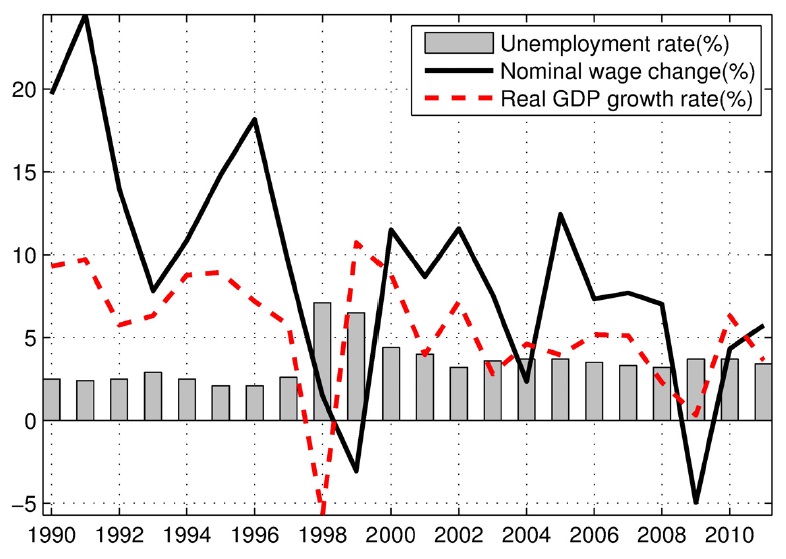
Figure 4 plots the Korean unemployment rate (%), average change in wages for all workers (%), and real economic growth rate (%) from 1990 to 2011. The economy was hit by negative shocks in 1997 and 2008. The growth rate plummeted to -5.7% in 1998, following the 1997 currency crisis, and was near zero in 2009 after the Global Financial Crisis. Interestingly, the changes in nominal wages occurred one year after a negative shock. Their volatility was significantly larger than expected based on our findings in the previous section. Thus, changes in wages appear to be quite flexible in response to negative shocks. For example, the unemployment rate in 1998 surged to 7.7% before declining to around 3%, indicating that unemployment soon returned to its average rate because of adjustments in wages.
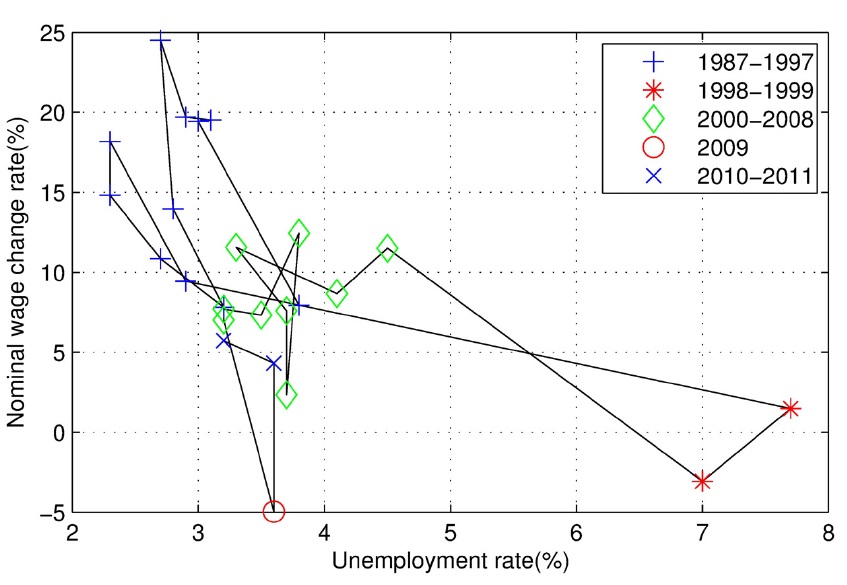
Figure 4 indicates how wage growth and unemployment have evolved over time. We focus our attention to the wage Phillips curve and further examine the relationship between wage growth and unemployment. Figure 5 plots the rates of wage increase and unemployment from 1987 to 2011. We split the sample period into five subperiods: i) 1987-1997 (preAsian currency crisis), ii) 1998-1999 (during the currency crisis), iii) 2000-2008 (before the Global Financial Crisis), iv) 2009, and v) 2010-2011 (the post-global crisis period). From 1987 to 1997, the wage Phillips curve indicates the expected relationship between wage growth and unemployment. Unemployment ranges from 2% to 4%; the rate of wage growth falls when unemployment rises. When the economy is hit by the crisis, the rate of wage increase falls to almost 0% and the unemployment rate soars to 7.7%. Wages decline in the following year. If they had not, Korea may have possibly have suffered a higher unemployment rate, lasting for a longer period.
In addition to unemployment, changes in nominal wages are also related to how firms determine prices. Under stable mark-up rules, Kuroda and Yamamoto (2013) indicate that inflation (Δ

where
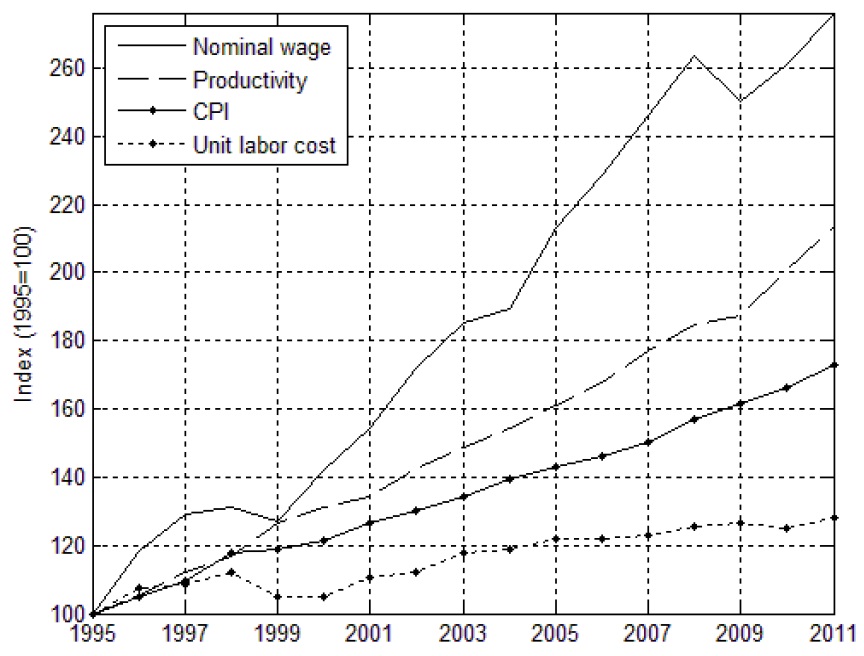
Figure 6 illustrates the nominal wage, labor productivity, price, and unit labor cost (with 1995=100). Interestingly, all of these factors tend to rise over time. According to Equation (2), increases in wages and labor productivity have different effects in determining the unit labor cost. For example, an increase in nominal wage (equivalently, wage growth,
From Figure 6, we can observe that the price level (CPI) grows rapidly during the period when the unit labor cost grows sluggishly. The labor share, (
The findings in this section can be summarized as follows. Nominal wage growth adjusts when economic conditions lag. The volatility of wage growth is also larger than expected. The negative wage growth resulting from the crisis shocks in 1999 and 2009 may have contributed to a stable unemployment rate. The data show that although nominal wages grew rapidly, their influence on the price level was offset because of increased labor productivity and the labor share remaining stable over the period. These findings suggest that other factors may have contributed to inflation at that time.
6The variation in labor share from 1995 to 2011 is limited, with the variation being 60.4% in 1995 and 59.5% in 2011.
V. Measuring Downward Nominal Wage Rigidity using Micro Data
In this section, we analyze individual-level data and report specific results. For this purpose, we use the Korean Labor and Income Panel Study (KLIPS) from the Korea Labor Institute. The KLIPS is a longitudinal survey of household and individuals that was first launched in 1998. The data contain records of each sample household member’s job and income history.
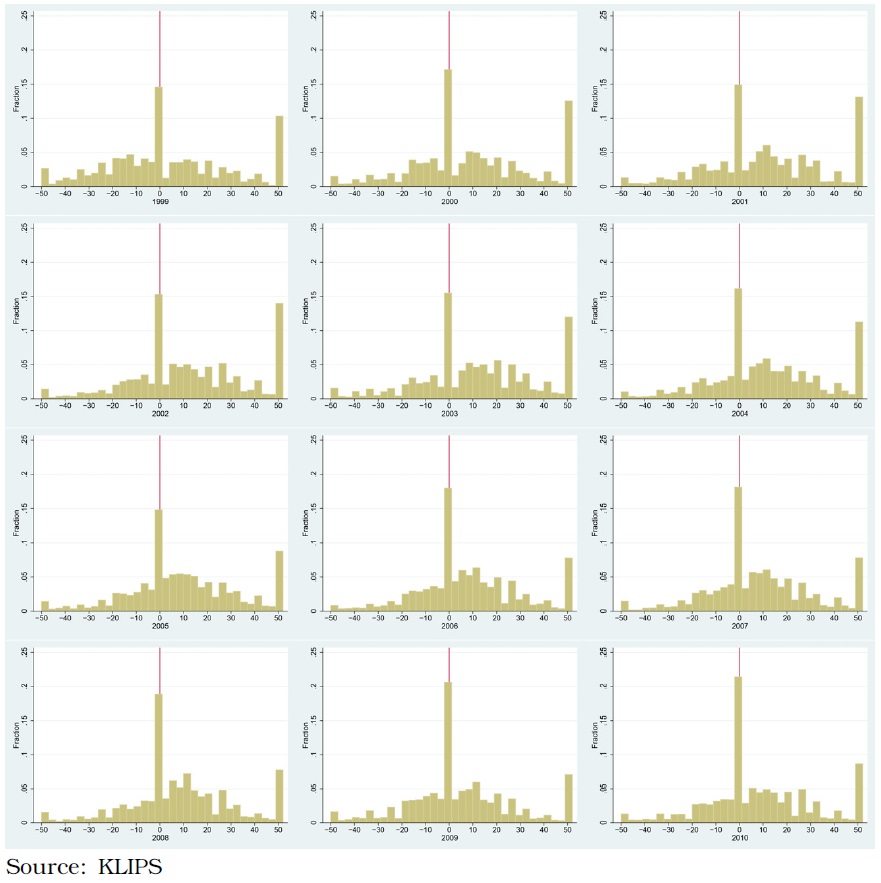
We plot the distribution of changes in wages and examine whether we can observe DNWR in Korea. Figure 7 shows a histogram of wage changes from 1998 to 2010. A spike at around zero is evident for almost all years, and the distribution is skewed to the right. Downward nominal wage rigidity appears to exist in Korea. We attempt to measure the DNWR by following Dickens
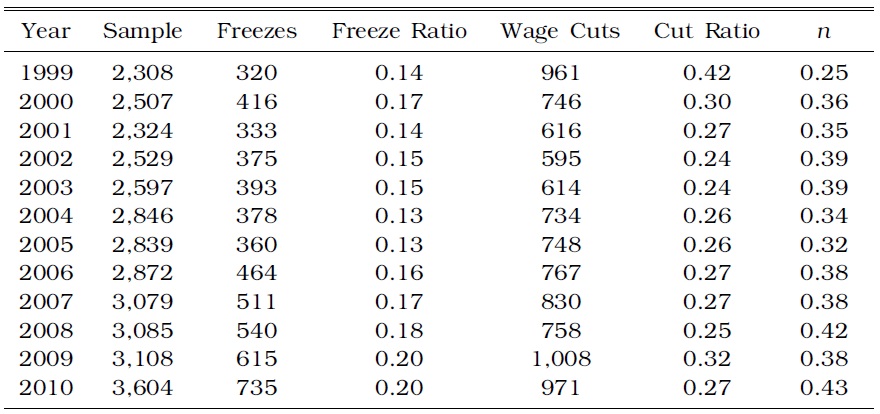
From the KLIPS, we calculate the numbers of workers whose wages were frozen and cut for every year, and then report
[TABLE 1] SUMMARY OF NOMINAL WAGE CHANGES: 1999-2010

SUMMARY OF NOMINAL WAGE CHANGES: 1999-2010
Figure 7 indicates the degree of DNWR; the x-axis denotes the changes in nominal wages8 (%) and the y-axis represents the fraction of workers (%) in each wage change bin. A distinctive feature is that the distribution is highly condensed around 0. The percentage of workers experiencing wage freezes was over 15% in 2002 and over 20% in 2009. This fraction appears to increase significantly over time, thereby resulting in an overall increase in
Table 1 illustrates the fraction of workers who experienced wage freezes and cuts, along with the DNWR (
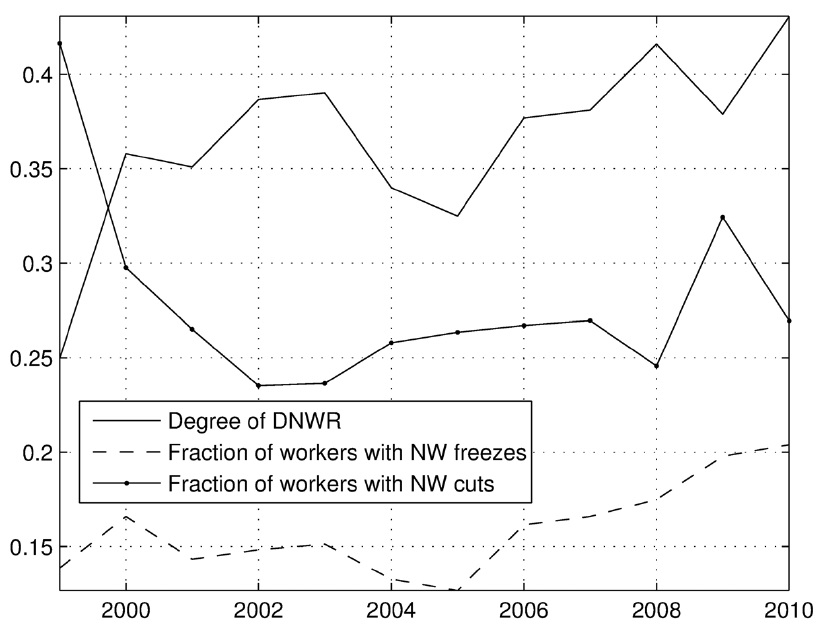
Figure 8 plots specific statistics from Table 1 to check for any trends. The overall degree of wage rigidity, measured as
We need to note that discrepancies in the degrees of wage rigidity may exist, depending on the data. For example, Fuhrer
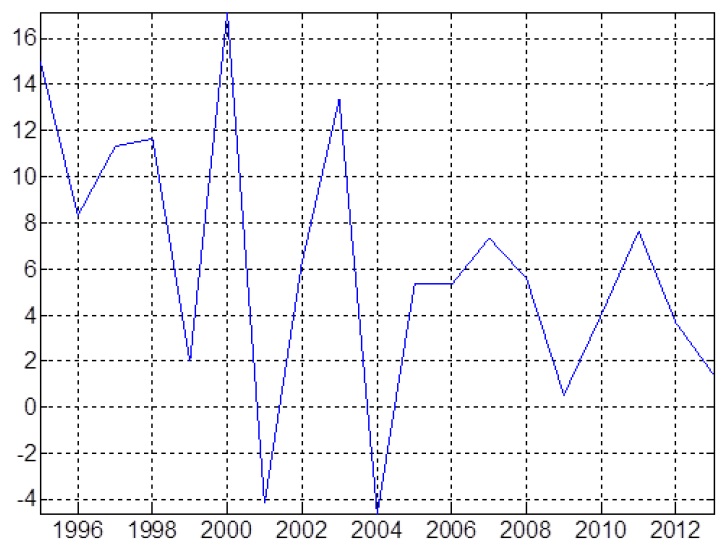
We investigate this possibility using the data from the “Report on Labor Costs of Enterprises” survey from the Ministry of Employment and Labor from 1994 through 2013. Figure 9 supports our conjecture. The data shows that firms have apparently been able to adjust their labor costs flexibly. In response to the Asian currency crisis in 1998, the rate of labor cost increase fell by 9.7%. We can also observe specific instances of a decline in labor costs in 2000 and 2003. Hence, we suggest that the difference observed in our two source data may be derived from the abilities of firms to change their labor costs when necessary.
However, one should be careful when interpreting this explanation as evidence of inconsistency in wage rigidity at the individual level. We consider the possibility that in the face of negative shocks firms can flexibly change their labor costs via compositional changes in workers. We investigate this issue more deeply in the next section by using as much industry-level data as available.
7We only consider whether they keep the same “main” job. 8We consider employees who experienced wage increases of 50% or more as employees who had 50% changes in wages.
VI. Downward Nominal Wage Rigidity at the Industry Level
Section V shows that findings as to the existence of nominal wage rigidity may differ depending on the data used. This inconsistency is because of firms being able to change their labor costs flexibly by adjusting their compositions of workers. Evaluating this claim is difficult because of the lack of micro data observations. Thus, as an alternative, we investigate the issue at the industry level and use data from the “Survey Report on Labor Conditions by Employment Type” from the Ministry of Labor and Employment.9 With this data, we can calculate the average rates of wage growth at the industry level and consider how the numbers of temporary workers change over time.
In this section, our industry-level analysis is based on the findings in existing literature. Kuroda and Yamamoto (2013) note that nominal wages and prices move in similar directions, and they determine this to be the cause of deflation in Japan. However, they also find that this phenomenon may not hold across sectors. They document that nominal wages in the manufacturing sector have increased even with declines in average prices of durable goods. By contrast, the service sector experienced wage increases as service prices rise. These findings suggest that nominal wage rigidities can differ at the macro and industry levels.
Section III reveals that overall changes in wages appear to be flexible and made with some lags. Following Kuroda and Yamamoto (2013), we investigate whether such DNWR can also be found at the industry level in Korea.
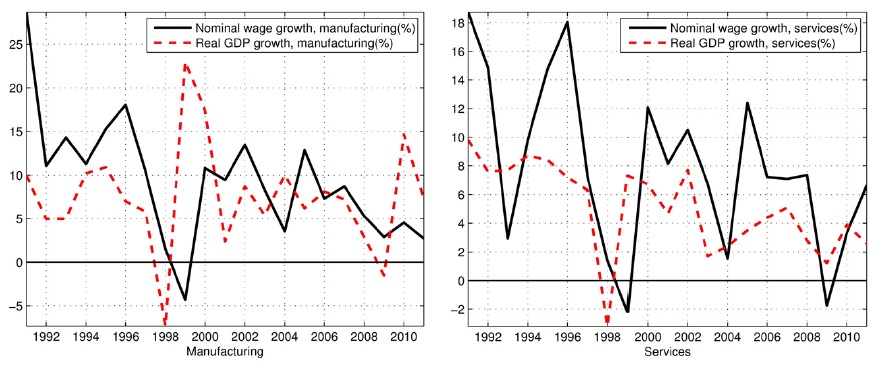
Figure 10 indicates that the growth in the manufacturing sector exhibits higher volatility than the growth in the service sector. In 1998, the growth rates of the manufacturing and service sectors declined by -7.3% and -3.2%, respectively. Wage increase rates were also negative at -4.3% and -2.2%, respectively. In 2008, a different picture can be observed. The manufacturing sector did not cut wages following the Global Financial Crisis; instead, wages increased even under conditions of unfavorable growth. The service sector, on the other hand, cut wages by -1.8%, confirming that DNWR may be higher in the manufacturing sector, as discussed in Kuroda and Yamamoto (2013).
Wage rigidities at the industry level may differ from those at the individual level for two reasons. First, overall wages may not fall when some workers receive high wage increases that offset wage cuts for the rest of the workers. In this case, averaging the rate of wage increase may be misleading. Second, we need to consider the substitutability of the labor force in each industry. For example, let us suppose that an industry can change its labor force composition in response to a shock. When hit by a sudden negative shock, this industry will fire workers with high salaries and replace them with cheaper labor. In this case, although the overall rate of wage increase may fall, this phenomenon may not be observed when plotting wage growth using the individuallevel data of workers remaining on the job. These workers are likely not substitutable, and thus maintain higher wage levels; demanding wage cuts for these employees is difficult. We plot the changes in wages using individual-level data and examine the proportion of part-time workers (who receive lower wages) in each industry to determine whether these factors can be utilized in explaining the differences in wage rigidity across industries.
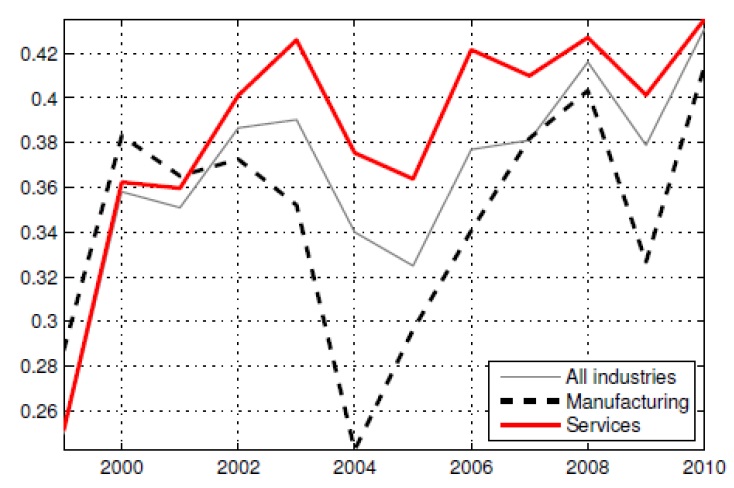
Figure 11 depicts the measure of DNWR (
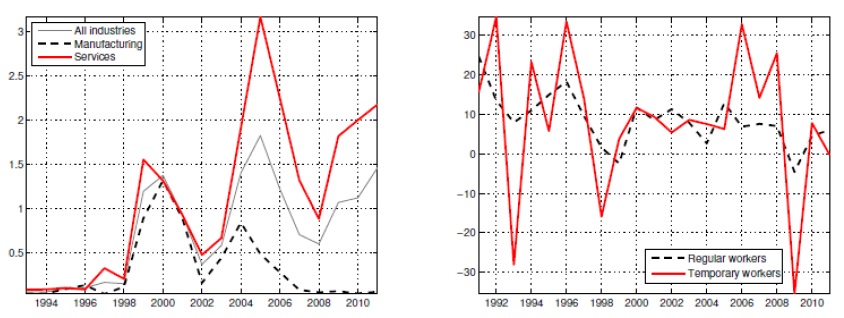
When substitutability of workers is possible or when firms can replace current workers with cheaper labor, the average wage growth may appear flexible. This wage growth differs in the individual-level data, which only tracks the changes in wage growth among workers who keep their jobs. Hence, to examine this finding as a possible explanation for the differences in DNWR across industries, we calculate the proportions of parttime workers in each industry. Care is necessary when interpreting the results because they are not temporary workers. The definition of parttime workers in the data is not exactly equal to the definition of temporary workers.
The left-hand panel in Figure 12 gives the proportions of part-time workers in the manufacturing and service sectors from 1993 to 2011, whereas the right-hand panel illustrates the changes in their wages during that time. As expected, the changes in wages of temporary workers are rather volatile compared with the changes in wages of regular workers. The manufacturing sector has relatively fewer temporary workers, which explains why the average manufacturing sector wage tends to be persistent. The smaller proportion of part-time workers makes it difficult to change the overall wage flexibly.
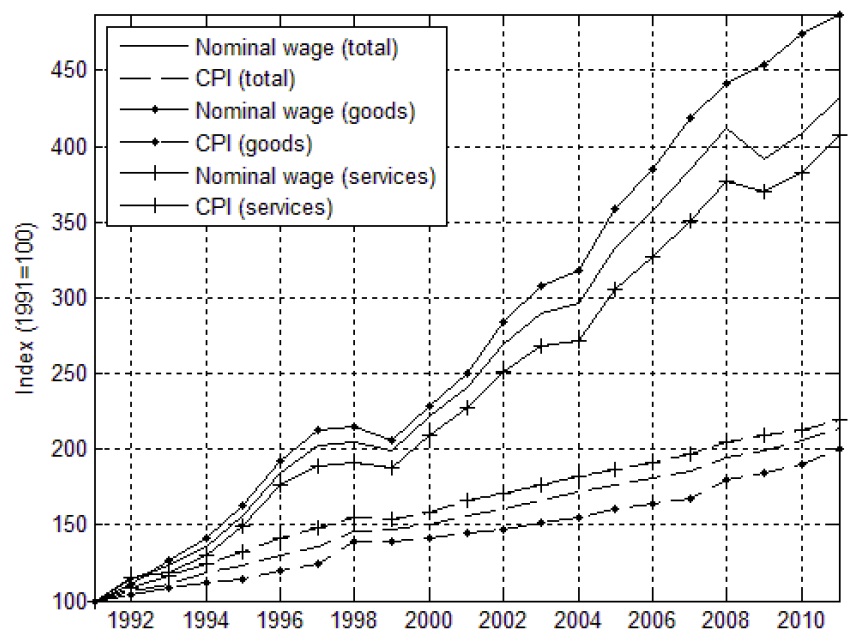
Downward nominal wage rigidity may influence the price setting by firms, which ultimately affects the overall price level. We construct nominal wage and consumer price indices (with 1991=100) for each industry, as shown in Figure 13. Wages appear to be higher in the manufacturing sector despite the price level for that sector being low. Based on Equation (2), an increase in manufacturing sector labor productivity may possibly have led to a drop in unit labor cost. Another possibility is that the labor share (
9This survey of a sample of about 32,000 establishments is conducted annually.
This paper documents the existence of DNWR using micro and macro data at the aggregate and industry levels from 1980 to 2011. At the macro level, wage levels adjusted flexibly on average with lags. The lagged adjustment is because wage contracts are entered into at an annual basis and no immediate change occurs in response to a shock. In contrast with the evidence from the macro level data, the micro data suggest that nominal wages are downwardly rigid and the degree of wage rigidity increases over time. Discrepancies arise when firms can adjust their labor costs through changes in their labor force compositions. Although we have examined whether these discrepancies might be due to differences in available data, further research on this issue is necessary to address the questions raised.
The results also indicate the existence of differences across industries. On average, wage volatility in the manufacturing sector is smaller than that in the service sector, with higher DNWR at the individual level. Based on this evidence, we suggest possible explanations to reconcile the discrepancies between the macro- and micro-level findings, and between the industry- and individual-level findings within each industry.
The findings in this paper indicate that firms have been able to adjust their labor costs in response to economic conditions even with nominal wage rigidity observed at the individual level. This nominal wage rigidity appears to be greater in Korea than in other countries, and has increased over time.
In this paper, we focused on the existence of DNWR using descriptive measures; thus, a more precise quantitative analysis is required to further support the possible explanations offered here.