Individuals differ not only in their physical characteristics, such as height, weight, facial attractiveness, and skin color, but also in their psychological makeup, including personality and intelligence. Both intuition and research suggest that these individual characteristics influence important aspects of a person’s life course, including health and longevity. For example, considerable evidence suggests that various aspects of personality are associated with mortality, as well as with health behaviors like smoking, drug use, and alcohol consumption (Smith and MacKenzie 2006; Ozer and Benet-Martinez 2006). Although controversial, the bulk of research indicates that cognitive ability, or intelligence quotient (IQ), affects somatic and mental health, as well as mortality (Gottfredson 2004; Deary
Nonetheless, past studies have been limited in three important respects. First, these traits – personality, intelligence, and physical attractiveness – have considerable genetic heritability(Kern and Friedman 2011) and, therefore, are inseparable in a relationship with health outcomes. However, most past literature has examined the effect of only one or two traits on health. For a more comprehensive understanding of health risk factors, these individual features should be integrated in a model.
Second, most past studies have examined one personality trait at a time, or a single health outcome; thus, it is difficult to distinguish the relative importance of these personality domains or to determine whether they affect all health outcomes equally. Furthermore, the use of varying personality instruments has led to inconsistent findings across studies, and, although health is equivalent to neither a mere absence of disease nor a long life (Friedman
Third, it remains unclear how personality, intelligence, and physical attractiveness are correlated with each other and with health behaviors. These traits are closely interrelated (Langlois et al. 2000) and have a complex causal chain in the subsequent development of one’s life course, including socioeconomic status and health behaviors (Almlund
Using the Wisconsin Longitudinal Study (WLS) – a unique dataset that includes facialattractiveness ratings based on high school yearbook photos, measures of the Big Five personality traits, and IQ scores, along with rich sociodemographic and health information – the present study explores (a) which, and to what extent, personality traits are associated with health outcomes (i.e., all-cause mortality, self-rated health, depression, and number of physical symptoms); (b) whether IQ has protective effects on health; (c) whether facial attractiveness is associated with health; (d) whether these variables are mediated by health behaviors (i.e., smoking, alcohol consumption, and physical exercise); and (e) whether the foregoing relationships differ by gender. Moreover, this study compares and contrasts results from the WLS with results from the Americans’ Changing Lives (ACL) study, which sampled from a considerably more diverse population and which provided a similar set of predictors.
>
Personality Traits and Health
Interest in the link between personality and health can be traced back to the ancient Greeks, who believed that an imbalance among the four bodily fluids (blood, phlegm, yellow bile, and black bile) – called humors – could result in physical and psychological illness (Friedman and Booth-Kewley 1987; Kern and Friedman 2011). For example, the Greeks thought that an excess of black bile led to depression and eventually physical illness.
While the humors have been replaced with hormones, efforts to find a link between personality and health have continued in the modern era. A scientific approach to the personality-health relationship began with Friedman and Rosenman, who found that men with an “intense, sustained drive for achievement and being continually involved in competition and deadlines” (Friedman and Rosenman 1959: 1286) were seven times more likely to have clinical artery disease than matched controls. This type of behavioral pattern, later known as type-A personality, spawned a substantial number of studies examining the role of personality as a health risk factor (Deary
Although several models of personality exist, Roberts defined personality traits as “the relatively enduring patterns of thoughts, feelings, and behaviors that reflect the tendency to respond in certain ways under certain circumstances” (Roberts 2009: 149). He suggested that personality traits should be distinguished from mental abilities, although both are affected by genetic predispositions. According to Roberts’ conceptual framework, personality traits and cognitive abilities, along with preferences (e.g., goals, interests, life tasks) and narratives (e.g., stories, significant memories), affect one’s identity and reputation, in turn, shaping individuals’ roles in society. Roberts also envisioned feedback processes among all components, such as the possibility that identity may affect personality traits and/or mental abilities.
With respect to the taxonomy of personality traits, a growing consensus amongpsychologists supports the five-factor model (FFM) of personality, or the Big Five traits (McCrae and John 1992; Goldberg 1993). The FFM is based on the notion that basic dimensions of personality can be discovered by decoding trait terms because all important individual differences have been noted in regular language (McCrae and John 1992). The FFM is comprised of extraversion, agreeableness, conscientiousness, neuroticism, and openness to experience or intellect (John and Srivastava 1999). Extraversion captures gregarious, energetic, and expressive features of behavior and includes traits such as sociability, activity, assertiveness, and positive emotionality. Agreeableness captures a prosocial orientation toward others and includes traits such as altruism, tender-mindedness, trust, and modesty. Conscientiousness describes multiple elements of persistence and impulse control in task- and goal-oriented settings, such as following norms and rules and planning, organizing, and prioritizing tasks. Neuroticism reflects emotional instability and negative emotionality, such as feeling anxious, nervous, sad, or tense. Finally, openness to experience refers to traits such as imaginativeness, curiosity, creativeness, and susceptibility to absorbing experience (John and Srivastava 1999; Costa and McCrae 1994; Goldberg 1993).
Of these five factors, neuroticism is perhaps most important to public health because it is robustly correlated with a wide array of both mental and physical health problems (Lahey 2009). Empirical evidence indicates that the predictive power of neuroticism on health outcomes is not trivial. For example, using data from the National Survey of Midlife Development in the United States (MIDUS), Chapman
More recently, conscientiousness has also been identified as a significant predictor of health outcomes, and its implications for public health also appear to be significant. Roberts and his colleagues (2007) reviewed evidence from 34 studies on the predictive power of the Big Five personality traits compared to that of IQ and SES for longevity. Their meta-analysis showed that conscientiousness was a stronger predictor of longevity than any other Big Five trait and was also a stronger predictor than either IQ or SES. Likewise, using data from the Terman Longitudinal Study, Savelyev (2012) demonstrated that, even after accounting for measurement error and reverse causality, omitting conscientiousness from a model was comparable to the bias from omitting all other control variables, including parental education, occupation, and origin, as well as many other variables that predict mortality.
Unlike the literature on neuroticism or conscientiousness, existing literature on the effects of agreeableness, extraversion, and openness to experience on mortality is inconsistent (Roberts
Some researchers have found a positive effect of openness on mortality. For instance, in a population-based prospective study, openness predicted all-cause mortality after accounting for medical risk factors, health behaviors, and individual differences in hostility and neuroticism (Surtees
Personality may affect health outcomes through four potential pathways (Smith and MacKenzie 2006). First, the health behavior model posits that personality influences healthrelevant habits, such as smoking, diet and exercise, and medical check-ups. A variety of health behaviors are associated with the major domains of personality (Bogg and Roberts 2004; Terracciano and Costa 2004), and these health behaviors may mediate the association between personality and development of subsequent diseases and illnesses.
Second, the interactional stress moderation model suggests that personality influences the appraisal of stressful life events, as well as coping strategies. Individual differences in appraisal and coping strategies can result in differences in physiological responses to stressors – for example, greater cardiovascular reactivity, higher morning levels of cortisol, or prolonged suppression of secretory immunoglobulin – (Lahey 2009), which in turn contribute to the development of diseases (Sutin
Third, the transactional stress moderation model posits that personality influences an individual’s exposure to potential stressors and stress-reducing interpersonal resources like social support. Through decisions to enter or not enter particular situations, and intentional or unintentional alteration of interpersonal contexts, individuals influence the social environment that they encounter in their daily lives. Differing exposure to negative life events could enhance the contribution of personality to the level of everyday stressors (Lahey 2009; Hutchinson and Ruiz 2011).
Finally, the constitutional predisposition model and the confounding model from Deary
Like personality, intelligence is also associated with various health behaviors and outcomes. Gottfredson (2004) argued that a general intelligence factor, g, is the fundamental cause ofhealth disparities. According to Gottfredson, a social epidemiological model of health disparities that emphasizes material resources (e.g., income and access to healthcare) cannot explain why health differentials by social class continue to exist across diverse times, places, and diseases, or why these differentials have grown despite improvements to healthcare systems.
Intelligence appears to be correlated with mental health. For instance, using data from two large British birth cohort studies, Gale
There is also some evidence that intelligence is linked to physical health outcomes. Batty
Intelligence appears to be associated with specific causes of death as well. For instance, Hart
Furthermore, studies examining personality and intelligence jointly have found a significant relationship between intelligence and health outcomes. Maier and Smith (1999) used Berlin Aging Study data to relate measures of intellectual functioning, as well as personality traits such as neuroticism, extraversion, and openness, with all-cause mortality. Intellectual functioning was the strongest and most robust predictor for mortality. Similarly, Weiss
There are four pathways through which intelligence and mortality may be associated (Deary 2008). First, high intelligence leads to educational success, placement in high status occupations, and, ultimately, high income (Deary
Recently, a growing body of research has found null or very weak effects of intelligence on health. For example, using the WLS data and survival analysis, Hauser and Palloni (2011) found that the relationship between IQ and mortality was significant after controlling for social background factors. However, the coefficient for IQ was reduced substantially and became insignificant when high school rank was included in the model. Furthermore, the effect of high school rank on mortality was three times larger than the effect of IQ. Hauser and Palloni suggested that high school rank is a cumulative measure of cognitive ability plus responsible, compliant, and consistent behavior over the long term and, thus, is a better predictor of mortality than IQ alone. In addition, Hauser and Palloni claimed that conscientiousness is a superior measure to IQ given the similarity between conscientiousness and high school rank. Another study using the cumulative 1974-2000 General Social Survey showed that the association between intelligence and self-rated health was very sensitive to SES controls, although the coefficient for intelligence was significant (Schnittker 2005). Moreover, contrary to Gottfredson's (2004) claim, intelligence did not account for health disparities between whites and blacks.
>
Physical Attractiveness and Health
An individual’s overall attractiveness is multidimensional and only approximated by assessments of facial or physical attractiveness (Berry 2000). Three major components make a face beautiful (Rhodes 2006): averageness, symmetry, and sexual dimorphism.
First, although it is somewhat counterintuitive, faces that are close to the population’s average are consistently judged attractive (Rhodes 2006; Berry 2000). For instance, Langlois and Roggman (1990) created composite faces by digitally averaging pictures of young adults using 2, 4, 8, 16, and 32 pictures. Composite faces created with 2, 4, or 8 photos were not rated as attractive; however, raters did assess those composite faces that were based on 16 or 32 pictures – and so were closer to the population’s average – as attractive. Second, like many other animals, humans prefer symmetrical faces (Rhodes 2006; Berry 2000). Finally, sexual dimorphism (or exaggerated features) refers to masculine features in a male face and feminine features in a female face (Rhodes 2006). Evolutionary psychology literature suggests that the features that make a face attractive are rooted in humans’ evolutionary history. That is,averageness may indicate developmental stability, resistance to disease, and optimum functionality, which, ultimately, signal aspects of mate quality.
The association between physical attractiveness and health is discussed mostly within the good genes theory. The good genes theory suggests that humans’ judgments of physical attractiveness, particularly when selecting a mate, have evolved to respond to heritable cues reflecting underlying health status (Weeden and Sabini 2005; Gallup and Frederick 2010). Considerable evidence supports the hypothesis that both facial and bodily attractiveness are health certifications and accurately represent genetic quality. For example, body symmetry is positively associated with attractiveness (Geary
Despite the evidence that attractiveness is associated with other physical traits, a relatively small number of studies has explored whether facial attractiveness is associated with mortality or morbidity. The evidence is mixed. Using the Intergenerational Studies data, a longitudinal study of people born in the 1920s in California, Kalick
In contrast, Shackelford and Larsen (1999) studied 100 undergraduates in the U.S. who reported daily physical symptoms including headaches, runny or stuffy nose, nausea or upset stomach, muscle soreness or cramps, sore throat or cough, backache, and jitteriness, as well as a measure of cardiovascular recovery. The authors correlated attractiveness with these health measures and found that attractive participants displayed greater cardiovascular health and complained less often of a headache or a runny or stuffy nose compared to their less attractive counterparts.
Among Canadian undergraduates, Hume and Montgomerie (2001) showed that facial attractiveness was positively associated with a health rating based on the incidence and seriousness of past diseases for women, but not for men. Also in Canada, Henderson and Anglin (2003) used high school yearbook photos from the 1920s to examine the association between ratings of facial attractiveness and year of death. They found a positive relationship between attractiveness and longevity for men and women but failed to find a significant link between perceived health and longevity (Langlois
In addition to direct effects, physical attractiveness may also affect mortality and morbidity via SES. For example, a physically attractive person is more likely to be employed and earnmore (Hamermesh and Biddle 1994; Mobius and Rosenblat 2006; Judge
Although evolutionary theories generally suggest that physical attractiveness is positively associated with health for both sexes, based on results from a meta-analysis, Weeden and Sabini (2005) argued that the empirical evidence to date indicates the effect may be limited to females in most Western societies (see Grammer
Data for this study were drawn from the Wisconsin Longitudinal Study (WLS). The WLS is a study of a random sample of 10,317 men and women who graduated from Wisconsin high schools in 1957, as well as their randomly selected siblings (Sewell
To check that findings from the WLS are not idiosyncratic to the particular dataset, I supplemented the analysis with an examination of the Americans’ Changing Lives (ACL) survey. The ACL is a stratified, multistage area probability sample of non-institutionalizedadults ages 25 and older living in the contiguous U.S. (House
In the present study, the dependent variable is the waiting time until the occurrence of an event (i.e., death). Since respondents must have been alive on the 1992-94 interview dates (when the personality instrument was administered for the first time), the dependent variable was the years of life from the 1992-94 interview dates through December 2011. The year and month of death for the WLS respondents were updated periodically using the Social Security Administration’s Death Index. By the end of 2011, 2,033 (19.7%) respondents were reported to be deceased. Those who were alive at that time were treated as censored. Those whose death date was not ascertained, i.e., individuals deceased between two waves but their exact year of death was not confirmed, were censored at the most recent interview date (
In addition to mortality, three health outcomes were used as dependent variables in this study. First, mental health was measured with a depression scale (the modified CES-D). Controlling for depression is important when examining the effect of personality traits on health outcomes because instruments for depression overlap personality items (Lahey 2009). Thus, failure to account for depression overestimates the effect of personality. Second, selfrated health (SRH) was measured by the following question: “In general, would you say your health is excellent, very good, good, fair, or poor?” It is well established that self-rated health is closely associated with mortality and actual health (Idler and Benyamini 1997). Self-rated health was collapsed into a dichotomous variable (“1” if SRH equals poor or fair and “0” otherwise). Finally, the total number of illnesses was the sum of physical illnesses that medical professionals had ever diagnosed in the respondent.
Facial Attractiveness
During summer 2004, 33 judges who participated in the Madison Senior Scholars program were recruited to rate the facial attractiveness of WLS respondents’ yearbook photos. The mean age of the judges was 78.5 years, and judges’ ages ranged from 63 to 91. A total of 3,007 WLS respondents’ yearbook photos from 1957 and a sub-sample of 258 WLS respondents’ yearbook photos from 1956 were randomly selected and rated (Meland 2002). Six men and six women rated each yearbook photo using an 11-point rating scale (1 =
It should be noted that measuring physical attractiveness through photographs may be influenced by the quality of the picture (Meland 2002). For instance, some individuals may look better in a photo than in reality. Also, given that the photos were in black and white, the effect of complexion may be obscured.
At the end of the first and second waves of the ACL, interviewers rated respondents’ appearance and attractiveness using a 5-point scale (1 =
The Big Five Personality Traits
The WLS administered the BFI-54, a relatively short instrument that assesses the Five-FactorModel of Personality dimensions (Hauser
The ACL measured only neuroticism and extraversion, and items for each trait were recoded, if necessary, so that higher scores on the index reflect a higher level of the trait. Note that the ACL measured these personality traits only on the baseline survey in 1987. The reliabilities were 0.71 and 0.70 for neuroticism and extraversion, respectively.
Intelligence
In the WLS data, the Henmon-Nelson (H-N) mental ability test measured cognitive ability (IQ) during the respondents’ junior year of high school (1956). The H-N test, consisting of 90 verbal and quantitative items, was administered in all Wisconsin high schools from the 1930s through the 1960s. Evidence suggests that the test is highly reliable (Hauser
The ACL administered Lorge-Thorndike (L-T) sentence completion items that asked respondents to fill in an appropriate word to complete a sentence (House 2010); the total number of right answers was conceived as an indicator of verbal intelligence, which is used as a proxy for IQ.3
Although the H-N and L-T tests can reliably measure general mental ability (Strenze 2007; Almlund
Behavioral Risk Factors
Smoking status was grouped into three categories: never smoked (reference category), former smoker, and current smoker. BMI was calculated by dividing weight in pounds by height in inches squared, then multiplying by a conversion factor of 703. BMI was categorized into four groups: underweight (below 18.5), normal weight (18.5-24.9), overweight (25.0-29.9), and obese (30.0 and above). However, because there were few underweight cases in the sample, the underweight category was combined with the normal weight category. Physical activity was assessed by the number of times respondents reported participating in light physical activity,such as walking, dancing, gardening, golfing, or bowling. Physical activity was grouped into four categories – less than once a month, 1-3 times a month, 1-2 times per week, and more than 3 times per week.
Control Variables
As a proxy for parents’ socioeconomic status, father’s education was measured by the years of schooling that a respondent’s father completed. Farm background was coded as “1” if the respondent’s father was a farmer and “0” otherwise. Fathers’ occupation information was drawn from tax return reports in 1957. For total household income in 1957, I used imputed values of family income. Religiosity was measured by frequency of attendance at religious services, which was grouped into 11 categories from 1-2 times a year to once a day or more.
The effect of personality on mortality was assessed with a series of parametric proportional hazard regressions. Cleves

where
1Although the ACL re-interviewed 1,427 original participants (81% of survivors, including 108 proxy interviews) in 2011-12, public data were not available at the time of writing this paper. 2Alwin (1997) suggested that 11-point scales are more reliable and no more vulnerable to shared method variance than 7-point scales. 3One example of questions is “Not every cloud gives [blank]” and respondents were given “weather,” “shade,” “sky,” “climate,” and “rain” as appropriate words to complete the sentence.
>
The Wisconsin Longitudinal Study
Summary statistics for the variables used in the event history analysis for the WLS are presented by survival status in Table 1. Neuroticism was significantly higher for deceased men (
[Table 1.] Sample Characteristics by Sex and Survival Status: Wisconsin Longitudinal Study (WLS)
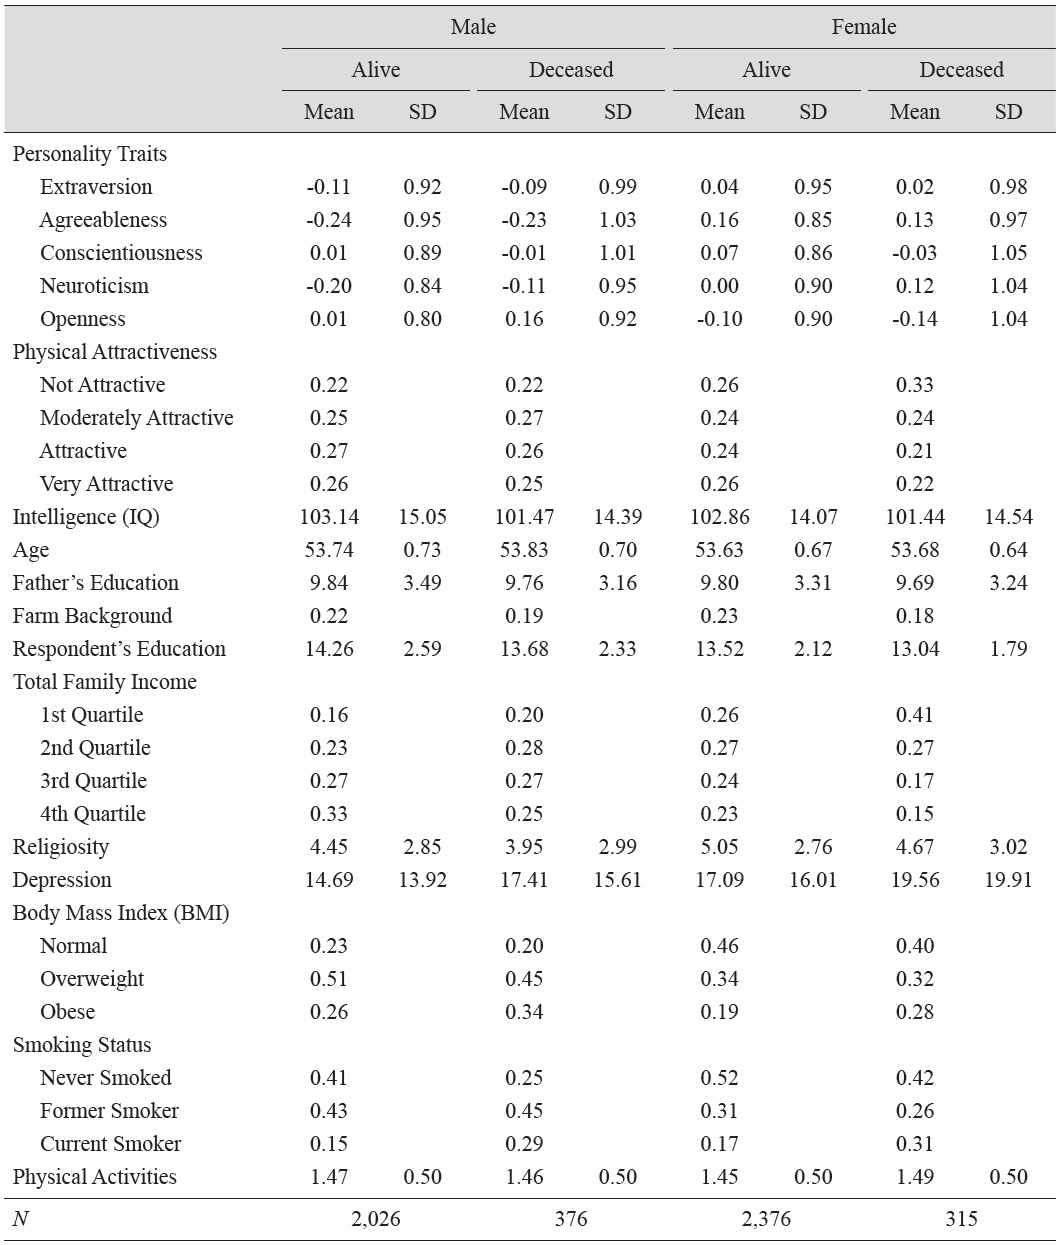
Sample Characteristics by Sex and Survival Status: Wisconsin Longitudinal Study (WLS)
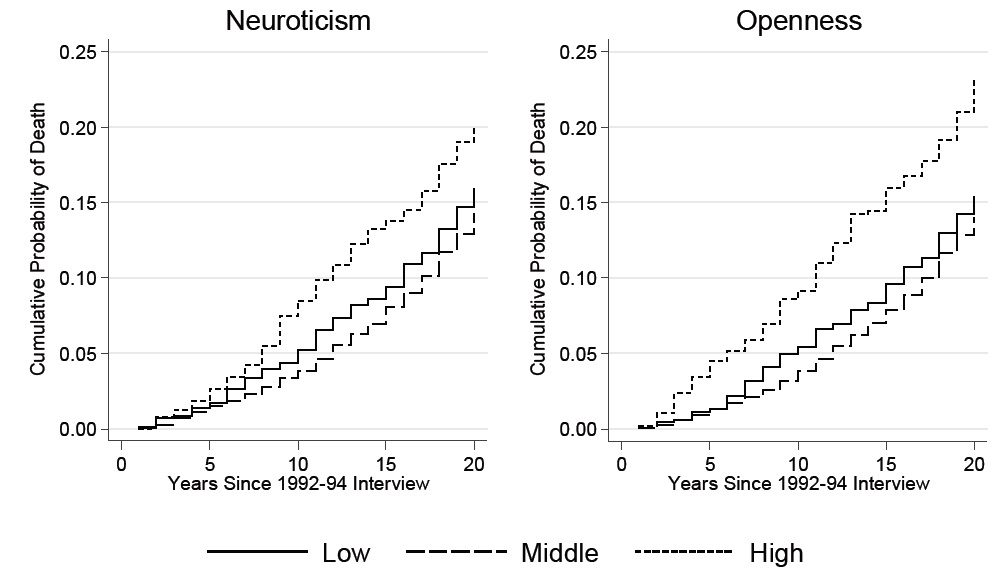
Figure 1 shows the Nelson-Aalen cumulative hazard estimates of mortality among WLS graduates with low (more than 1 SD below the mean), high (greater than 1 SD above the mean), and medium (1 SD ± mean) levels of neuroticism and openness. For these two personality traits, the high group had a significantly higher cumulative mortality, but there was no significant difference between the low and medium groups. Disparities between the high group and the other two groups arose ten years after the baseline interview date for neuroticism, while the gap was observed throughout the life course for openness.
The estimated parameters of the Weibull models of survival are presented in Table 2. Model 1 included measures of personality traits, physical attractiveness, and IQ. For men, only two personality traits – neuroticism and openness – were significantly associated with the hazard of mortality: a 1 SD increase in neuroticism was associated with a 17.3 percent increase in the hazard ratio of mortality, while a 1 SD increase in openness was associated with a 38.3 percent increase in the hazard ratio of mortality. For women, however, none of the personality traits was statistically associated with the hazard of mortality.
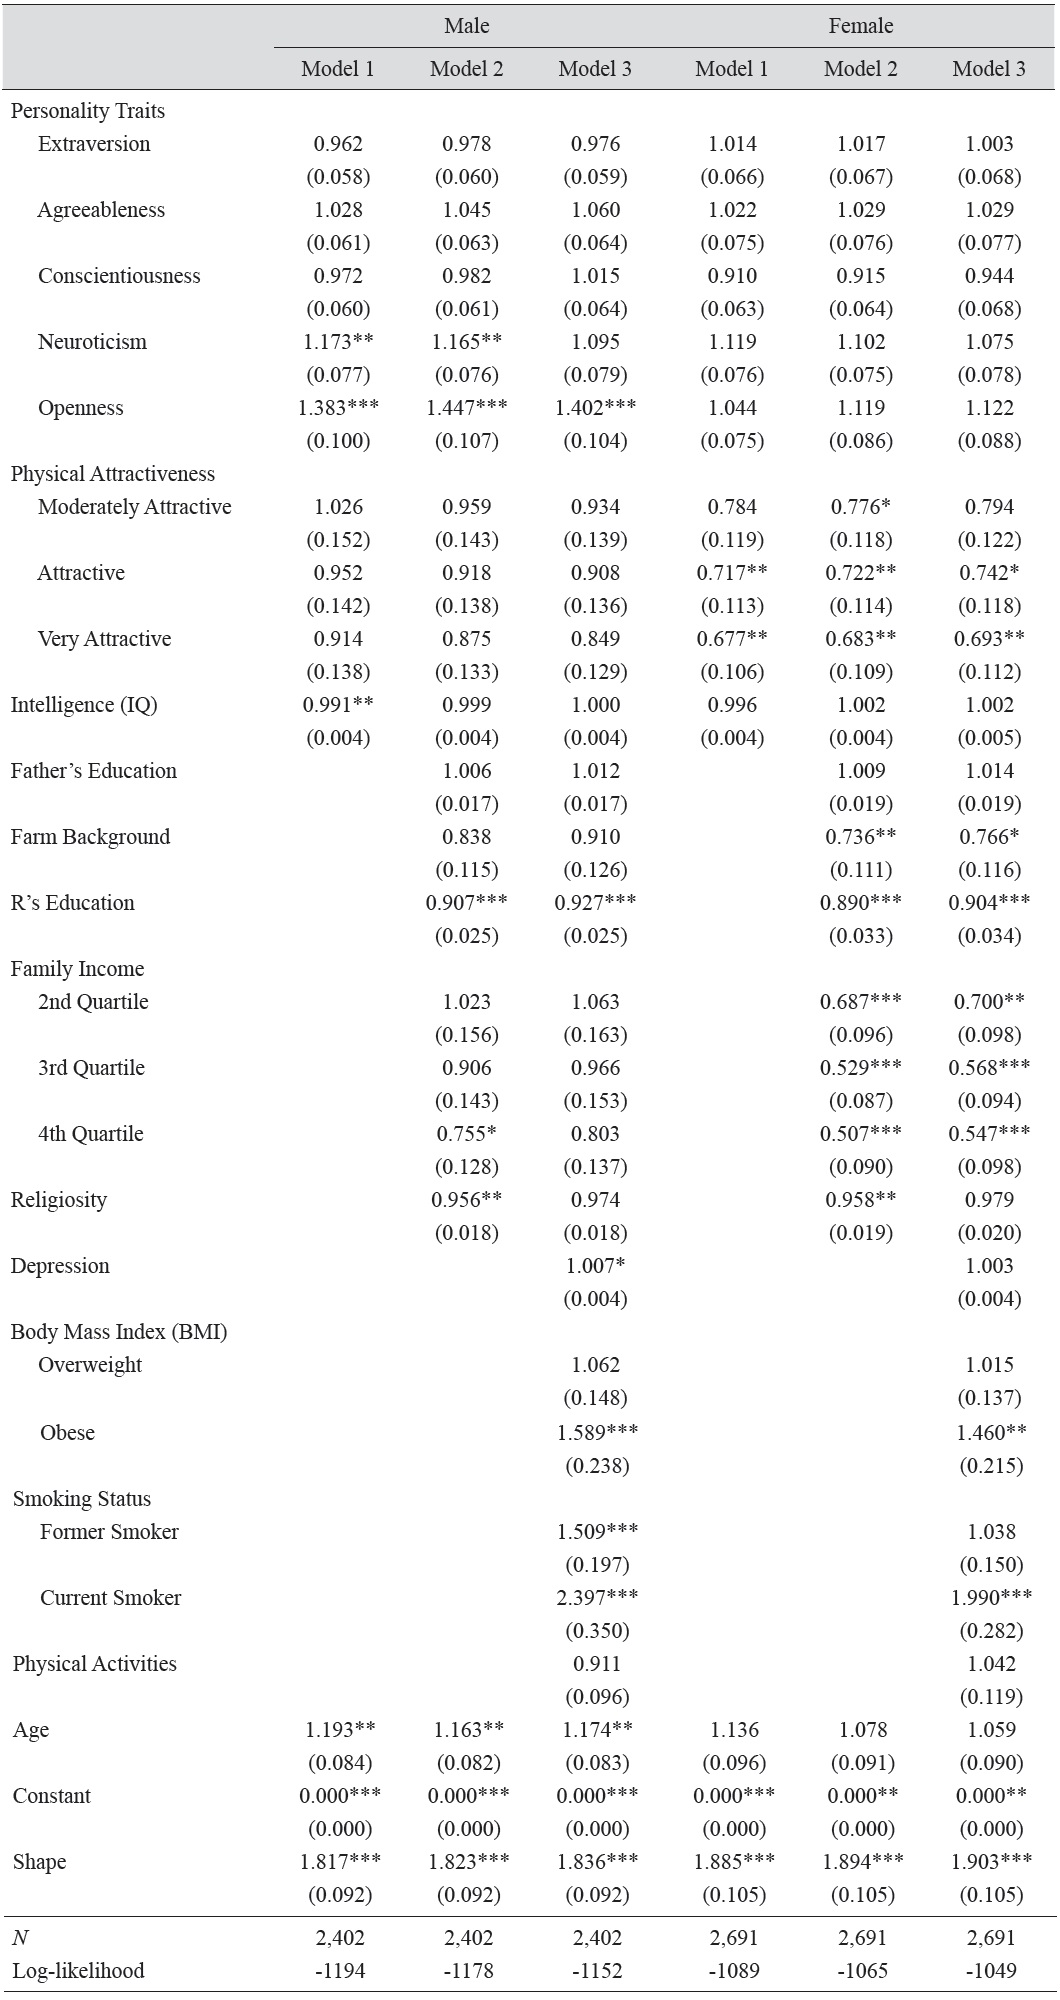
Estimated Parameters of Weibull Models: Survival of Males and Females in the Wisconsin Longitudinal Study (WLS)
On the other hand, as physical attractiveness increased, mortality decreased only among women. Very attractive women had 32.3 percent lower hazard ratio relative to unattractive women. For men, there were no differences in the risk of mortality based on ratings of physical attractiveness. However, the protective effect of IQ was observed only among men: a 1 unit increase in IQ was associated with a 0.9 percent decrease in the hazard of mortality. For women, although IQ was negatively associated with mortality, the coefficient failed to reach statistical significance.
Model 2 added family background and achieved socioeconomic status. As expected, education significantly reduced the risk of mortality for both men and women: a one-year increase in education was associated with a 9.3 and 11.0 percent decrease in the hazard of mortality among men and women, respectively. While men in the highest quartile of total household income showed a significantly reduced mortality risk, the results for women indicated a gradient with respect to income levels. That is, women in the second through fourth quartiles showed a mortality advantage over women in the first quartile. Furthermore, consistent with Hauser and Palloni (2011), a farm background appeared to reduce the hazard of mortality, although the effect was observed only among females. Finally, frequency of attending religious services significantly reduced the hazard of mortality (by about 4 percent) for men and women.
In model 2, the coefficients for personality traits and physical attractiveness changed little compared with the results from model 1. One exception was the coefficient for men’s IQ, which became insignificant in model 2. This suggests that the effect of IQ on mortality for men is mediated by socioeconomic achievement.
Model 3 added health behaviors. As expected, being obese was associated with a 59 and 46 percent increase in the hazard ratio of mortality for men and women, respectively, compared to those of normal weight. However, being overweight did not appear to increase the hazard of mortality relative to those of normal weight. Past studies have reported that, partly due to decreases in stature and changes in body composition associated with aging, being overweight may not be a significant predictor for all-cause mortality among the elderly, unlike in younger populations (e.g., Visscher
Again, the coefficients for personality traits, physical attractiveness, and IQ changed little compared with model 2. One exception was that the coefficient for neuroticism became insignificant for men, suggesting that the effect of neuroticism on all-cause mortality for men is mediated by health behaviors.
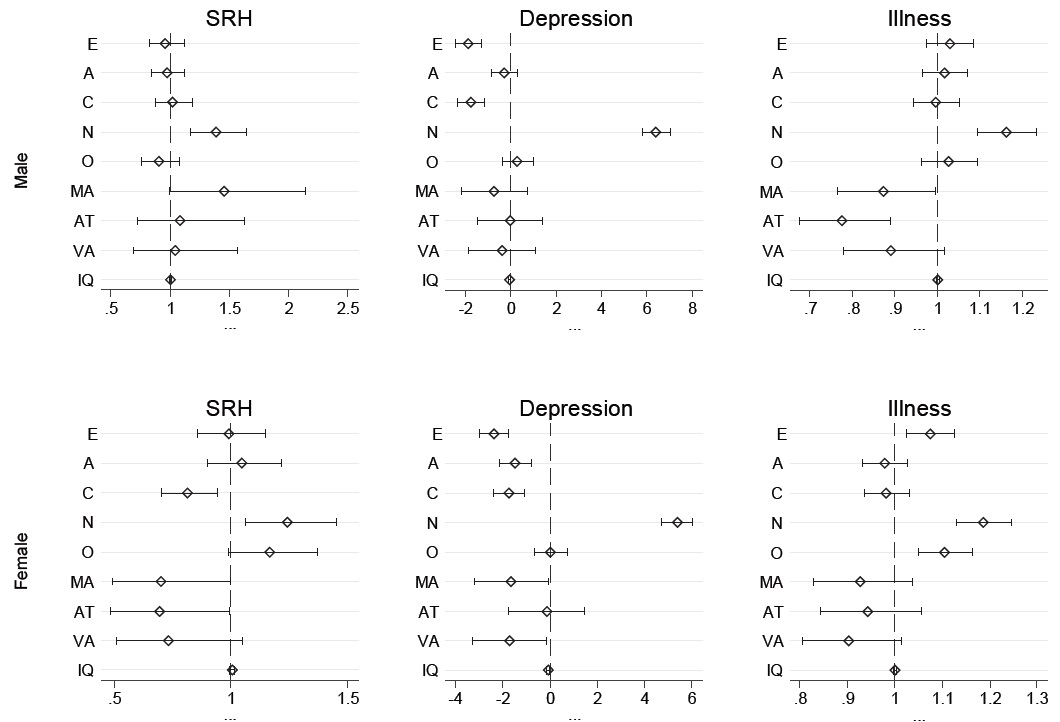
Results of regression analyses predicting self-rated health, depression, and number ofdoctor-diagnosed illnesses are presented by sex in Figure 2. All of the regressions controlled for SES, social background, and health behaviors. For men, among the variables of interest, only neuroticism (OR = 1.38) was significantly and positively associated with the odds of reporting poor or fair health. For women, in contrast, conscientiousness (OR = 0.81) was negatively associated with the odds of reporting poor or fair health, while neuroticism (OR = 1.24) had a positive association. Furthermore, physical attractiveness reduced the odds of reporting poor or fair health for women.
With respect to depression among men, extraversion and conscientiousness significantly reduced the CES-D score while neuroticism increased it. For women, in addition to extraversion, conscientiousness, and neuroticism, agreeableness was also negatively associated with depression. Furthermore, very attractive women experienced less depression than unattractive women. In terms of number of doctor-diagnosed illnesses, only neuroticism was significantly and positively associated for men, whereas neuroticism, openness, and extraversion were significantly and positively associated for women.
Results from logistic regressions predicting selected physical diseases (i.e., cancer, diabetes, and hypertension) indicated that, consistent with past studies (e.g., Stürmer
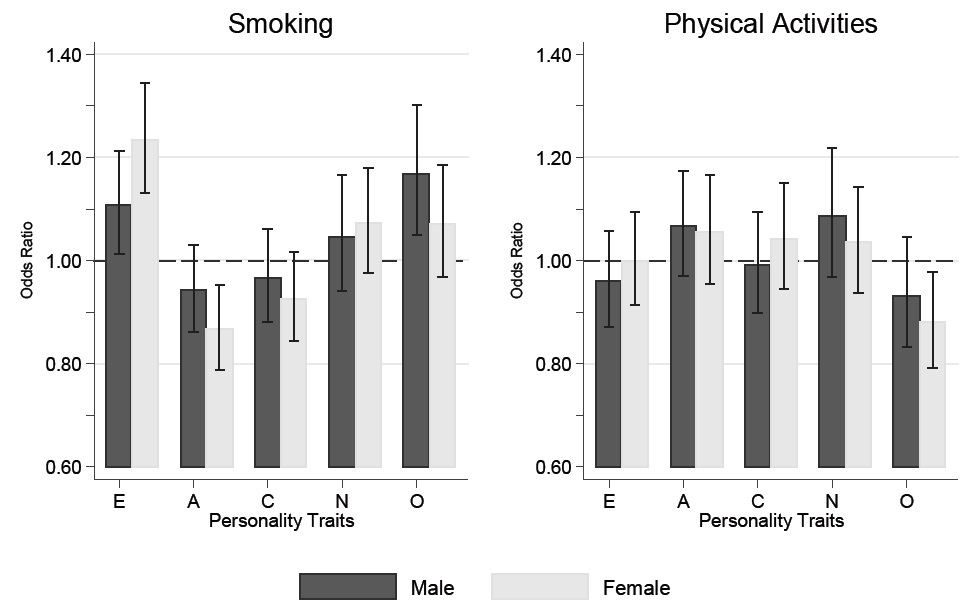
Taken as a whole, the results for men indicate that neuroticism is a risk factor for mortality, and that this relationship is mediated by behavioral risk factors such as smoking, depression,and being obese. Somewhat unexpectedly, openness also appears to significantly elevate the odds of mortality for males, a result which also appears to be related to health behaviors. Figure 3, which shows regression results for selected health behaviors, indicates that, for a 1 SD increase in men’s openness, the odds of having smoked cigarettes increase by a factor of .17. Also, the odds of participating in physical activities were 12 percent smaller if women’s openness increased by 1 SD. Openness to experience may encompass cognitive and behavioral flexibility, which may enhance the capacity to avoid and manage health problems (Chapman
>
The Americans’ Changing Lives Study
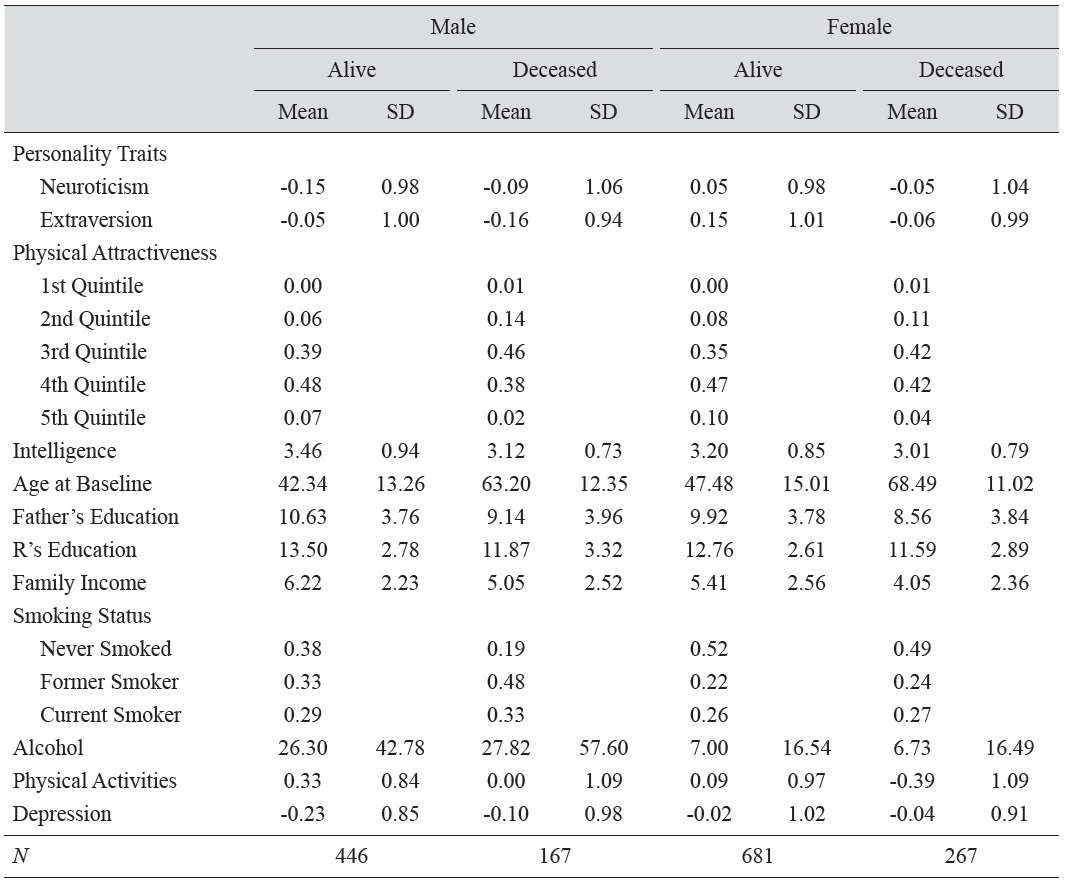
Descriptive statistics by survival status and gender for the ACL sample are presented in Table 3. In order to increase comparability across the ACL and WLS datasets, the ACL sample was restricted to whites, and independent variables were selected or constructed to be as similar aspossible to those in the WLS. No significant differences in neuroticism by mortality status existed for men (
[Table 3.] Sample Characteristics by Sex and Survival Status: Americans’ Changing Lives (ACL) Study

Sample Characteristics by Sex and Survival Status: Americans’ Changing Lives (ACL) Study
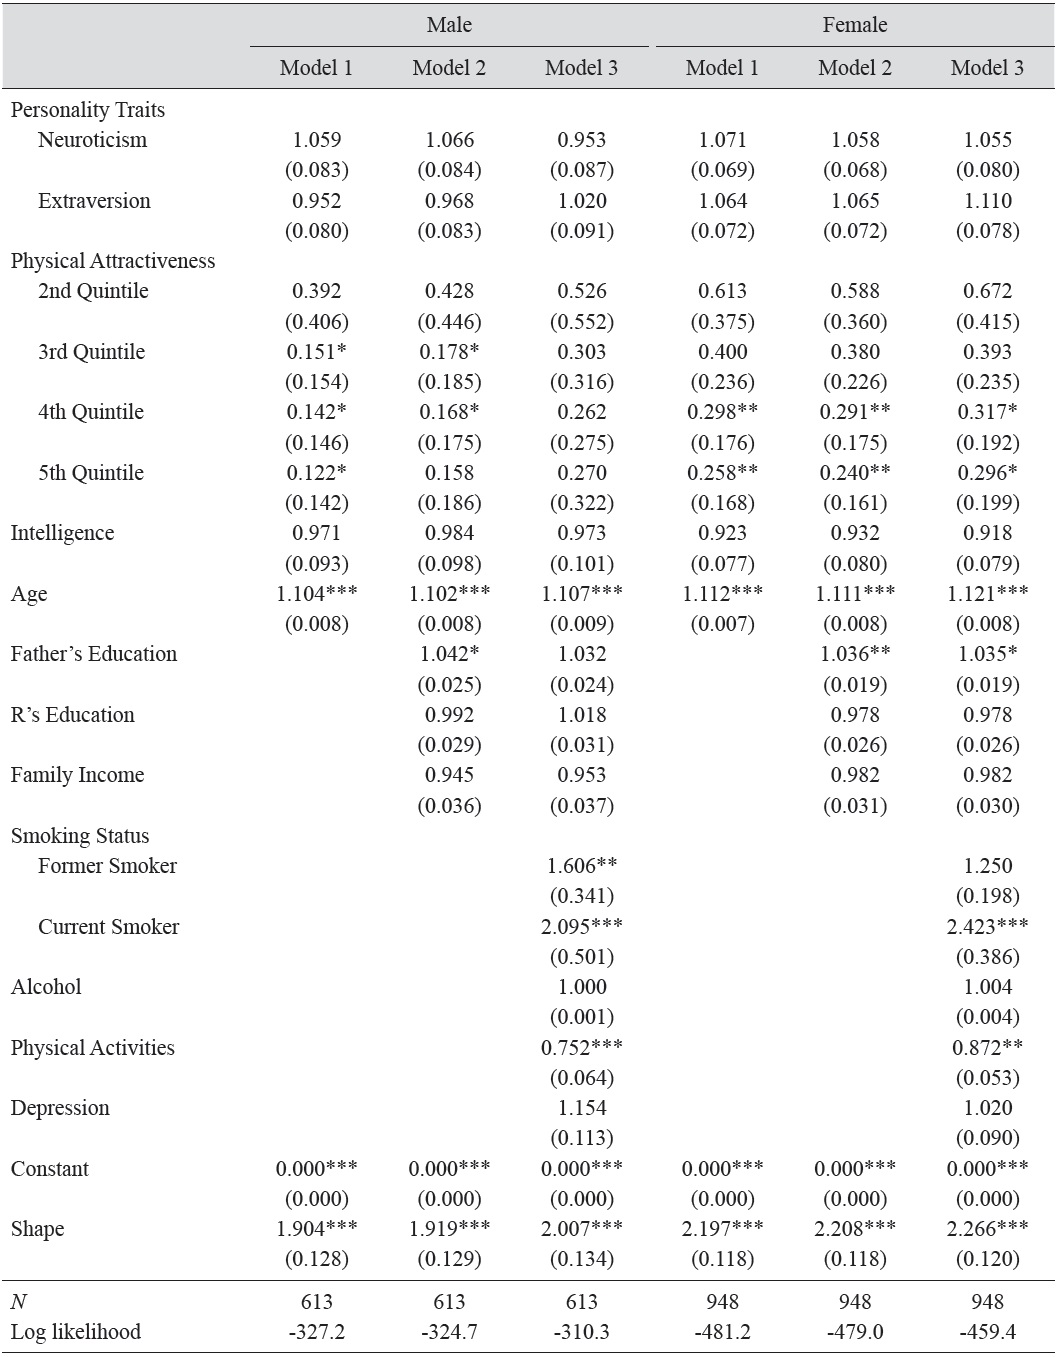
Table 4 presents the estimated parameters of the Weibull models of survival in the ACL cohort. As in the WLS cohort, models were estimated hierarchically; that is, the first model included only personality traits, physical attractiveness, and intelligence, along with age and race; the second model added socioeconomic factors; and the last model added health behaviors. Results from model 1 indicate that neuroticism and extraversion are not associated with the hazard of mortality among men or women in the ACL cohort. However, higher physical attractiveness ratings appear to decrease the hazard of mortality for both men and women. For instance, men in the highest quintile of physical attractiveness were 87.8 percent less likely to die than their counterparts in the lowest quintile. Similarly, the most attractive women were 74.2 percent less likely to die compared with their least attractive counterparts, holding other characteristics constant. On the other hand, although intelligence was negatively associated with the hazard of death, the coefficient for intelligence failed to reach statistical significance.

Estimated Parameters of Weibull Models: Survival of Males and Females in the Americans’ Changing Lives(ACL) Study
Model 2 added measures of social background and socioeconomic status, but the coefficients for physical attractiveness changed little, implying that physical attractiveness affects the hazard of mortality independent of SES. In model 3, health behaviors (i.e., smoking status, alcohol consumption, and physical activity) were added. Among women, physical attractiveness remained a significant predictor of mortality; for example, the hazard of mortality for women in the highest quintile of physical attractiveness was 70.4 percent smaller than for those in the lowest quintile. However, the effect of physical attractiveness on men’s mortality lost statistical significance in model 3.
As expected, results for men’s health behaviors indicate that, compared to individuals who never smoked, being a former smoker elevated the hazard of mortality roughly 61 percent, while current smoking increased the hazard almost 2.1 times. Although being a former smoker did not have a significant effect on women’s mortality, currently smoking women had a 2.4 times higher risk of mortality compared with those who never smoked. For both men and women, alcohol consumption and depression were not associated with the hazard of mortality. However, participation in physical activities significantly reduced the hazard of mortality among both men and women. Specifically, a one unit increase in the frequency of engaging in physical activities was associated with 25 and 13 percent reductions in the hazard of mortality among men and women, respectively.
4Results are not presented here due to space constraint, but available upon request.
The current study explored the effect of personality traits, physical attractiveness, and intelligence on longevity and health among the WLS and ACL samples. The central proposition of this study is that an individual’s life course outcomes are determined by the psychological, biological, and socioeconomic influences accumulated over one’s life. The contribution of this research is that it goes beyond the prevailing paradigm of proximate determinants for social behaviors by examining more fundamental causes and their functional relationships with other features of the whole individual.
This study found that, even after accounting for SES and health risk factors, two personality traits – neuroticism and openness – mattered for men’s mortality in the WLS. The effect of neuroticism on all-cause mortality for men seemed to be mediated by health behaviors like smoking and frequency of physical activity. In contrast, openness remained significant after controlling for health behaviors. Even so, the causal link between openness and mortality is not entirely clear; it appears to be related to smoking behavior in those high in openness.
While no personality traits significantly affected all-cause mortality among WLS females, higher ratings of women’s physical attractiveness were associated with significantly diminished hazard of mortality. Conscientiousness, which has been linked to lower risk of all-cause mortality in a number of past studies (Chapman
However, among both men and women in the WLS, personality traits were more strongly associated with self-rated health and depression than with mortality. It makes sense that personality traits, especially neuroticism, exert stronger influence on psychological well-being than on somatic health outcomes, which are engendered by a complex web of causes, including genetic predispositions, environmental hazards, and diet, among other factors.
In contrast to results from several studies from cognitive psychology (e.g., Gottfredson 2004; Batty
In general, the patterns observed in the WLS were replicated in the ACL. Two personality traits – extraversion and neuroticism – were not associated with all-cause mortality among males or females in the ACL. However, higher physical attractiveness ratings, which were measured by interviewers at the end of each interview, significantly reduced the hazard of mortality for both sexes. As in the WLS, intelligence was not associated with mortality risk.
The present study is not without limitations. First, the WLS measured intelligence using the Henmon-Nelson test of mental ability when respondents were in their junior year of high school. In contrast, the ACL measured intelligence using verbal intelligence tests when most of the respondents were in their mid-40s or 50s. Thus, not only did respondents’ ages when the intelligence tests were administered differ, but also the WLS measured more fluid aspects of intelligence while the ACL measured more crystalized intelligence (Almlund
To conclude, the effects of personality traits, physical attractiveness, and intelligence on health outcomes differ by sex. Analyses of the WLS suggest that personality traits, especially neuroticism and openness, have a significant impact on men’s survival, while physical attractiveness matters for women’s longevity. Results from the ACL revealed that physical attractiveness is strongly and inversely associated with mortality risk for men and women. In addition, the results indicated that personality traits, especially neuroticism, extraversion, and conscientiousness, substantially affect psychological well-being, including self-rated health and depression.