

The stringent family system of patrilineality, patriarchy, and patrilocality throughout Chinese history has resulted in a strong preference for sons and discrimination against girls in childbearing and child rearing behavior (Jiang, Li, & Feldman, 2011). These attitudes are manifested in many ways, such as food allocation, health care, and education. Currently discrimination against girls is seen demographically as a higher than normal sex ratio at birth (SRB) and excess female child mortality that lead to a distorted sex structure of the Chinese population (Jiang, Li, & Feldman, 2011). Sen (1989, 1990) coined the term "missing women" to describe the large number of women in the world who are literally not alive due to neglect and active discrimination. More recent literature prefers the term “missing girls” to “missing women” (Cai & Lavely, 2003; Ebenstein & Sharygin, 2009; Ebenstein, 2010), and we use “missing girls” in this paper, because in our calculation, we include those age groups before maturity. In order to estimate the fraction or number of missing girls, we can compare the actual sex ratios by age in a population with those in a model population with a normal sex ratio at birth and non-gender-biased mortality rates. If the actual sex ratio exceeds that in the model population, the missing fraction of females who would have to be alive to equate the actual with the model sex ratio can be used to estimate the missing girls (Klasen & Wink, 2002; Cai & Lavely, 2003).
Excess female mortality in infancy and childhood has existed throughout Chinese history. Mortality level and patterns are normally determined by biological factors, and mortality rates for male infants and children are higher than those for females. However, the female mortality rate for the age group one to four years has been 10 percent higher in China than that for males of corresponding ages, and 15 percent higher for second and higher order children of these ages (Choe, Hao, & Wang, 1995). Historically, infanticide was prevalent and a major contributor to the phenomenon of missing girls, but is now widely acknowledged to be very rare (Zhu, Li, & Hesketh, 2009). Nevertheless, neglect of girls and discrimination against girls in health care and schooling still produces excess female child mortality. Excess female mortality in infancy and childhood, and infanticide in extreme situations, is rooted in traditional son preference, but the strict birth control policy is also an important factor (Hesketh & Zhu, 1997).
Since 1980, the SRB has risen continuously (Jiang, Li, & Feldman, 2011). China’s strict family planning policy, namely one child per couple in urban areas, “one and a half” children in most rural areas (that is, a second child is permitted for a couple if the first is a girl) has been implemented since 1980 (Gu, Wang, Guo, & Zhang, 2007). In the absence of a limit on the number of children, the deeply rooted traditional preference for sons can be realized by giving birth continuously until a son is born. Enforcement of the family planning policy, however, has caused a conflict between the limited number of children per couple and traditional reproductive ideation and behavior, and resulted in a large difference between the permitted number of children and the desired number of people. Even if two children were permitted for a couple, roughly 25 percent of families would have no son (roughly, if the probability of having a daughter is 0.5, then the probability of two consecutive daughters is 0.25). With the availability of prenatal sex diagnosis and induced abortion technologies, people have turned to sex-selective abortion to ensure at least one son when gender and number of children are in conflict. Abortion for non-medical reasons is strictly forbidden by law, but it has been widely practiced during the past two or three decades (Nie, 2011). Local data showed that over 25 percent of female fetuses were aborted, but only 1.6 percent of male fetuses (Chu, 2001). In stringently enforced birth control areas, there is a low fertility level, but a very high sex ratio at birth, which is caused by prenatal sex identification and sex-selective induced abortion among first and second parity children (Ebenstein, 2010). China is not the only country in the world with a distorted SRB, but its imbalance is “the longest in time, widest in scale and deepest in degree” (Nie, 2011).
Under the assumption of a normal sex ratio at birth and a normal mortality pattern, based on China’s 1990 census, Coale and Banister (1994) estimated that the sex ratio for China’s 1990 population should not have exceeded 1.02, but the actual figure was 1.07, indicating a significant fraction of missing girls. Usually males are determinant in reproductive decision-making, and women have to suffer psychological and physical trauma to go through sex-selective abortion to satisfy the demands of their husbands regarding the sex of their child. This is also detrimental to a woman’s subsequent reproductive health (Ma, 2004). The phenomenon of missing girls has deprived female infants and children of the basic rights to birth and life, and removed female children’s rights of survival (Jiang, Li, & Feldman, 2011). Moreover, the phenomenon of missing girls has produced an unbalanced sex structure in the Chinese population and led to a male marriage squeeze with excess males in the marriage market, the effects of which on social and economic development have been the subject of much research (Hudson & den Boer, 2004; Edlund, Li, Yi, & Zhang, 2007; Ebenstein & Sharygin, 2009; Das Gupta, Ebenstein, & Sharygin, in press). Several studies have addressed the temporal change in missing girls. For example, Coale and Banister (1994) studied the proportion of missing girls during the five decades before 1990. Klasen and Wink (2002) used census data to explore the number of missing girls. Jiang, Li, Feldman, & Sanchez Barricarte (in press) sketched the trend of missing girls during the 20th century. Using data from 2005 national intercensus survey, Zhu, Li, & Hesketh (2009) estimated that there were 32 million more males than females in the population under 20, and roughly 16 million missing girls. However, the literature on missing girls after the implementation of the strict birth control policy in 1980 is comparatively lacking. Many studies have attributed the higher than normal sex ratio at birth in China at least partially to China’s birth control policy (Yang, 2012), but few studies have focused on the missing girls during the strict birth control period. China’s excess of males and the potential threat they many pose for social stability, which has been a focus of study in China and internationally, depends largely on the number of missing girls since 1980. China’s 2010 census provides a new data source for such an analysis.
Here we analyze the number of missing girls from 1980 to 2010, the three decades labeled as China’s stringent one-child policy period. We hope that through our analysis, we will go beyond estimating the numbers toward providing some clues for the future adjustment of the birth control policy. In the remainder of this paper, we use data from China’s four most recent censuses to estimate the number of missing girls. We first introduce our method of calculating the number of missing girls, followed by a section on the data, the trend in SRBs at the national and provincial levels. We then present our results and end with a brief discussion.
There are two methods for calculating the number and percent of missing girls. One employs the sex ratio of the total population as a benchmark (Sen, 1990; Klasen & Wink, 2002). Dividing the total number of males in the population in question by the sex ratio of the chosen benchmark population, we can obtain the expected number of females. The difference between the number expected and that in the observed population is regarded as the number of missing girls. Obviously, this number will be markedly affected by the choice of the benchmark population. It should be noted that the estimated number of missing girls corresponds to the existing observed surviving population in the given year.
The other method calculates the missing girls by cohort using census data. Under the assumption of a normal sex ratio at birth and mortality patterns of male and females, we can work out the expected sex ratio in a given year for a certain cohort. Using the observed number of that cohort and the expected sex ratio, we can calculate the expected number of females in the give year, and then compute the number and percentage of missing girls (Coale & Banister, 1994; Das Gupta & Li, 1999).
Let
where
Usually the Coale-Demeny Model West model life tables are used for
Let
We use the age-sex-specific population numbers and corresponding life tables from the four censuses of 1982, 1990, 2000, and 2010. The census conducted in 1982 was the third after the founding of People’s Republic of China, and Coale (1984) reported high accuracy in age-sex specific data from this census. With the release of the 1990 census data, however, underreporting of children in order to avoid the fines for out-of-quota births was detected in the 1982 census data (Johannson & Arvidsson, 1994).
In 1990, the fourth census was implemented. It was asserted the census had high accuracy and a very low under reporting rate of 0.06 percent. However, Zhou (2003) evaluated its data quality with the 2000 census data and found that there was a higher undercounting rate than had been officially claimed.
The 2000 census was the fifth in China, and the first implemented in the market economy context. The implementation of this census faced challenges due to factors such as social transition, ideological change, and great mobility. Its undercounting was estimated at 22.46 million, a rate of 1.81 percent, which was acceptable according to international standards, but was 30 times higher than the 0.06 percent for the 1990 census (Walfish, 2001).
The 2010 census provides new data for our study. The total population increased by 11.7 percent from 1990 to 2000, an annual rate of 1.07 percent, whereas the increase from 2000 to 2010 was only 5.8 percent or 0.57 percent annually during this period (Hvistendahl, 2011). In the past, when the results became public, scholars were quite critical due to the possibility of undercounting among the young age groups. However, when the 2010 preliminary results appeared, instead of questioning the reliability and underreporting of young age groups, scholars reached a consensus concerning overadjustment of the fertility level and birth numbers in the past decades (Cai, 2012).
Although census data are flawed due to problems such as undercounting, these data are still the most reliable available. Besides the census, the Chinese National Bureau of Statistics (NBS) carries out a sample survey of population annually and releases these annual data. For the 1990s and early 2000, the primary concern of researchers was possible underreporting of annual births during the 1990s (Attane, 2001). However, an increasing number of scholars are now concerned about a likely overcounting or overadjustment of annual births (Zeng, 2007; Morgan, Guo, & Hayford, 2009; Goodkind, 2011). After the 2000 census, the annual birth numbers reported by the National Bureau of Statistics dropped dramatically compared to those before the 2000 census. In 2001, total births numbered 17.02 million, and have fluctuated around 16 million in subsequent years, which approximates the numbers in the low age groups enumerated in the 2000 census. China’s total population in 2010 was estimated in
Besides the above mentioned age-sex structure data, we still need life tables generated from census data. Deaths have been undercounted in much of the census data (Jiang, Li, Li, Sun, Liu, & Du, 1995; Li & Sun, 2003). Here we adopt the life tables of Jiang et al. (1995) from the 1990 census data, and Li, Sun, Jiang, Guan, & Hu (2005)’s life tables from the 2000 census data. These life tables were adjusted taking into account underreporting of deaths. As for the 2010 census data, there must be underreporting of deaths, but due to lack of information necessary to adjust the data, we calculated life tables directly from the preliminary tabulation of results for the 2010 census.
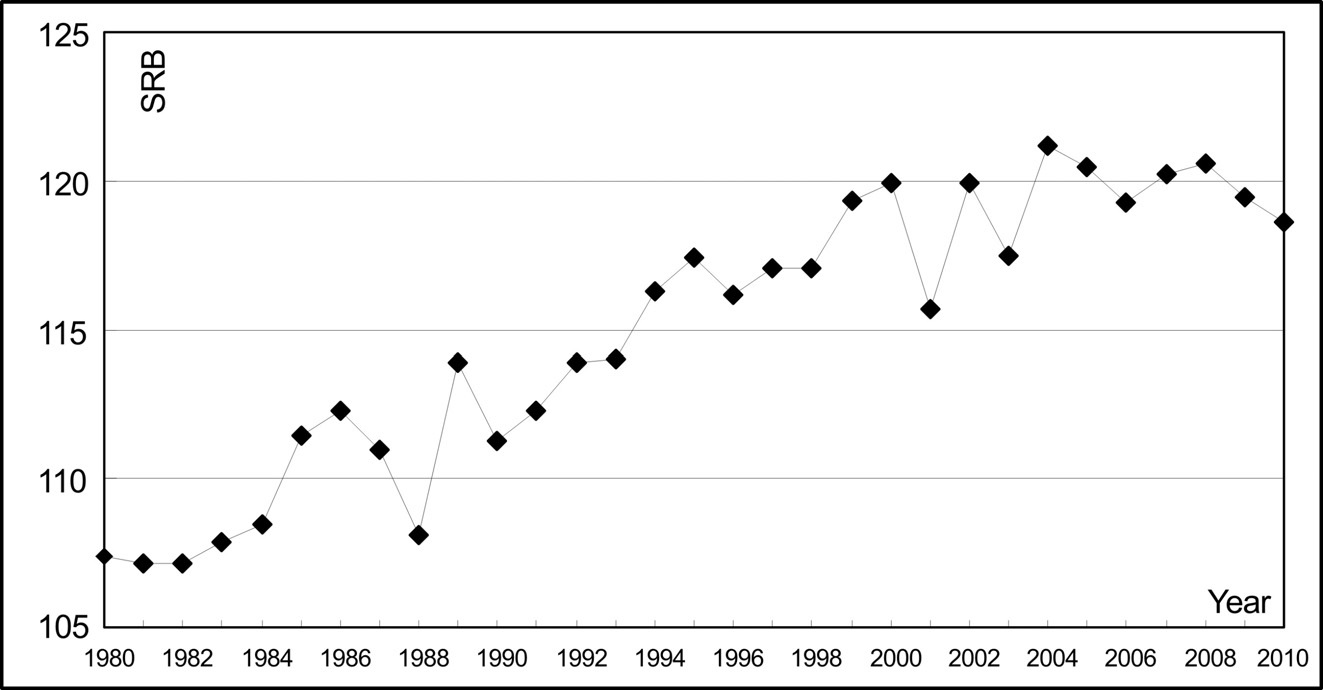
Under the strict birth control policy, the SRB rises with the decline in fertility. After 2000, the SRB fluctuates to around 120, as indicated in Figure 1.
Recently, based on the census and annual sample survey data before 2010, some optimists have discerned an incipient decline in China’s SRB (Das Gupta, Chung, & Li, 2009; Guilmoto, 2009). On March 28, 2012, the Chinese National Population and Family Planning Commission asserted that after 30 years of higher than normal SRB, it has declined for three consecutive years, from 119.45 in 2009 to 117.94 in 2010, and then to 117.78 in 2011 (Li, 2012). However, it is not certain whether the SRB has been declining, increasing, or just fluctuating around 120 in the past decade. The data from the short form of the 2000 census indicates a SRB of 116.9; lower than 119.9 from the long form. The latter is quite often cited, but is deemed not reliable (Goodkind, 2011). The preliminary results of the 2010 census indicate a SRB of 121.2 from the long form, which is higher than that from the 2000 census long form; and a SRB of 117.9 for all people, which is still higher than that from the short form of the 2000 census.
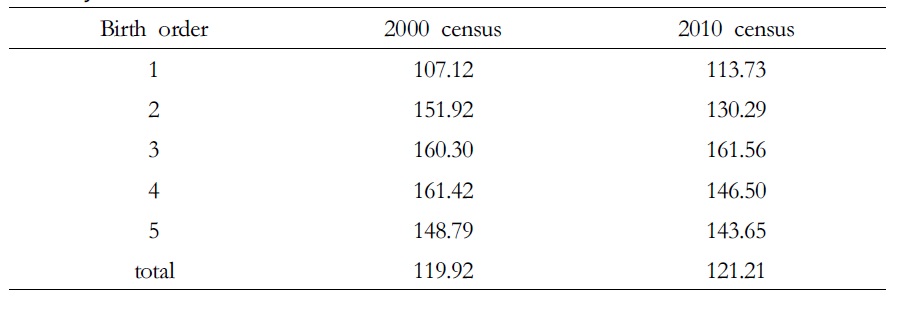
[Table 1] SRB by birth order for 2000 and 2010 censuses

SRB by birth order for 2000 and 2010 censuses
We can see from Table 1 that in the 2010 census, it is not only SRBs for high birth orders that deviate dramatically from the normal, but the SRB for the first parity has risen remarkably. This may suggest that with the continuing decline in total fertility rates, the application of sex-selective abortions may be extending to the first birth. Aborting female fetuses meets both the policy demand to have few children and individual demand to have a son (Yang, 2012). According to the 2000 census, China’s policy fertility (fertility level that would obtain if all married couples had births at the levels permitted) was 1.47 children per couple in 2000 (Gu et al., 2007). In recent decades, with rapid urbanization, it is assumed that the policy fertility would further decrease. China’s actual fertility level during the past two decades is subject to controversy, but scholarly estimates are from 1.4 to 1.6 (Gu et al., 2007; Morgan et al., 2009). With the release of the 2010 census, it is estimated to be under 1.5 (Hvistendahl, 2011). Yang (2012) pointed out that “policy restrictiveness generates fertility squeeze, and the 1.5-child policy2 exacerbates gender bias, both leaving people with son preference little choice but to abort female fetuses”.
With the accelerating process of mainstreaming of gender in China, people’s attitudes towards daughters may be changing. Zhang (2006) observed an increasing desire for daughters among rural families. For the ideal family composition (one son and one daughter), daughters are also wanted. With the peak of the SRB and possible subsequent decline, some analyses suggest that in fertility ideology there is not only a preference for sons, but also a quest for both a son and a daughter (Yang, Li, & Shang, 2011). However, preference for sons is much stronger than for daughters, so with the fertility squeeze, people tend to reproduce sons rather than daughters (Yang et al., 2011). This is why not only the SRBs for higher birth orders are well above normal, but the SRB for the first birth in 2010 deviates substantially from normal.
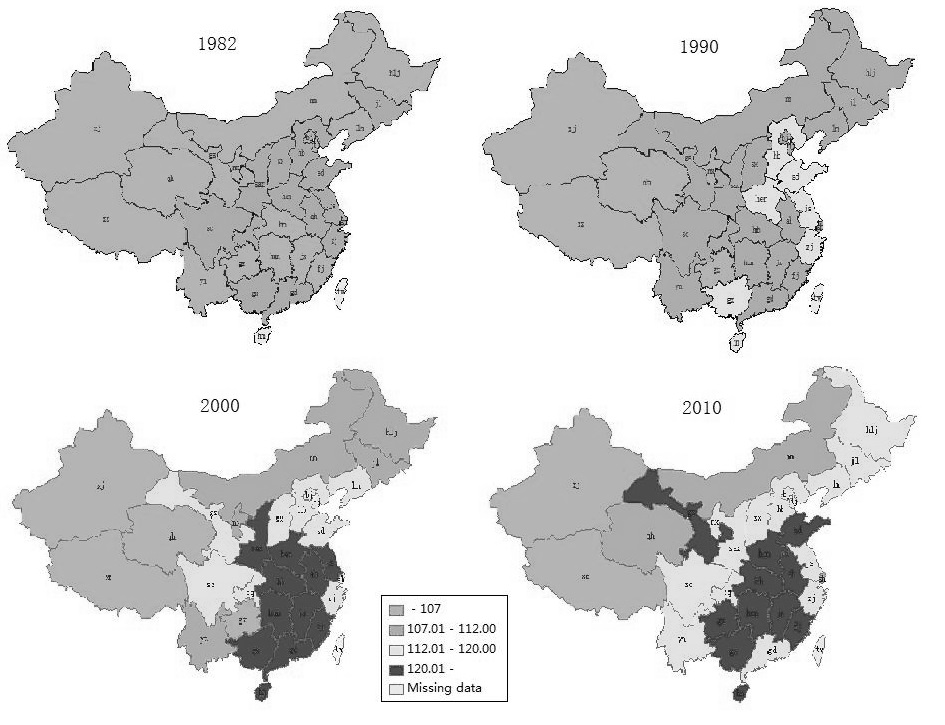
The SRBs in some provinces in 1982 already showed signs of deviation from normal, but the deviation was not serious and SRBs were below 112. In the 1990 census, normal SRBs only appeared in several sparsely populated provinces and most provinces exhibited higher than normal SRBs. In the 2000 census, many provinces exceeded 120 in SRB, and the situation did not improve, and may have deteriorated, in the 2010 census, as is shown in Figure 2. In the 2010 census, 13 provinces have SRB over 120, and their total births account for 60.4 percent of national births. Fourteen provinces have SRB between 112 and 120, and their total births make up 33.97 percent of national births.
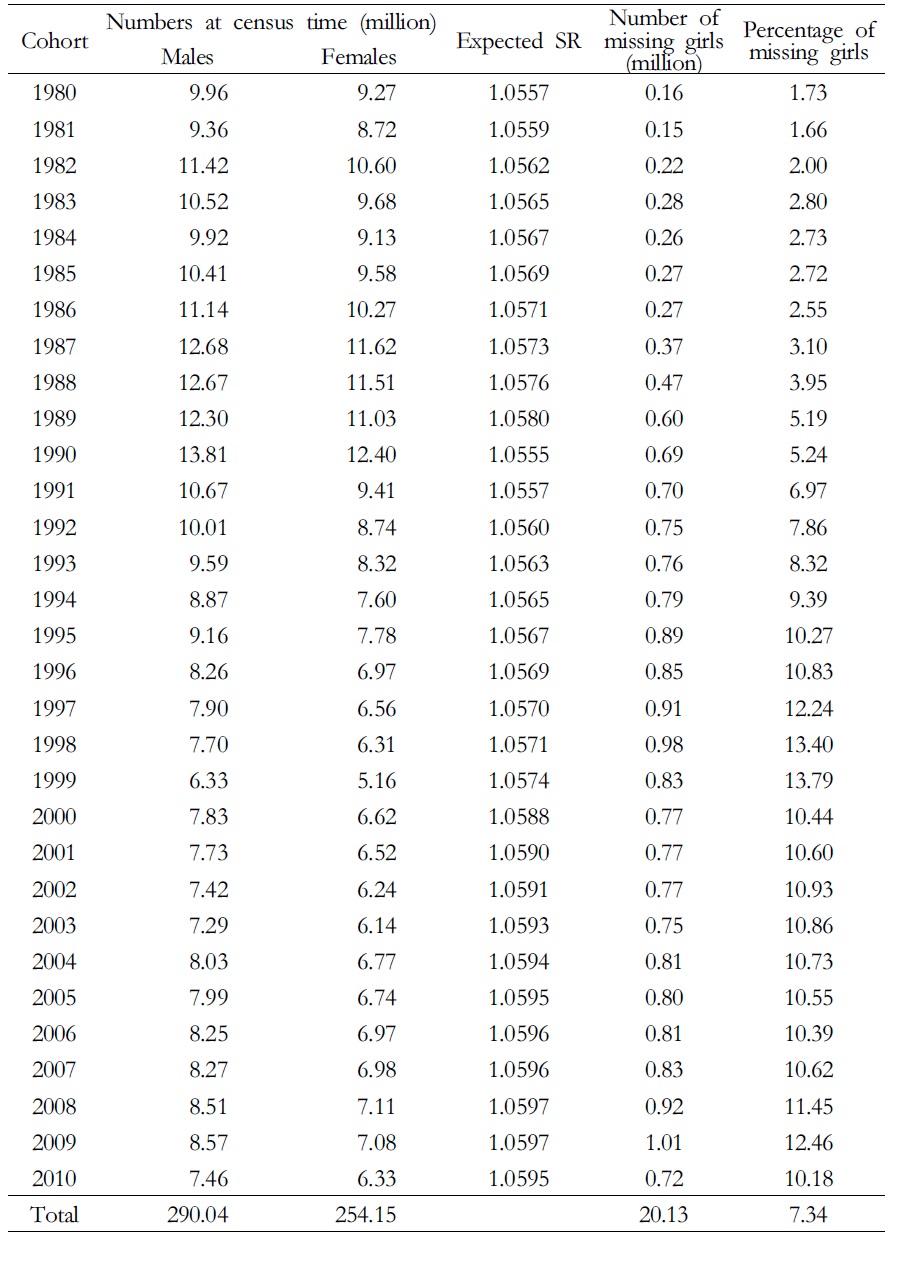
Based on the above method and data, the estimated annual number and percentage of missing girls from 1980 through 2010 is shown in Table 2.
From Table 2 we see that the percentage of missing girls from 1980 through 1989 increases annually, but generally remains at a low level. The total number of missing girls from 1980 through 1989 is estimated to be 3.05 million, or 2.93 percent. The percentage estimated for the 1990-1999 birth cohort increases rapidly to 9.31 percent, or 8.13 million. After 2000, the SRB fluctuates around 120, corresponding to 10.85 percent missing girls. During the period from 1980 to 2010, the total number of missing girls is 20.13 million or 7.34 percent.
For the cohorts born between 1980 and 2010, males number 290.04 million at corresponding census times, while females number 254.15 million, 36 million less than males. Of the 36 million, 20 million are missing girls, and the other 16 million is biologically produced; that is, even under the normal SRB of 106, there would be 16 million more males than females for these cohorts.
[Table 2] Missing girls from 1980 through 2010

Missing girls from 1980 through 2010
2Namely a second birth is permitted for a couple if the first is a girl
One controversial question is whether and to what degree China’s millions of missing girls can be traced to the ambitious and rigorous population control program, widely known as the “one child” policy (Nie, 2011). High SRBs are not exclusive to China with its strict birth control policy, but also occur in countries or regions with loose fertility control, or without a birth control policy, such as Taiwan, South Korea, and India. Thus some researchers assert that China’s high SRBs are not causally linked to the enforcement of the strict birth control policy. However, from China’s 1990 census data, Li, Yi, & Zhang (2011) found that enforcement of the strict birth control policy led to 4.4 extra boys per 100 girls in the 1980s, accounting for about 94% of the total increase in the sex ratio during this period. For the 1991-2005 birth cohorts, the birth control policy resulted in about 7.0 extra boys per 100 girls, accounting for about 57% and 54% of the total increases in sex ratios for the 1991-2000 and 2001-2005 birth cohorts, respectively. A strong case for causality has been made in the relation between the enforcement of strict fertility policy and increasing SRBs. In the 2000 census, the SRB in the two-child policy areas was 109.0, and 111.6 in one-child policy areas, but was as high as 124.7 in 1.5-child policy areas. Data from the 1.5-child policy areas implicitly suggests that people in these areas regard one boy as sufficient for family welfare but not one girl, and following the birth of a daughter they need to have another child. This may lead those who have a girl as a first child to seek recourse to prenatal sex determination and sex-selective abortion (Zeng, 2007). The use of sex-selective abortion has raised numerous challenging demographic, sociological, ethical, and public policy questions, and caused millions of missing girls as well (Nie, 2011).
At the onset of enforcement of the birth control policy, some far-sighted demographers predicted that there would be many side effects, or even disasters, should the one-child policy succeed (Bongaarts & Greenhalgh, 1985; Greenhalgh & Bongaarts, 1987). Currently, the large number of missing girls and excess males can be regarded as one of the most significant of these. From 2010 on, the sex ratio of marriageable partners for first marriages rises rapidly: in 2020, it will reach 1.5, namely, three never-married males will compete for two single females. It will continue to increase to 1.8 in 2030, will fluctuate from 2030 through 2050, remaining at a relatively high level, and from 2045 to 2050 it will approximate 2, that is, two single males for one single female (Jiang, Feldman, & Li, 2012).
When females are in short supply, it is males who will suffer for lack of a spouse. As females can marry up to males with higher social and economic status, the majority of males who are unable to marry will belong to the lowest social strata (Hesketh & Zhu, 2006). If these poverty-stricken single males were to congregate, they would cause concern about family and social stability. Recently “bare branch” villages3 have been reported in several provinces in China, where numbers of involuntarily unmarried men have increased in many locations, but mainly in poor areas. Their congregation in poverty-stricken areas may transform individual issues into collective and social issues, and thus exaggerate social conflicts.
As early as the 1980s, many demographers recognized potential side effects of the stringent birth control policy and proposed alternatives. One proposal was a two-child-plus spacing policy, aimed at achieving the population control target but with fewer side effects (Greenhalgh & Bongaarts, 1987; Vaupel & Zeng, 1991). Unfortunately those proposals were not adopted. Currently, besides efforts by the Chinese government to correct the unbalanced sex ratio by financial compensation for parents with only daughters, a relaxation of the strict birth control policy to allow more parents to have a son without turning to sex selective abortion has been advocated by many scholars (Ebenstein, 2011). With socioeconomic development, as well as thirty years’ enforcement of the strict policy, the Chinese people have undergone a radical change in reproductive ideation and behavior, with the desired fertility now approximating policy fertility. In this sense, the birth control policy is already obsolete (Hvistendahl, 2010). At present China is not ready to relax the current fertility policy, although when it was initiated, the government promised that such a policy should be implemented for just one generation. After 30 years, China is confronted with a series of demo-graphic challenges. Although relaxation of the current fertility policy is not a panacea for all these challenges, it can at least alleviate many social pressures, such as the future missing girls’ problem.
However, in order to bring the distorted sex ratio at birth back to normal, a less restrictive fertility policy is necessary, but it is far from sufficient (Yang, 2012). The distorted sex ratio at birth and the large number of missing girls and excess males has alerted the Chinese government to take countermeasures. In Chaohu prefecture, Anhui province, from 2000 to 2003, an experimental zone was established to use all kinds of intervention to combat gender discrimination against girls, the high SRB, and excess female child mortality (Zheng, 2007; Hvistendahl, 2009). This experimental zone was successful and was extended nationwide as
3“Bare branches” is a Chinese term that refers to those men who are over a certain age but have been unable to find a spouse to marry, and thus have no wife and children, like a branch without leaves.


