There is a growing recognition that GDP might not properly measure the real progress of a society. Although it is still a very useful measure, it was not designed to capture the social aspect of development. Accordingly, multiple attempts are being made to come up with a supplementary, or alternative, measure of social progress. As one such attempt, we focus on the concept and accompanying indicators of social quality originally devised by European scholars. Although social quality is a solid theoretical construct, we find that there are ambiguities when it comes to empirical application to the real world data. Analyses of data across 34 mostly OECD countries reveal that a modified concept and accompanying indicators better survive the reality check, but still consistent with the original concept of social quality. Using this modified set of indicators, we show the relative performance of these countries and suggest that there are three different types of social quality regime.
Need for New Concept of Social Progress
How to define and measure a “good society” has attracted attention from many countries regardless of the level of development and type of politicoeconomic system. As a concept such as “good” society is heavily value-laden, it is inevitable to invite heated debates on what we mean by good society. Once we define what “good society” is, we can figure out whether a country has achieved progress over time or performing better than other countries.
There has been a long history of debate on societal progress by two different camps, i.e., modernization theory and dependency theory (Kim 2008). Modernization theory has emphasized that the attitude of people, especially that of local elites, has played pivotal role for the progress of backward societies. The hidden assumption was that modernity, represented by the structural characteristics of Western European countries and the United States, is the model for backward countries. This idea of linear evolution toward an ideal stage, however, was seriously challenged by critical researchers who have reversed the logic by introducing the idea of the “development of underdevelopment.” Dependency theorists argued that the underdevelopment of the third world countries is attributed to the exploitative link between the center and periphery, such as unequal exchange between high value-added products of the center and raw materials of the periphery.
However recent development in East Asia shows that neither modernization theory nor dependency theory alone can properly explain the historical trajectory of this region. East Asian countries including South Korea, China, Singapore, Thailand, and Japan have accomplished very rapid economic development in recent decades with wide variety in spurt time, and revealed seemingly different stages of transition. For example, the keyword for the two decades since 1960 was “economic growth,” quickly followed by two decades of “democratization” in Korea. China has experienced rapid growth since 1980s with average annual growth rate over 9 percent, which was essential impetus upgrading the living standard of their people, and gradually replacing the state-governed socialist economy by autonomous and competitive markets.
Although economic growth was the engine for rapid societal transformation in these countries, it was not a panacea: Absolute poverty has decreased, but inequality has not; Relative deprivation became a serious problem; Increasing expectation level of the people required for better quality of life and more freedom. After four decades of successful industrialization and democratization, South Korea is now facing confusion and conflict instead of satisfaction and pride. Impressive achievements are tarnished by harsh reality such as growing inequality, declining trust and worsening political apathy. Rapidly growing Chinese economy also entails growing gap between the urban and rural areas, between the rich and the poor, between the manufacturing and agricultural sector, and between the coast and inland.
At this point we have to think seriously what social progress means. GDP has been the most important measure for social progress since it was invented by Kuznets in 1934. After the great depression and series of wars, economic recovery was the primary concern, and thus GDP was the most important measure for all countries. But it is well-known that GDP has many drawbacks as a measure of social progress (Costanza 2009). The most critical challenge is that GDP does reflect neither the non-monetary activities nor qualitative aspects of the society such as inequality, well-being and life satisfaction.
Social progress is a complex phenomenon irreducible to one or two factors such as “the economic” or “the political.” Quality of life (QOL) paradigm, proposed as an alternative measure for GDP, is based on the assumption that diverse indicators and indices of individual life will reflect the well-being of the people, and summarize the qualitative aspect of social progress (Sen 1999; Anand, Santos, and Smith 2009). However, QOL paradigm has certain limitations as follows: First of all, QOL approach lacks coherent theoretical arguments as well as clear value orientation. It also treats people as a passive being responding to the given social structure and material conditions. QOL research covers almost every aspects of human life, thus failing to reduce the endless list of elements. Human Development Index (HDI) proposed by Nobel Prize laureate Amartaya Sen, is a revision of the GDP by incorporating quality elements such as life expectancy and substantive freedom to exercise functional capabilities. HDI has been adopted as an alternative measure for social progress by UNDP, and is annually calculated and announced.
There are increasing number of new concepts and alternative measures other than GDP, and recent effort by French President Nicolas Sarkozy is the most prominent (Stiglitz 2008). He appointed Joseph E. Stiglitz as chairman of the Commission on the Measurement of Economic Performance and Social Progress, and the commission has recently published a report and concluded that, to summarize what is going on in our complex society in a few easily interpretable numbers, we need a broader set of indicators that more accurately capture both well-being and sustainability; and it should provide impetus for improving the ability of GDP and related statistics to assess the performance of the economy and society.
Social quality (SQ) is a comprehensive concept of the quality of people’s daily lives. Instead of GDP which measures “the economy” in narrow sense, SQ is more concerned about “the social” in broader context. Originally SQ was defined as “the degree to which people are able to participate in the economic, social and cultural life of their communities under conditions that enhance their well-being and individual potential.” (Beck et al. 1997) As a measure of social progress, SQ has certain advantages and shortcomings at the same time.
First of all, SQ is a powerful alternative to GDP and extends the measure to the social aspects of societal progress. Contrary to Quality of Life tradition, SQ is a theoretically articulated concept: SQ is defined as a function of the constant tension between individual self-realization and participation in the various collective identities that constitute everyday life (micro and macro world), and between the world of organizations and the one comprising informal relationships (system and life world). Four constitutional factors in combination open up the possibility for social quality: social recognition (or respect); the rule of law, human rights and social justice; social responsiveness (the openness of society); and the individual’s own capacity to engage. Once constituted, four conditional factors determine the opportunities for the achievement of social quality. Social structures may be more or less enabling and supportive (social empowerment); institutions and groups may be more or less accessible (social inclusion); people will have variable access to the material, environmental and other resources necessary for participation (socio-economic security); and their society and communities will be characterised by different forms and levels of cohesion (social cohesion) (van der Maesen and Walker 2001; van der Maesen, Walker, and Keiger 2005).
It is assumed that these four “conditional” factors, derived from theoretical construction, can be measured by indicators and then combined into a composite index of social quality. Though it is a theoretically rigorous construction, it is too complicated to be operationalized into empirical indices. When it comes to operationalization for empirical research, ambiguities are revealed. For example, social networks are interpreted as a signal of social cohesion and social inclusion at the same time, and school enrolment is interpreted as a measures of social empowerment and social inclusion at the same time. To solve these confusions, we need to introduce deductive methods to extract coherent factors measuring the quality of the social. One alternative is to figure out the principal components underlying diverse indicators, and grouping and clustering countries based on different indicators. Section IV of this paper deals with this issue.
Another issue is the relevance of the original definition of SQ in different social contexts. As SQ is a concept based on Western European experience, it takes mature industrial structure and high level of per capita GDP, consolidated democratic process, transparency and rule-by-law for granted. As a result, for example, the original measure of social cohesion is more concerned about individual networks and connectedness, while omitting rule-by-law and transparency that is believed to be the most important factor for social cohesion by scholars on social capital in different countries such as Italy and Asian countries (Putnam 1993; Fukuyama 1995). As a critical opposition to the liberal-turn by Thatcherism, European SQ paradigm is mainly concerned about the recovery of social policy which has been ignored by dominant economic policy.
However situations in other continents are quite different. Still economic growth is the most needed solution to solve many problems such as absolute poverty and low quality of life in Asian and African countries. Many less developed countries are suffering from the lack of predictability in economic and social life, in addition to the lack of political freedom. Even in European context, there are wide differences in terms of welfare systems and institutional template of welfare policy among Nordic, Continental, Eastern and Southern Europe.
Proposed Social Quality Concept and Measure
For any indicator to be a valid and efficient measure to summarize the situation of a society, it should satisfy several requirements: Parsimony is the most desirable virtue; too many factors may cancel out each other and make it more difficult to find out valid data. As an alternative, following the theoretical tradition suggested by Habermas, we propose that Social Quality of a country can be measured in two main domains, i.e., system and lifeworld (Habermas 1984, 1987). System aspect of Social Quality is closely related with risk governance, and life-world level interaction among individuals is constrained by and contributes to the “societal moral resource.”
It is very important to note that risk is not confined to the traditional types such as natural disasters and illness. Anything which threatens the wellbeing of people can be interpreted as risks (Beck 1992, 1999; Taylor-Gooby 1999, 2004). Risk governance system is closely related with the institutiona arrangement by the government as well as market and informal networks, to provide people enough resilience to social and economic risks created by the working of the economy and by other causes (Holzmann, Sherburne-Benz, and Tesliuc 2003). Without risk governance system, many people excluded from the labor market will directly confront the shock cause by diverse social risks, such as unemployment, poverty, social isolation, discrimination, and victimization to crime without any safety net. People can accumulate resilience to social risks by maintaining their jobs, and by enhancing their human capital through education. Therefore there will be two different types of risk governance either by education and provision of jobs on the one hand (enhancing resilience), and providing public assistance and covering pension schemes on the other (providing safety net).
“Societal moral resource” is the socially constructed element of social quality, and it is composed of social capital and perceived democratic process that empower people and thus harbour active participation. The most important aspect of social capital lies in the predictability of social rules and transparency of the society. When people think that rules are respected without exception, legitimacy of the system is enhanced. When people think democracy is working, they will be encouraged to participate in elections and other political events to determine their own fate.
>
Selecting Countries and Variables
Following the discussions so far, we have selected a set of countries to be compared and variables that best reflect social quality theory. Easier was selecting countries. Our criteria are twofold. One is to include as many OECD member countries as of October 2009 as data availability allows. The other is to add a few more countries from outside OECD that are of international concern, such as China. Table 1 gives the list of 35 countries in our data set in alphabetical order.
All thirty OECD member countries are included in Table A, appendix. However, this does not necessarily mean that these countries are fully represented in our social quality measure because for some of them we eventually failed to find appropriate data for some of the variables. Thus, these countries could be compared only in terms of some sub-domains of social quality where they provided complete data. These countries are Canada, Iceland, New Zealand, and Norway. We also wanted to add a few countries from outside OECD: Argentina, Brazil, China, and Thailand. China needs no explanation, because everyone in the world is watching the country closely. We wanted to include Brazil not only because the country is one of the newly emerging BRICs but also because our previous analyses of the typology of social quality around the world repeatedly revealed that Brazil and Korea belong to the same type, though not score, of social quality. Argentina has long represented Latin American path of development. We also wanted to have Southeast Asia represented in our study. Thailand is perhaps the most internationalized in the region and one of the most vibrant economies.
The 95 indicators for measuring social quality were originally devised by European scholars (van der Maesen and Walker 2001). Later, they were revised by a group of Asian scholars to suit the Asian context different from Europe (Wang, forthcoming). However, some of these indicators are too detailed to be used for a macro comparison across countries such as our attempt in this paper. Also, we suggest that we set a certain limit to the number of indicators because too many indicators tend to dilute fine differences when constructing a composite index. As a result, we suggest that we use the following variables to measure social quality of countries in Table B, appendix.
Although the social quality framework and indicators as originally developed by European scholars suggest which variables are assigned in which domain, a reality check would make the theoretical discussion much healthier. Thus, we decided to run a factor analysis to see how well the relationship among these variables fit the theoretical framework. Statistical analyses can be driven by purely data, by purely theoretical guidance, or by both. We chose the dialogue between data and theoretical guidance. Unlike indices of economic growth, our data contain both “hard” data measuring system characteristics and survey data mostly representing the evaluation of, or satisfaction for, the system by the populace.
Putting these qualitatively different data into a same analytical routine presupposes they work in the same way to produce the quality of the society under consideration in the real world, which is simply not true. One example is the well-known concept of post-materialist liberty aspiration (Inglehart and Welzel 2005). As a society modernizes together with its economic growth and accompanying spread of post-materialist values, democracy tends to work better (system characteristics). However, expectations about democracy tend to grow much faster than the speed with which the way democracy gets improved. As a result, the gap between people’s aspiration and the reality becomes larger than before, even with improving democracy in the real world. This and other examples suggest that we might not want to have these qualitatively different types of data into a same factor analysis routine.
[Table 1.] Eigenvalues, percent of variance explained, and factor loadings

Eigenvalues, percent of variance explained, and factor loadings
Thus, we suggest distinguishing between two different groups of variables. One is what we call “system” variables: male employment rate, female employment rate, public educational expenditure, public social expenditure, trade union density, upper secondary education gross enrolment ratio, gross pension replacement rate, and relative poverty. Each of these variables comes from hard data. Also, they measure the composition of the system. In this sense, they can be also thought of as
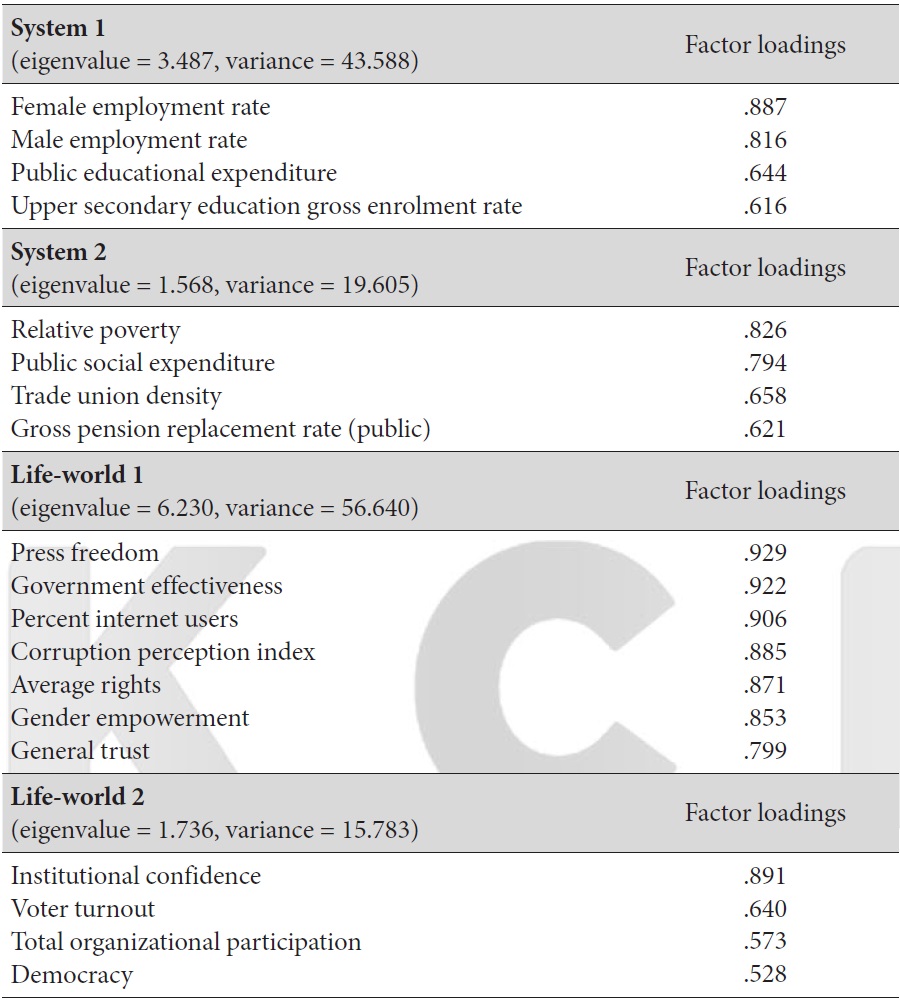
Accordingly, we ran two separate factor analyses, once with system variables only and the second time with life-world variables only, both using principal component extraction method and varimax rotation. All the variables have been transformed using linear scaling method to ensure comparability and to suppress the unwanted effects of extreme values. Each run returned two factors with eigenvalues larger than 1.
Table 1 summarizes eigenvalues, per cent of variance explained, and rotated factor loadings for each of the four factors. Variables grouped together in System 1 factor concern the ability with which a society can invest in education and human capital and thereby enhance the resilience of the people in the labor market. Variables in System 2 factor seem to represent the state’s ability to intervene in the market by means of various social safety nets and thereby protect those who fall behind. Life-world 1 factor has variables that are primarily concerned with fair rules of the game and the freedom of speech. When these conditions are met, people tend to cohere with and trust each other. In this sense, this factor might be called social
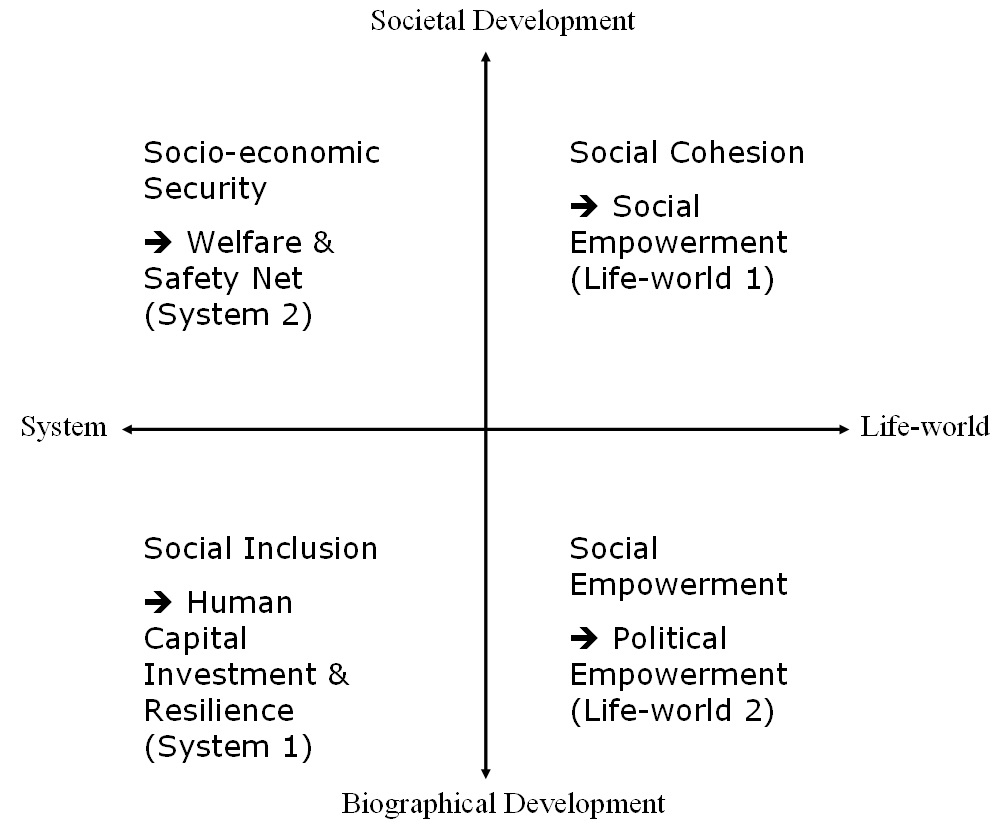
Note that the four factors obtained from two separate runs of factor analysis correspond nicely to the original social quality framework. However, there no longer exists the ambiguity where one variable can belong to one or another quadrant, because we can now be sure which variable belongs to which quadrant, thanks to the previous data analyses. Figure. 1 presents the modified social quality quadrants according to our analyses. Human capital investment and enhanced resilience (System 1) correspond to social inclusion. These are system-level characteristics that concern individual biographical development. Welfare and safety net (System 2), mostly affected by the state’s ability and policy orientation, fit in socio-economic security. These are once again system-level characteristics but they are related to societal rather than individual development. Social empowerment such as fairness, freedom, and trust (Life-world 1) corresponds to social cohesion in the original theoretical framework. This dimension measures how well freedom of speech is guaranteed and fair rules are met at the societal level. Political empowerment such as voter turnout and organizational participation (Life-world 2) corresponds to social empowerment in the original framework. We suggest that this dimension measures how much people participate in, and appreciate, their own society at the individual level as a result of developments in the other three dimensions. As is obvious from Figure. 1, the modified social quality quadrants correspond very closely to the original framework, but this time without any theoretical or empirical ambiguity.
Although modified after what the data analyses indicate, we believe these new dimensions of social quality do not betray the original theoretical formation. Rather, it eliminates ambiguities while at the same time adhering to the original definition. Let us re-consider the definition of social quality as proposed by Beck (1997).
In our modification, participation occurs primarily in Life-world 2 (political empowerment). But it is possible only when communities flourish in Lifeworld 1 (social empowerment), which in turn requires conditions which enhance well-being in System 2 (welfare and safety-net) and individual potential in System 1 (human capital investment and resilience). The specific arenas of community life where participation occurs can be diverse. They can be social (Life-world 1), economic (System 1) or cultural (Life-world 2).
How Countries Are Doing in Social Quality
Once the dimensions of social quality are identified empirically as well as theoretically, it is now possible to calculate SQ scores on various dimensions for each country. For calculating SQ scores, we first transformed the variables using linear scaling method to eliminate unwanted effects of extreme values, re-scaled them to vary between 0 and 100, and then obtained the mean of variables corresponding to each dimension.
Table 2 reports score and rank of each country in terms of different social quality dimensions, together with 2007 GDP per capita in thousand US dollars. Of the 34 countries, total SQ scores could be calculated for only 26, because the remaining 8 countries had missing values for one or more of the variables. The ranks of countries, especially in terms of total SQ, do not show a dramatic deviation from commonsensical order. However, a closer look reveals that some countries doing extremely well on one dimension but poorly on another. Take Luxembourg, for example. Luxembourg ranks 24th on System 1, but 1st on Life-world 2, ranking 5th on the total SQ score. If our interpretation is correct, the country relatively lags behind in terms of human capital investment but the people are highly empowered to participate in organizations and political processes. Some countries like Denmark are doing very well on every dimension. Likewise, some countries are doing equally poorly on all dimensions.
Note that GDP is not always a good proxy for social quality. Austria, for example, ranks 12th in terms of GDP, but the country ranks 4th on total SQ score. Another good example is Australia, ranking 14th on GDP and 7th on total SQ. Since we suggest that social quality is a totality made up of qualitatively different arenas of social life, it is necessary to not only construct a composite index but also find out whether there exist different types of social quality. For this purpose, we have run two separate cluster analyses: one with system variables and the other with life-world variables. In order to have as simple a typology as possible, we used K-means clustering algorithm requesting two clusters from each run. A combination of these results is summarized in Table 3.
[Table 2.] Scores and Ranks in Terms of Social Quality Dimensions
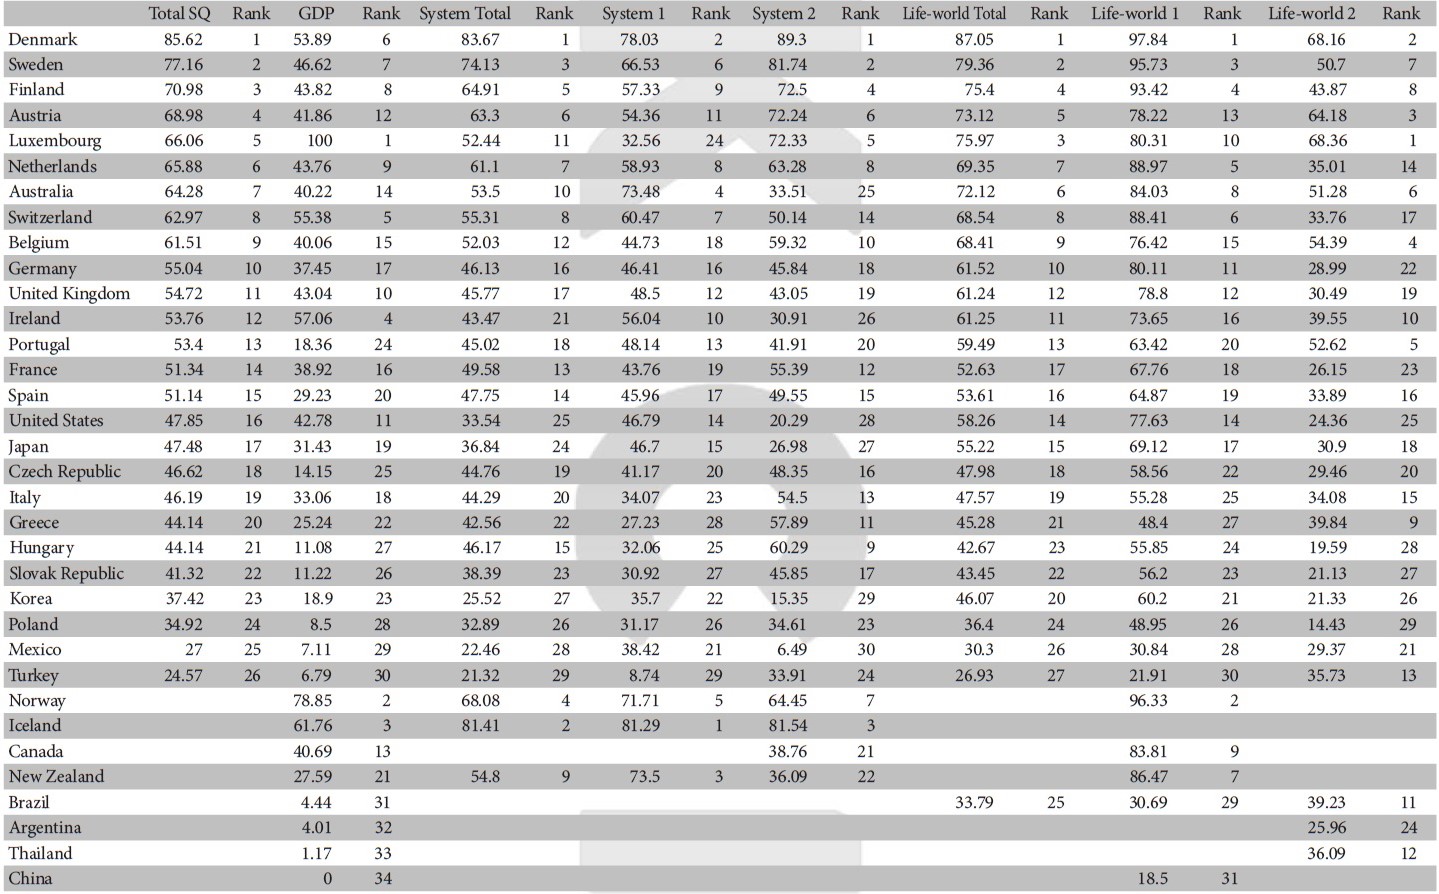
Scores and Ranks in Terms of Social Quality Dimensions
[Table 3.] Social Quality Typology
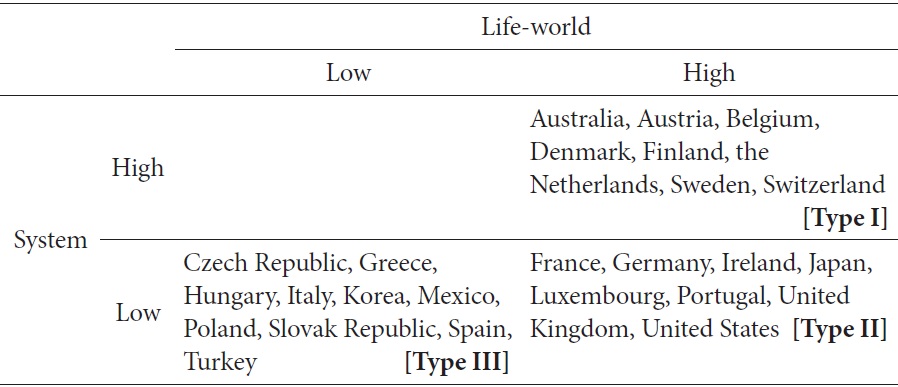
Social Quality Typology
Although we did not intend it, both cluster analyses returned clusters sharply distinguished from each other in terms of scores in almost all the variables put in. If the mean for one variable is higher in cluster 1 than cluster 2, the same pattern was observed for almost all the other variables. This simple characteristic allowed us to construct a two by two table as shown in Table 3. Although there are four theoretical possibilities, it turns out that there are only three in the real world. Countries can achieve high life-world quality even with low system quality, but not
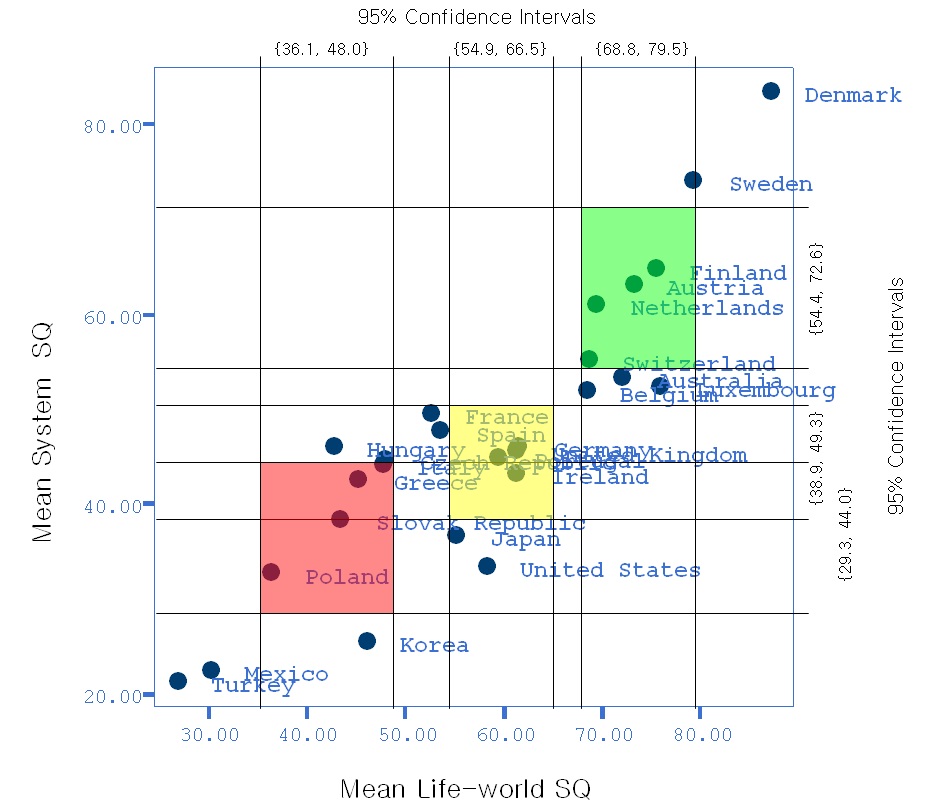
Figure. 2 is a plotting of countries according to their mean system SQ scores and mean life-world SQ scores. Gridlines represent 95 percent confidence intervals for the three groups derived from Table 3. Note that these confidence intervals do not overlap with only one exception where the upper bound for the lowest group overlaps with lower bound for the medium group. The three colored rectangles represent the three real-world possibilities of social qualities in Table 3. Some countries are located outside these 95 percent confidence intervals. Denmark and Sweden, for example, boast social quality beyond the upper 95 percent bound of high SQ group on both axes. One important finding, consistent with Table 3, is that countries cannot have high system quality when they have low life-world quality. Once they reach a certain level of life-world quality, it seems that there exist two different paths. One is to invest in enhancing system quality just like Nordic countries did. Out data indicate that this will enhance life-world quality even further. The other is to keep relying on life-world quality without further investment in system quality. If our interpretation that high system quality means decommodification, this strategy will lead to emphasis on individual competitiveness and flexible labor market. The fact that the United States, even with its relatively high life-world quality, stays very low in terms of system quality seems to support our interpretation.
Out attempt to construct social quality as a measure for social progress started from the concern that GDP might not properly capture the “social” aspect of development. Our results seem to suggest that the “soft” side of development may exercise fundamental influence. Countries have to reach a certain level of life-world quality before they pursue high system quality. Once they reach that minimum level, then there comes the strategic choice: commodified or decommodified world.
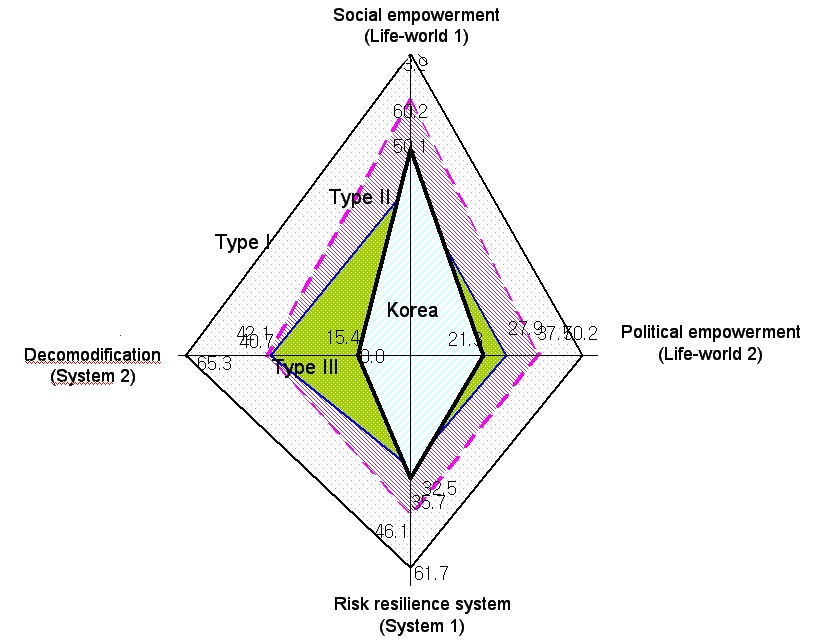
Figure. 3 shows SQ profiles across different SQ regimes. The difference of the area shows the capacity a country provides to the people via systemic engagement on social and economic risk management or promoting social and political environment so that people can enhance their well-being by participating in diverse civic activities. Korea’s profile of SQ belongs to Type III, but it is different from typical members: Korea shows higher level of social empowerment compared to other Type III countries, and relies more on market-based risk-resilience system but is lagging behind in terms of decommodification and political empowerment. The poor performance of SQ quadrangle of Korea shows that after decades of rapid economic growth and political democratization, Korea is now facing a new era where the expansion and upgrading of the social quality became a critical task to upgrade the quality of life.
We regret that we could not secure more complete data to figure out the qualitative differences among different countries, especially those newly emerging industrial countries. Securing more information on other countries will enable us to figure out the dynamic dimensions of SQ regime formation in different continents with different historical and institutional background.