본 연구는 폭넓은 시간과 금전적 투자가 요구되는 여가 행위를 분석하기 위하여 다양한 통계적 접근법을 활용하였다. 이러한 여가 행위에 관한 연구는 진지한 여가 측정 척도(SLIM) 출현으로 가속화 되었다. 그러나 많은 연구에서 사용되는 탐색적 구조방정식 접근 방법 상황에서는 진지한 여가 척도에서 사용되는 문항의 독립성을 충분히 설명할 수 없다. 탐색적 구조방정식은 사용되어지는 표본에 따라 요인과 문항사이를 설명하는 부화의 정도가 달라지기 때문이다. 따라서 본 연구의 목적은 진지한 여가 척도에 포함된 문항들이 독립된 개별 문항인지, 아니면 구인에 속한 국부 종속성을 나타내고 있는지 규명하였다. 이를 위해 리커트 형식에 많이 사용되는 문항반응 모델 중의 하나인 Samejima의 모델을 전통적인 방식과 단위검사 문항반응이론(testlet response theory)의 관점에서 진지한 여가 측정 척도를 분석하였다. 연구 결과를 통해, 진지한 여가 측정 척도의 구인에 속한 문항들은 서로 간에 중간에서부터 높은 정도의 상관관계가 있음을 나타내고 있다. 또한 두 개의 다른 문항반응 모델에서 얻은 능력 및 문항모수는 서로 높은 상관관계를 보여주고 있지만, 단위검사 문항반응모형을 이용해서 얻은 정보들 보다 정확하다.
When people engage in leisure activities that require extensive investments of energy, they are involved in serious leisure activities. Many researchers have examined various aspects of serious leisure (Gould, Moore, Karlin, Gaede, Walker, & Dotterweich, 2011; Kim, Dattilo, & Heo, 2011; Stebbins, 1982, 1992, 1997). Given the complexity of serious leisure behaviors, there is a need to explore comprehensive ways of eliciting one’s existing values and beliefs about their underlying attributes. Stebbins (1982, 1992, 1997) organized and delineated the underlying conceptual framework of serious leisure behaviors which resonated well for diverse leisure pursuits. Since then, many attempts have been made to explore, demonstrate, and predict the theories of serious leisure in the light of emerging issues and findings (Gould et al., 2008; Gould et al., 2011; Kim et al., 2011; Stebbins, 1997).
The recent development of the serious leisure inventory measure (SLIM: Gould et al., 2008) made it possible to generalize people’s attitudes about serious leisure. SLIM was implemented extensively in psychological, economical, and societal contexts (Baldwin, 1999; Gibson, Willming, & Holdnak 2002; Laverie, 1998; Guiry, Magi, & Lutz, 2006; Shaw, Kleiber, & Caldwell, 1995). Some studies indicated that certain conditions and factors were associated with an increased probability of people becoming involved in serious leisure activities (Hwang, Lee, & Ra, 2011; Kim et al., 2011). Other studies mentioned some significant indicators (e.g., participants’ demographic characteristics, lowest socioeconomic status, gender, age, ethnicity, individual’s personality, level of motivation, self-efficacy, and interest in leisure) that influence the quality and quantity of serious leisure activities in which participants engaged (Hwang et al., 2011; Kim et al., 2011; Tsaur & Liang, 2008; Shaw, et al., 1995). In parallel, recent concern prompted researchers to examine the complex structure of the serious leisure instrument with the aim of improving measurement reliability using different statistical approaches (Gould et al., 2011; Hwang et al., 2011; Kim, et al., 2011; Ra & Hwang, 2011; Tsaur & Liang, 2008). Thus, it is necessary to examine the characteristics of each item of SLIM instead of simply assuming the validity of SLIM
Although rich studies identified factors associated with adopting serious leisure pursuits (Gould et al., 2011; Hwang et al., 2011, Kim, et al., 2011; Tsaur, & Liang, 2008), few studies have examined individual item functioning on SLIM (Ra & Hwang, 2011). For instance, participants’ responses to items measuring certain domains could be correlated when there was unexplained variability along the other dimensions of serious leisure. In addition, it was natural to include hierarchical structures that were substantively meaningful to serious leisure. Since different statistical tools could amplify or mitigate the apparent constructs of serious leisure, there was a need to broaden the understanding by taking a different approach. In response to this need, the present study investigated psychometric properties of items on the SLIM using the Bayesian random testlet perspective. Valid and reliable instruments help not only in building and developing a firm grounding for this research, but disseminating the topics across many different disciplines. Therefore the research questions for this study are to examine whether items within each domain are inter-correlated and how inter-correlated items affect item and ability parameters.
Item response theory (IRT) was a contemporary measurement technique which has been used widely to model testing data and survey data. Within the IRT framework, local item independence (LID) was a key assumption directly related to the estimation process besides the unidimensionality assumption. Previous research, however, stressed that real test data often did not satisfy, even approximately, the LID assumption for tests intended to be unidimensional, especially achievement test data (e.g., Reckase, 1979; Yen, 1984, 1993). The basic principle for the violation of LID assumption was that there were additional ability dimensions that affected item responses but were not accounted for by the unidimensional IRT model.
The violation of the LID assumption had negative effects on many aspects of measurement, such as test information, trait and item parameter estimation, and equating (Wainer & Thissen, 1996; Yen, 1984, 1993). Locally dependent (LD) items were potentially redundant and contained less information than the IRT model appeared to predict (Sireci, Thissen, & Wainer, 1991; Thissen, Steinberg, & Mooney, 1989). Chen and Thissen (1997) showed through data simulation that with the violation of the LID assumption, the item parameter estimates might be very different from what they would be if the data were locally independent. Furthermore, Yen (1993) noted that trait estimates were also affected by the LD items because the trait estimates from IRT models were a weighted sum of item scores, with the weights being functions of item parameters. Not surprisingly, IRT analysis of data with the LD items produced inaccurate item characteristic curves (Yen, 1993).
Such phenomena implied that an examinee’s performance on context-based items was influenced by the additional abilities that were not accounted for by the standard IRT model. The LD items could be produced by an test-taker’s unusual level of interest or background knowledge about the passage, or by the fact that information used to answer different items was interrelated in that passage (Yen, 1993). Regarding the possible causes of violation of the LID assumption, Yen (1993) also mentioned speediness, fatigue, practice, item or response format, passage dependence, item chaining, and explanations of previous answers. In parallel, LD of items in the SLIM bore some unique characteristics which deserved separate analysis because several items in the SLIM were phrased in a similar structure and were context-dependent item sets.
A small number of items that paired with a common stimulus (passage) were called a testlet, a concept introduced by Wainer and Kiely (1987). However, the term “testlet” was not used to refer to groups of items physically clustered under common stimuli. Instead, the concept of testlet was first proposed as “convenient units from which to construct a test” (Wainer & Lewis, 1990, p. 12). Employing the concept of testlets could guarantee content balance either by ensuring that each testlet was balanced, or by judicious choice of testlets that extended one aspect of the test specifications. Responses to items within a testlet were not likely to be independent of one another due to factors associated with the passage, such as subject matter expertise, and misinterpretation of the passage. Thus, items within a testlet might have chaining effects, which might vary over persons. Furthermore, individuals could have different subjective judgments in selecting categories of rating scale items.
Testlet design was advocated partly because it corresponded to real life situations in which problems were always interrelated. In general, the amount of local dependence increased due to the magnitude of the tesstlet effect. Additionally, it was well established that ignoring the testlet effect would result in underestimated standard error of ability and biased item parameters (Ip, 2000; Sireci et al., 1991; Wainer, 1995; Wainer, Bradlow, & Du, 2000; Wainer & Thissen, 1996; Wainer & Wang, 2000; Wilson & Adams, 1995; Yen, 1993). Hence, biased item parameters tended to inflate reliability estimation (Sireci et al., 1991).
Testlet response theory was one such approach. Bradlow, Wainer, and Wang (1999) modeled the dependency within a testlet by adding a parameter to two-parameter normal o’give model. Later, Wainer et al. (2000) proposed a three-parameter logistic model for testlet-based test. Wang et al. (2002) further extended the previous models to include two basic probability kernels: the three-parameter logistic model for binary data and the graded response model introduced by Samejima (1969). They called it a general Bayesian model for tesltets which is as follows
where
With respect to the estimation of testlet effect, the testlet-effect parameters are assumed to come from normal distributions, and each testlet is given its own testlet-specific variances, γ
The existence of local dependence within a conceptual passage was first examined with Q3 (Yen, 1984), likelihood-ratio statistic (Chen & Thissen, 1997), and Statistic for difference in correlation (Press, Flannery, Teukolsky, & Vetterling, 1986), which were provided by running the LDIP program (Kim, Cohen, Lin, 2006). The SCORIGHT 3.0 program implementing Bayesian approaches (Wang et al., 2002) was used to estimate parameters for items and individual’s serious leisure aptitude (θ) with two different models: GRM and the GRM testlet (GRM-T). This study ran multiple chains with 50,000 iterations. After discarding 15,000 iterations as burn-in periods, all inferences about parameters were made.
The sample was obtained through a survey administered on serious leisure. The research proposal for this study was submitted to and approved by the institutional review board for research with human subject. Respondents who had memberships with fitness centers which had various activity program such as aerobics, Yoga, and swimming in Seoul, S. Korea were collected with 72 items to measure the level of serious leisure. To collect samples, a cluster random sampling method was utilized (50 participants from each of the randomly selected six fitness centers). A total of 300 questionnaires were distributed and all of these were returned. However, 45 surveys were excluded for the analysis because they had data missing at over 50 %. Finally, a total of 255 surveys were included in the analyses. These data were re-used from Hwang & Seo’s (2009) research. The age of the participants ranged from 21 to 62 years old and the average age was 29.06 (
An extensive effort has been expanded to validate the SLIM (Hwang & Seo, 2009; Hwang et al., 2011, Ra & Hwang, 2011) using explanatory factor analysis as well as confirmatory factor analysis. Particularly, these studies (Hwang et al., 2011, Ra & Hwang, 2011) consider measurement errors caused by the test translation. In general, previous studies validate high internal reliability of SLIM (
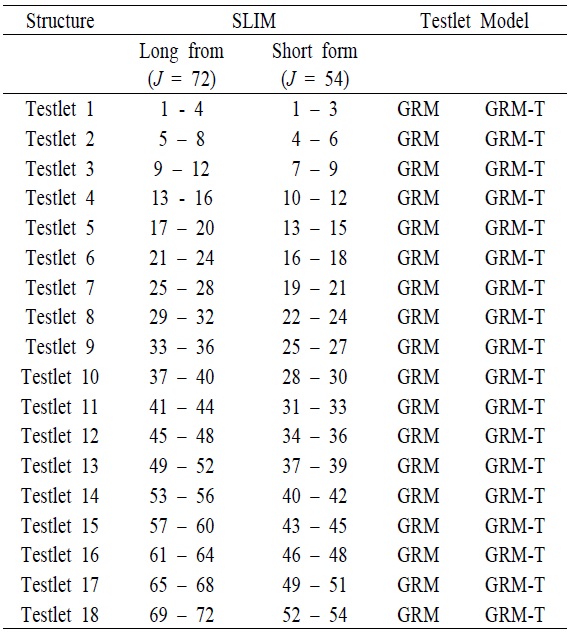
[Table 1.] The Structure of the SLIM

The Structure of the SLIM
Before investigating psychometric properties of items in the SLIM, internal consistency was examined <Table 2>. Both long and short forms of SLIM had very high Cronbach’s alpha, which indicating high internal reliability. In addition, descriptive statistics from the study showed that it was reasonable to assume that data followed the normal distribution since an absolute skewness value greater than 3.0 and absolute Kurtosis values above 10.0 were considered problematic in normality (Kline, 1998).
[Table 2.] Descriptive Statistics for long and short forms of SLIM
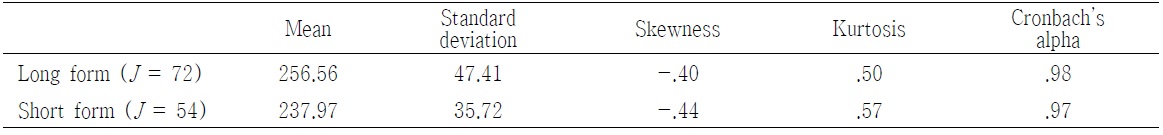
Descriptive Statistics for long and short forms of SLIM
Like other standard IRT models, the prerequisite unidimensionality assumption in the GRM and GRM – T models was examined with factor analysis. Results showed that both the long and short forms of the SLIM met the unidimensionality assumption by the recommendation (Reckase, 1979), where the first factor at least accounted for 20% of the test variance. There were 12 factors for the long form of the SLIM if based on eigenvalue greater than 1 criterion. The first factor accounted for 44% of the variance. However, the second factor only explained about 5.7% of the variance. The eigenvalue of the first component was about seven times as large as the eigenvalue of the second component while the differences of the remaining successive eigenvalues were very small. Furthermore, it was possible to clarify whether the current data was unidimensional when the ratio of the first eingenvlaue to the second eigenvalue was calculated (31.857 / 4.147 = 7.681). Similar effects were noted with the short form of the SLIM.
With the condition that testlet models should be weighed against the added complexity in data analysis, the degree to which LID existed on the test must be ascertained before deciding how to best model the test. <Table 3> showed LD indices with likelihood-ratio statistic (
[Table 3.] Values of Local Dependence Indices
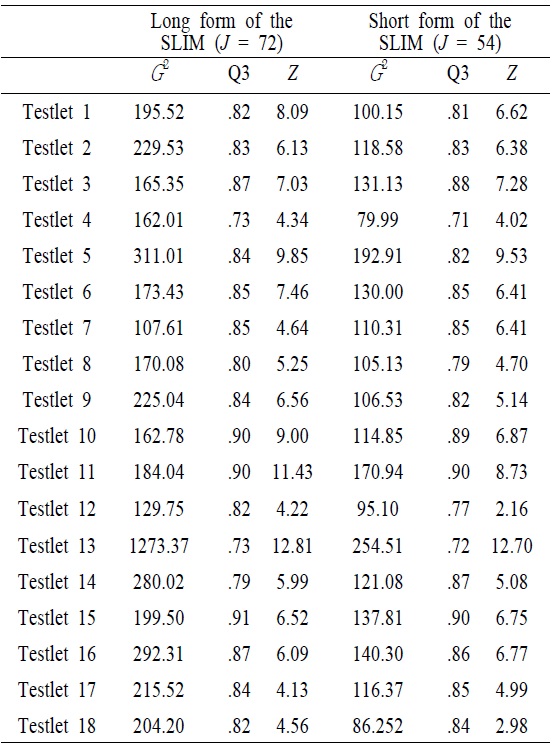
Values of Local Dependence Indices
Of all tesetlets included in the SLIM, some passages had much higher conditional dependence than others <Table 4>. For instance, the variances of the testlet effect for 5 and 13 (the conceptual passages of personal enrichment and financial return) in the long form of the SLIM were 1.222 and 2.965, respectively, which were much greater than other conceptual passages. In addition, the magnitude of the testlet effect in the short form of the SLIM was, in general, smaller than that of teslet effect in the long form of the SLIM. This implied that a number of items within testlet affected the magnitude of the testlet effect. Of particular note was the somewhat higher teslet effect observed for the testlet 5 and 13.
[Table 4.] Size of Testlet Effect
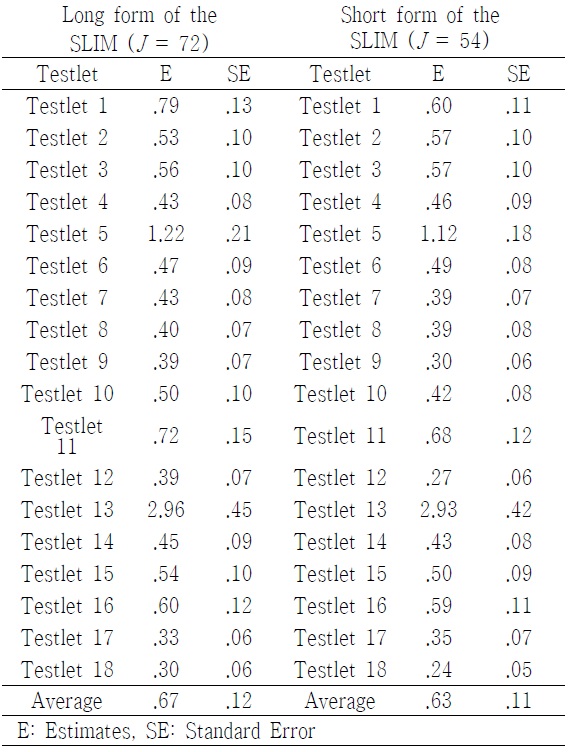
Size of Testlet Effect
After obtaining the magnitude of testlet effect, parameters for item and serious leisure aptitude for two models were computed <Table 5>. The numerical result showed that there were small but reliable biases in the estimated values of the item parameters of SLIM testlet items when local dependence was ignored <Table 5>. For instance, mean of item discrimination obtained from GRM was higher than that of item discrimination obtained from the GRM – T model in the long form of the SLIM. A Similar pattern was found in the short form of the SLIM. However, the correlation of item discrimination between GRM and GRM-T model in the long form (
[Table 5.] Summary Statistics of the SLIM
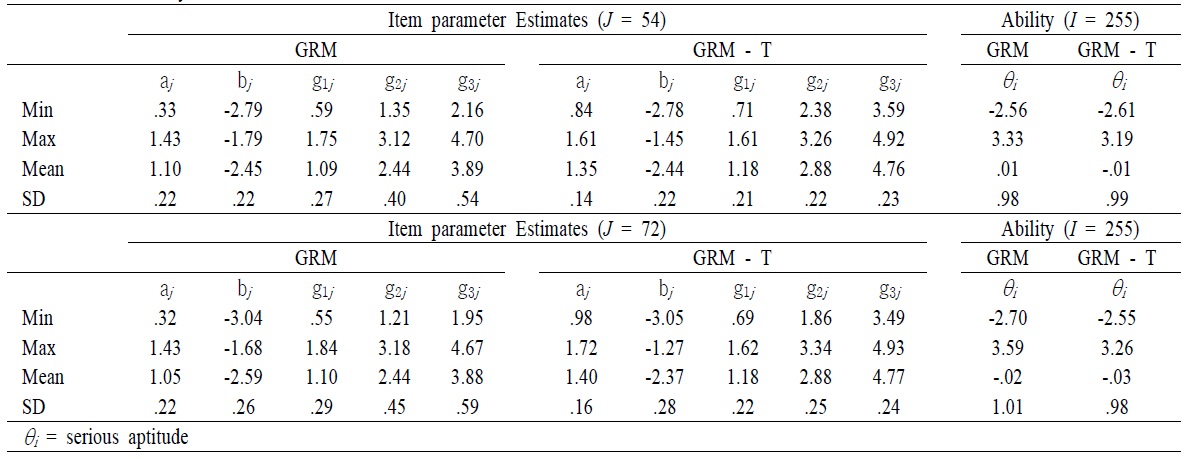
Summary Statistics of the SLIM
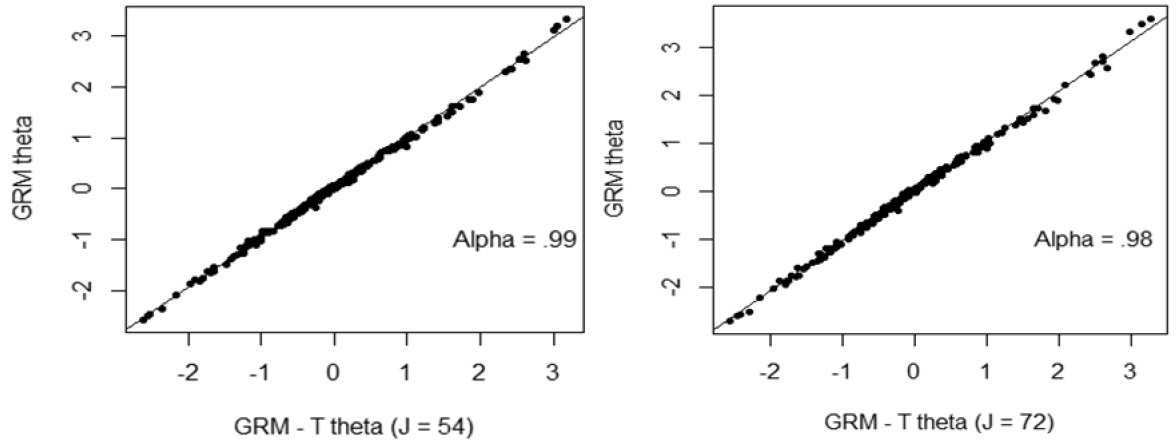
In order to investigate the accuracy of the estimates of the parameters of θ affected by the violation of local independence, comparisons of parameters of θ obtained from GRM teslet and GRM were graphically presented. Regardless of number of items in a testlet, the estimates of θ tended to be very highly correlated, with the correlation being greater than 0.98 (
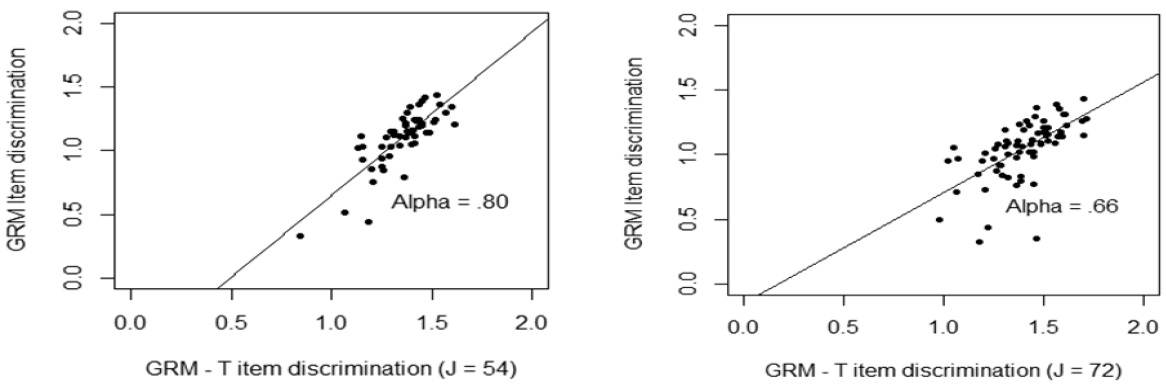
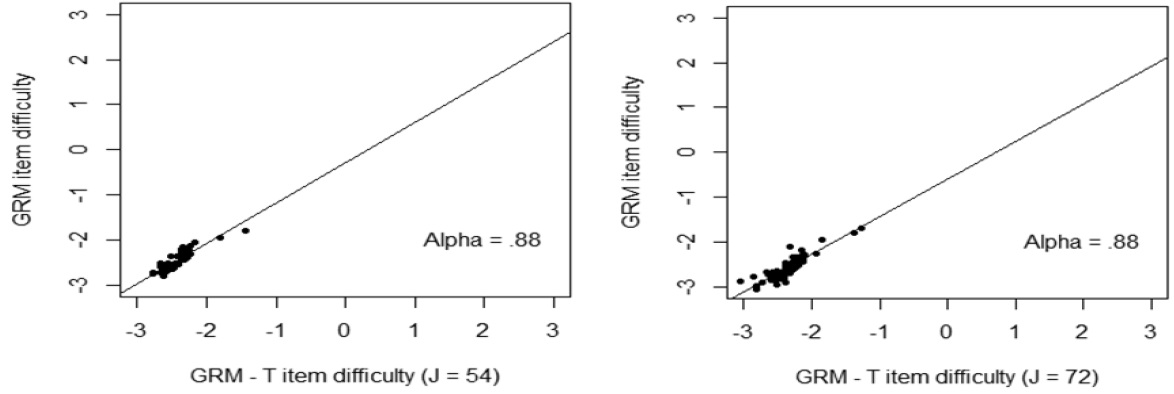
Testlet effects occurred largely in item parameters. Item discrimination and item difficulty parameters were graphically presented <Figure 2 – Figure 3>. <Figure 2> showed that when the number of items in a testlet was increased, the correlation between the GRM and GRM – T model was sharply reduced. However, the difficulty parameters between the GRM and the GRM- T yielded a relatively high correlation, 0.88, regardless of number of items in a testlet. This implies that the item difficulty parameter was relatively less affected by the testlet.
Item dependency has been a concern in educational and psychological instruments. In addition, item dependency should be addressed in order to apply the IRT to the data. Despite the necessity of considering item dependency, the common procedure is to ignore item dependency. However, this approach causes inflation in reliability and test information and yield biased estimates for item and person parameters. Another common approach is to create testlet accounting from item dependency. The testlet approach not only manages item dependency but also contains item-pattern information.
The primary focus of this study was to establish the construct validity for the long and short forms of the SLIM as issues of validity serve as an important guide in the research design, scoring, and analysis of the SLIM. This study revealed that testlet effects were observed for the long and short forms of SLIM. Noticeable findings were that different numbers of items within each testlet yielded different degrees of testlet effects, which were reflected in previous studies (Bradlow et al., 1999; Sireci et al., 1991; Wainer, 1995; Yen, 1993). These findings also implied that there was a possibility to amplify or mitigate estimates of item and person parameters in terms of serious leisure. Thus, it was necessary to consider characteristics of items on the SLIM due to either the testlet length or the teslet effect (Bradlow et al., 1999; Sireci et al., 1991; Wainer, 1995; Yen, 1993).
There is no doubt that there is a need to accurately measure serious leisure, especially for those providing and receiving the leisure. Understanding measurement issues on the SLIM are fundamental not only to grasp what needs to be done to increase the reliability and validity of the measure, but also to understand the consequences of those changes. Because research regarding the psychometric properties of testlets has not been adequately addressed in leisure studies, this study first described the concept of testlet model, as was why it was needed, and how to distinguish it from other standard IRT models. Furthermore, the testlet model approach in this study was chosen not only because of its simplicity and appropriateness, but also because it best replicated the real world in serious leisure by considering interaction between individuals and items within the testlet.
This study reached similar findings as previous ones regarding estimates of items and person parameters. For example, conditional dependence seemed to have almost no effect on the estimation of item difficulty. However, ignoring characteristics of testlets tended to yield a bias on the estimation of the item discrimination parameter. The precision of examinee proficiency was also overestimated when conditional independence was incorrectly assumed. In terms of correlation, the correlation coefficients of every parameter between the GRM and the GRM-T model were moderate. Specifically, the correlation coefficient of item difficulty and ability parameter were strong.
In terms of testlet effect, results from the study showed that the range of variation of the variance of the testlet effect for the different passages varied widely. The overall mean magnitude of the testlet effect was around .67, indicating a moderate testlet effect. The existence of LID led to loss of test information due to an overestimation of item discrimination. In other words, it implies that it is really important to consider the format of instrument to obtain accurate estimation. In addition, the concept-based scoring yielded a lower Cronbach’s alpha than item-based scoring for the same total scores across both forms of SLIM. For instance, the value of internal consistency for the concept-based scoring in the long form (
Other than these similarities, this study also identified that a violation of the local item dependence assumption did not lead to an obvious violation of the unidimensionality assumption. The possible explanation of this observation was that items sharing the same concepts might share a common extraneous dimension, but the extraneous dimension correlated highly with the primary dimension being measured. For instance, 18 concept-based item bundles also had a dominant first factor accounting for 56% of the variance, which indicated that the SLIM as a whole did not diverge from the essential unidimensionality assumption.
This study not only explored the validity issues, but also suggested that it is possible to account for the measurement error occurring in true-score growth. In order to understand the nature of results obtained from the SLIM data, further investigation is needed. It would help researchers to scrutinize and to broaden the concept of serious leisure under the GRM-T model. However, this study had certain limitations that might be addressed in the future. For example, both accessibility of the available IRT programs and unfamiliarity of IRT concepts to researchers in the domain of leisure study might be the biggest problems. However, those problems could be solved sooner or later since many researchers having different backgrounds puts extensive efforts to validate instruments currently available in the leisure study.
Futhermore, this study was performed with data sets obtained from S. Korea, with a relatively small sample sizes (
While conducting the study, many possible extensions were discovered that were considered to be beyond the scope of the current study. To establish the generalizability of these results, it would be necessary to conduct additional studies using different sample sizes, and create simulated data sets that control for the magnitude of item dependence and dimensionality. Subsequently, it would be interesting to investigate what causes dependences among items within a testlet since the nature of test items and the characteristics of passages might affect the amount of within-testlet dependency for further studies. Another possible extension involves the program comparisons. As Markov chain Monte Carlo (MCMC) is applicable to IRT models, it is also useful to compare two programs (WinBugs and SCORIGHT) if any difference exist.