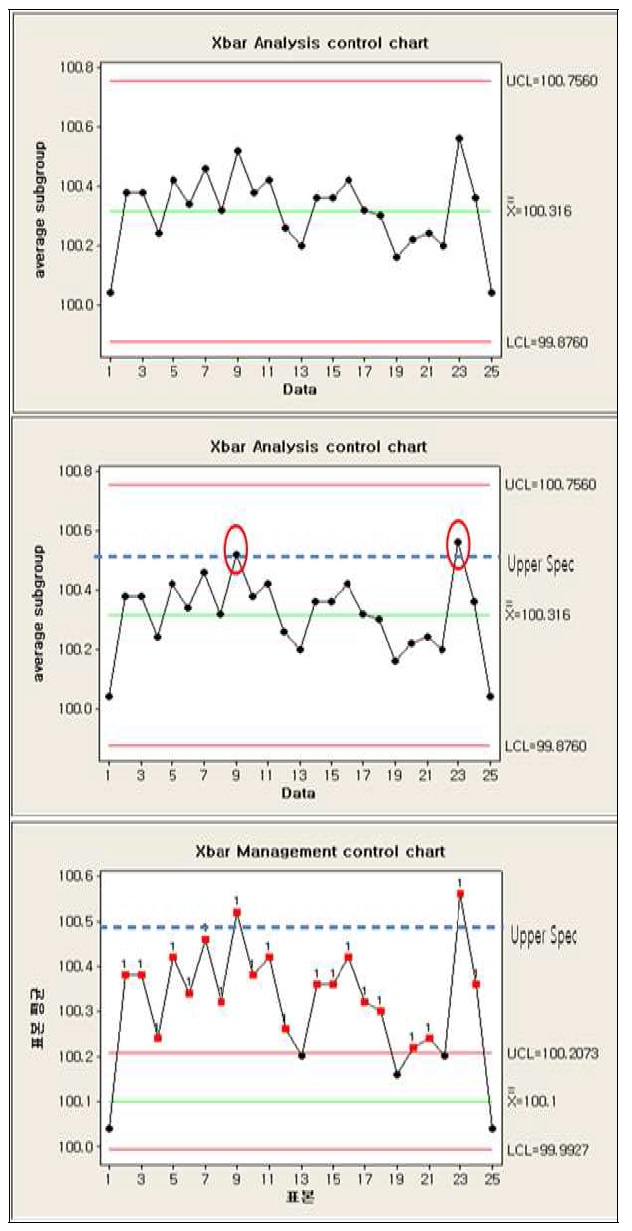
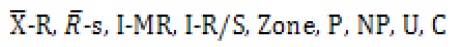
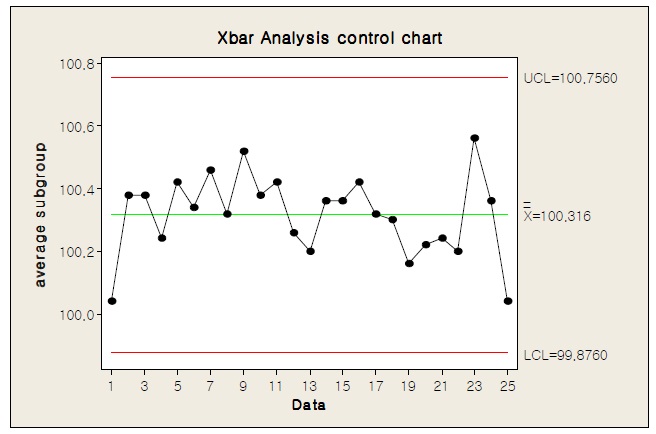
본 논문에서 우리는 동시에 볼 수 있는 수정된 3개의 관리도를 제안하였다. 첫번째 곤리도는 샘플 데이터로만 그려진 관리도이다. 두번째 관리도는 처음 관리도에 상하한 규격을 포함한 관리도이다. 세번째 관리도는 목표값이 포함되고 오랜 기간 동안의 데이터로 계산된 알려진 평균과 표준편차로 계산된 상?하한 관리선이 포함된 관리도이다. 3개의 관리도를 동시에 보면 즉시 공정의 문제점을 알아낼 수 있는 정점이 있다. 이 논문에서 제안된 방법이 현장에서 활용되어 도움을 주길 희망한다.
When we visit in real fields of industry, we can find many control chart which is misused. The reason of misusing of Control Chart, it is not enough to understand Control Chart, but data control is poor which is basic problem.
In this paper, we give a few misused control chart in real fields and propose modified suitable control chart. We give example to explain for understanding easily.
Ⅱ. ANALYSIS CONTROL CHART AND MANAGEMENT CONTROL CHART AND MANAGEMENT CONTROL CHART
Control chart used in industry fields is mostly analysis control chart for management. Which is mistake. We use Management Control Chart as Analysis Control Chart. This is fundamental mistake(We think that reason is poor teaching material which explain control chart for management).
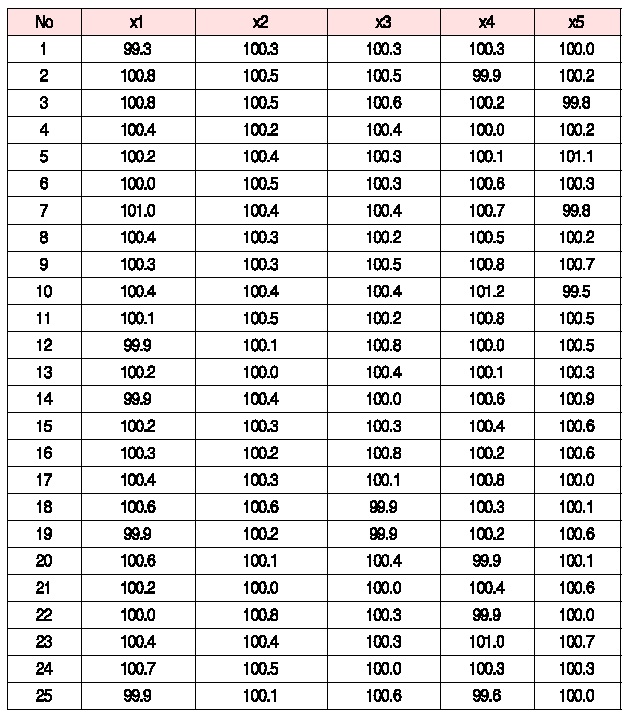
By using analysis control chart, it is possible to search whole state of present process. By analysis control chart it is not enough to know information about present circumstance of process, grasp present state, center line and upper/lower control line is calculated using data for short tern sampled. Analysis control chart is satisfied that analyze present state. However, for process administration, then we use Management control chart. Key Point of management control chart use given target value and standard deviation of long term of process. If data do not accumulate long term about process, then control chart is painted using sample data and control chart can use for analysis. Analysis control chart is used for administration early induction and before process was stabilized.
Do not use process management if analysis control chart is used. Field worker is not enough to know control chart correctly, specially means value, standard deviation, short term data, long term data. They have not gather real process data.
Management Control chart manage to keep quality characteristic by fixed value. Management Control chart is essential administration tool of process control that is used to prevent badness by checking stability of process immediately.
Most control chart that use on spot is made by using idea of Shewhart.

etc which is called Shewhart control chart or 3
Because quality level by his control chart is risen more than before, contribution of Shewhart left in industrial fields is very big. Control chart is quality control technique that is applied in all category business special manufacturing industry and service industry. Shewhart lay stress on normal distribution if accumulated gathering data of process that is managed. Data of normal distribution have 99.73% between mean-3*s standard deviation and mean +3*s standard deviation and outside mean-3*s standard deviation or mean+3 *s standard deviation is 0.27%. He thought that Action must take when data is happened outside of mean±3*standard deviation(Ree, 2005; Ree, 2006; Lim, 2006).
2.1 Management control chart have Important 3 statIstIc
Management control chart is used process manage stability. Using of management control chart depended on post's management control level. Control level of company is different.
2.1.1 Target Value
Target value is given value, Target value should be present state, not future state. Center value is not target value. Center value is mean of gathered data which is calculated value.
Target value is as administration characteristic value should be kept changelessly in spite of lot alteration of material, machine or lot alteration of worker, measurement analysis system. Target value can be changed as following cases.
Target value is established based on following cases,
If target value is not given based on certain basis, we can’t manage process correctly. The Key point of Target value is present state value, not aim value. We hope center line is same target value.
2.1.2 standard devlation
Standard deviation is calculated gathering data from managing process for long term. Standard deviation is value of present capability of process, not aim value.
Standard deviation can be calculated by methods as following.
Even standard deviation is well managed, can change. If given standard deviation is greater than actuality, defective goods detection is difficult because control line is great. By reverse, if given standard deviation is smaller than actuality, defective goods detection will mistake handle as badness.
2.1.3 Sungroup size
Subgroup is established uniformity production condition as worker, material, utilities and others. sampling data for plot control chart is gathered in same subgroup. Control chart reacts sensitively in subgroup. Control chart is purpose to find while mean value and deviation change. If subgroup is done wrongly, then can’t know change in control chart. Change is caused by accidental error in subgroup and abnormal error by changing between subgroup. Error can’t search for change because error was mixed if subgroup set is done wrongly. Subgroup standard deviation should choose subgroup. All data should do stratification.
In control chart, if data is located above upper or under lower control line, warn that there is not normal of process. Upper control line and lower control line is calculated by gathering data from sampling subgroup.
Purpose of control chart is sensing productive system change. If system was stabilized, data displays normal distribution and sampling data can expect possibility to range in specification.
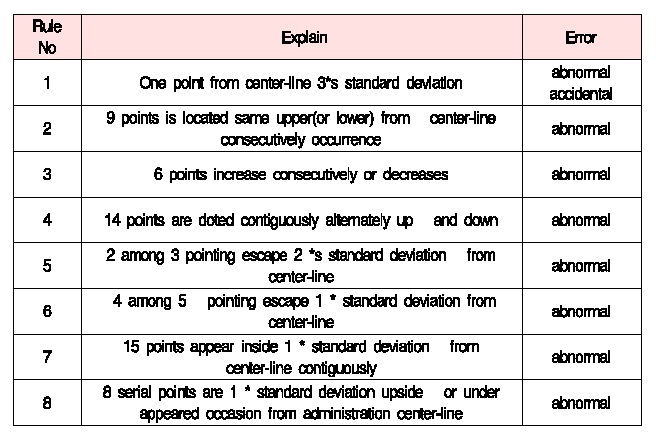
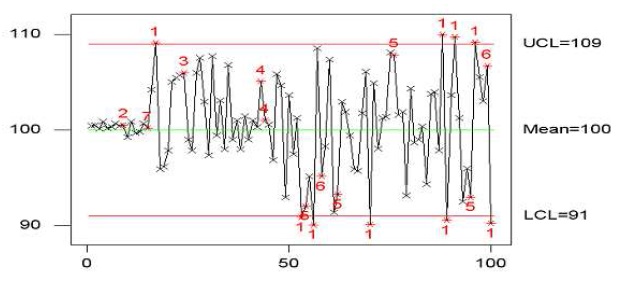
If there is change in productive system, sampling data may disobey normal distribution more. Control chart rule is sensing and informs that data escapes in normal distribution.
When there is problem with control chart, it is 2 occasion as following.
① Even problem is, but does not inform change. In this case, Upper control line or lower control line is bigger calculated than actual state of process. In case, damage is big.
② Even practical problem does not exist, then warning message of run rule give sign. Probe problem and repeat analysis though there is no practical problem, fair time and expense are cost for this, Usually, suffer this occasion.
2.2.1 control chart error
There is 2 error of process with control chart. It is accidental error which is changed deviation and abnormal error which is changed means. Total error of process is sum of abnormal error and accidental error.
If process is stable, then average of process is change in near in target value. If Control chart warn process change, then worker should take action to control chart.
2.2.1.1. Abnormal error(Systernatic error)
Abnormal error is change of mean value. Mean value change is problem connected with accuracy. That is, it sign mean value is changing. Cause of abnormal error is change of material, lot, worker, gage measure method, measuring instrument, etc.
2.2.1.2 AccIdental error(random error)
Accidental error displays size of product scattering(standard deviation). If process is administered normally, then suppose that accidental error accomplishes normal distribution. Process can’t be fixed all conditions, for example, non-homogeneous of material, worn of machine, outside temperature etc. which cause can’t be fixed, some accidental error can’t avoid. Accidental error is changed to between upper and lower side of center-line of control chart. Control chart searches for abnormal error and accidental error. Error of such two types is produced by different cause.