Agriculture policy is an important, albeit contentious, political economic issue that has been at the center of trade wars, legal disputes, and a stalling of the current World Trade Organization (WTO) trade round. Unlike trade negotiations in non-agricultural industries, advanced agriculture producers such as members of the European Union and the United States are quite reluctant to liberalize their agriculture sectors. In this articlewe explain the dynamics of agricultural protection in the United States by focusing on the role of partisan politics. We argue that major shifts in the size of U.S. farm support benefits have been shaped by partisan battles over the food stamp program ever since this program’s inclusion in the 1971 farm bill. While Democratic Congresses try to increase the size of the food stamp program, Republican Congresses try to shrink it. In the case of divided government, these partisan interventions generate a trade-off between changes in the size of the food stamp program and changes in the size of farm support benefits. This tradeoff becomes necessary due to spending constraints and institutional gridlock. We provide empirical evidence in support of this claim from county-level data on farm payments and food stamp benefits and aggregate changes in both programs between 1973 and 2002.
INSTITUTIONS, FOOD STAMPS, AND U.S. AGRICULTURE POLICY
U.S. agricultural protection originated in 1938 with the Agricultural Adjustment Act, and subsequent Congresses strengthened the commitment to agricultural protection through the Commodity Credit Corporation Charter Act of 1948 and the Agricultural Act of 1949 (Hansen 1991). Congress has reauthorized these laws roughly every fifth year through multi-year farm bills, which are the key legislative actions that fundamentally shape agricultural protection in the United States.6
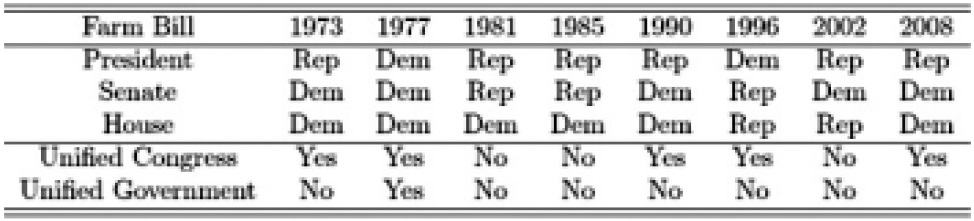
Between 1973 and 2008, there have been eight omnibus farm bills. Table 1 summarizes the partisan composition of the eight Congresses that authorized these bills. Despite the relatively brief time period of 35 years, there is significant variation in congressional partisan composition: five periods of unified party control and three periods of divided control. Four of these unified periods came under Democratic control; one came under Republican control (1996). In one instance, leading up to the 1977 bill, Democrats controlled Congress and the presidency. There has been no farm bill reauthorized by a unified Republican government.7
[Table 1.] Seven Omnibus Farm Bills and Partisan Control of Congress and Presidency
Seven Omnibus Farm Bills and Partisan Control of Congress and Presidency
>
THE FOOD STAMP-FARM SUBSIDY COALITION
The legislative origin of the food stamp program is the Food Stamp Act of 1964, in which Congress turned a temporary three-year pilot program into a permanent entitlement program.8 In need of reauthorization allies, food stamp program supporters, largely urban Democrats, traded votes with rural Democrats who favored farm support. The common party membership shared by both factions was not enough to maintain unity over time, however, as there was an “increasing sense among the parties to the trade that the other side was not keeping its part of the bargain” (Ferejohn 1986, 237). As an institutional solution to the unstable vote trade, House Agriculture Chairman William Poage added food stamps to the farm bill so that the two sides no longer held each other hostage. This linkage of farm support with food stamps has provided a powerful coalition for both programs.
We highlight one important lingering effect that the inclusion of the food stamp program in farm bills has had on the politics of agricultural policy in the United States. Lumping farm programs with food stamps created a trade-off between changes in the size of the two programs when Congress cannot increase the total size of a farm bill. The trade-off has become more pronounced over time since the size of the food stamp program overtook farm payments as a percentage of the farm bill’s total costs in the 1990s. Now, the cost of the food stamp program alone comprises 66% of the farm bill spending total ($178 billion out of $270 billion, 2002-2008) (Chite 2008). In order to curtail the size of the food stamp program, Congress instituted a legal budget constraint on the size of farm bills several times: the Gramm-Rudman-Hollings Balanced Budget and Emergency Deficit Control Act of 1985, the Budget and Emergency Deficit Control Reaffirmation Act of 1987, the Budget Enforcement Act of 1990, and the Balanced Budget Act of 1997. We will show that even in the absence of legal constraint, the partisan composition of Congress and the presidency can serve as an institutional constraint on the growth of the farm bill budget.
>
PARTISAN COMPOSITION OF GOVERNMENT AND THE TRADE-OFF
It is straightforward to show, using a simple one-dimensional spatial model, that the simultaneous expansion of both programs would occur only under unified government. Suppose the policymaking process over the size of the farm bill budget as a spatial competition over a unidimensional space, as in Kiewiet and McCubbins (1988) and Krehbiel (1996). The left end of the spectrum indicates the maximum spending on a farm bill and the right end indicates minimum farm bill spending.9 In order for the size of the two programs to change in the same direction, all pivotal players should be located either to the left (indicating a preference for the expansion of the two programs) or to the right of the status quo. This could happen only in the unified party control of government.10
On the other hand, it is difficult for Congress to change the total size of farm bill spendings in the presence of an opposition president. However, Congress can still make preferred changes in the relative size of the two program spendings by decreasing the size of one program at the expense of the other if one party holds majority positions in both chambers. In other words, bicameral majority in Congress is a necessary condition for significant changes in the size of the two program spendings. We explain why this is the case in the following.
First, the U.S. Congress is a majoritarian institution. The majority party wields disproportional power over the minority. Members of the majority party chair all committees, and the party’s leadership influences committee assignments. While congressional committees have important institutional powers such as gatekeeping and proposal and veto rights, these powers are significantly limited by the majority leadership of the parent chamber (Sinclair 1983; Cox and McCubbins 1993; Sinclair 1995; Deering and Smith 1997).
Second, two chambers of the U.S. Congress share power in the legislative process of farm bills. Farm bills are highly complex pieces of legislation that often result in significant differences between House and Senate versions. Differences between two versions, therefore, have been adjusted in conference committees. Congressional scholars observe that conferees are picked by majority leaders. As a result, preferences of the conferees are often highly aligned with those of party leaders (Smith 1988; McQuillan and Ortega 1992; Deering and Smith 1997; Vander Wielen 2010).
Moreover, the opportunity cost of rejecting the conference report is usually high because conference is the only way to resolve differences between each chamber’s farm bills before adjournment. Once the conference committee reaches an agreement, the conference report must pass by a simple up-or-down vote in both houses.11 Rejecting a farm bill conference report is particularly risky because the reversion points are commodity programs put forward in the 1938 and 1949 laws, programs that would be prohibitively expensive.
Interestingly, many of the partisan battles over farm bills have been waged over food stamp legislation more often than farm support programs. As the budget size of food stamp programs grew bigger and bigger, Republicans made food stamp programs as partisan flashpoints in their ideological fight for government budget cuts. And in these partisan battles, the unified control of Congress (or government) has indeed been instrumental in increasing or restricting access to the food stamp program. For example, in the Food Stamp Act of 1977, which was passed as a part of the 1977 farm bill by a unified Democratic government, the Democratic Congress eliminated the program’s purchase requirement, which had previously served as a major barrier to participation.12 Republicans, wanting to limit the food stamp program to only the neediest recipients, opposed the elimination of the purchase requirement (King 2000).
Another important partisan battle over the food stamp program surrounded the 1996 farm bill and featured a bicameral Republican majority facing Democratic President Bill Clinton. The Republican Congress attempted to remove recipients’ entitlements to the food stamp program, but succeeded only in decreasing the size of the program in the face of a presidential veto threat, which we will discuss in detail later in this article.13
If we combine the foregoing discussions about the conditions for changes of farm bill spending at the national level, which we call
1For comparative studies of agriculture protection, see Anderson and Hayami (1986), Gardner (1987), Thies (1998), Gawande and Hoekman (2006), Park and Jensen (2007), Thies and Porche (2007), and Daugbjerg and Swinbank (2012). 2For an in-depth investigation on the role of the United States in liberalizing agricultural markets in the EU and Japan, see Davis (2003). 3Unified Congress indicates a Congress in which one party holds the majority in both chambers. Note that researchers often use other terms such as bicameral majority or unified Congress to indicate the unified party control of Congress. 4Distributive views of congressional organizations exemplify this traditional perspective focusing on institutional foundations of committee power (Shepsle and Weingast 1987). While the informational theory of congressional organizations proposed by Krehbiel (1991) generally opposes the explanation of congressional organizations based on distributive gains, Krehbiel also acknowledges “the pursuit of distributive benefits surely plays a role in agricultural policy-making … and almost no one disputes that commodity-based subcommittees are organized attempts to facilitate gains from trade” (Krehbiel 1991, 11). 5The food stamp program is now known as Supplemental Nutrition Assistance Program (SNAP). SNAP includes a variety of federal food assistance programs such as the National School Lunch Program, the Community Food Project grants, and the Farmers Market Promotion Program. In this article, we indicate the food stamp program to include other nutrition programs. Farm support programs include a variety of agricultural support programs, such as commodity support programs, but exclude nutrition programs, environmental aid, and rural development aid. 6Although Congress can change farm programs in the annual budget reconciliation, farm programs are complex pieces of legislation that consume a large amount of legislators’ time and effort. Therefore, opportunities to change the main structure of farm programs are largely limited to the periodic omnibus farm bills. In that sense, the politics surrounding these periodic bills is a microcosm of the broader farm politics of the United States. 7Vermont Senator Jim Jeffords switched his party status from Republican to Independent in 2001, caucusing with the Democrats on procedural matters, and thus giving them control of the Senate. While Republicans regained control of the Senate in 2002, in the interim, Congress re-authorized the 2002 farm bill. 8Entitlement programs are mandatory programs in which eligible people have legal rights to receive benefits regardless of the budget condition. 9The game proceeds in the same way as in Krehbiel (1996). Congress first proposes a new spending proposal for the entire farm bill. The House passes the proposal by a simple majority rule, but a Senate minority can block the bill using a filibuster. To overcome a filibuster (invoke cloture), the passage of the proposal requires 3/5 majority in the Senate. After the passage of the proposal in both chambers, the president can veto the bill. Otherwise, the new bill is implemented and replaces the status quo. In case of a presidential veto, Congress should gather 2/3 majority to override it. If so, the bill is implemented. If Congress fails to gather the 2/3 votes, the proposal fails and the status quo rules. The reversion point is assumed to be current farm programs as Congress can use a continuing resolution when it fails to write a new farm bill. 10A detailed discussion of the game using examples of farm bill Congresses is available in the appendix. 11Technically, conference reports can be filibustered in the Senate. 12The Food Stamp Act of 1964 required that all the “recipients purchase their food stamps, paying an amount commensurate with their normal expenditures for food and receiving an amount of food stamps representing an opportunity more nearly to obtain a low-cost nutritionally adequate diet” (Department of Agriculture 2013). 13See King (2000) for an excellent historical description of the politics of food stamp programs in the United States.
We collect county-level farm payments data and food stamp benefits data from the Regional Economic Information System (REIS) maintained by the Bureau of Economic Analysis (Bureau of Economic Analysis, Regional Economic Accounts). The data sets record the distribution of farm payments and food stamp program benefits based on the physical addresses of payment recipients, not the locations of their farms. The data reflect government payments through farm commodity programs, export programs, conservation programs, and crop insurance programs. For temporal comparisons, analyzing payments by county is a better strategy than using congressional districts, which change much more frequently through partisan redistricting and population migration.
We use geographic correspondence information provided by MABLE/Geocorr90 Geographic Correspondence Engine to find what portion of counties is located within a congressional district. The MABLE/Geocorr90 Geographic Correspondence Engine computes allocation factors of all counties for respective congressional districts using geographical information such as the size of the land area and the number of residents within the boundary. The MABLE/Geocorr geographic correspondence engine generates files showing the relationships between a wide variety of geographic coverages for the United States (MABLE/ Geocorr 1997).
To find associations between party control and the farm bill’s two major pieces requires us to devise a research design that identifies systematic departures from “normal” payments, or the payments that counties would receive independent of which party controls Congress. We employ two methods to control for “normal” payments. First, we difference the dependent variable using previous payment data at the county level. A county’s previous farm payments are computed by averaging payments received over the three years prior to the farm bill year.14 Current farm payments are computed by averaging payments received over the two years after the bill’s passage. Since payments during the farm bill year are likely to be affected both by the previous and the newly enacted bills, they are not included in either calculation in order to avoid measurement error.
Two-year averages are used to minimize measurement error caused by o-farm bill year legislation. For example, Congress often passes emergency legislation or supplementary legislation providing additional income support when there are unexpected events such as natural disasters or commodity price changes. This type of legislation is less directly related to party control of Congress at the time of the farm bill’s passage. In contrast, the food stamp program has been reauthorized along with farm subsidies in every omnibus farm bill since 1973. In addition, the few pieces of supplementary legislation that have been passed have not impacted the specifics of this program during off-farm bill years. Thus, each county’s average food stamp benefits are computed by taking the average of the benefits over the entire farm bill period.
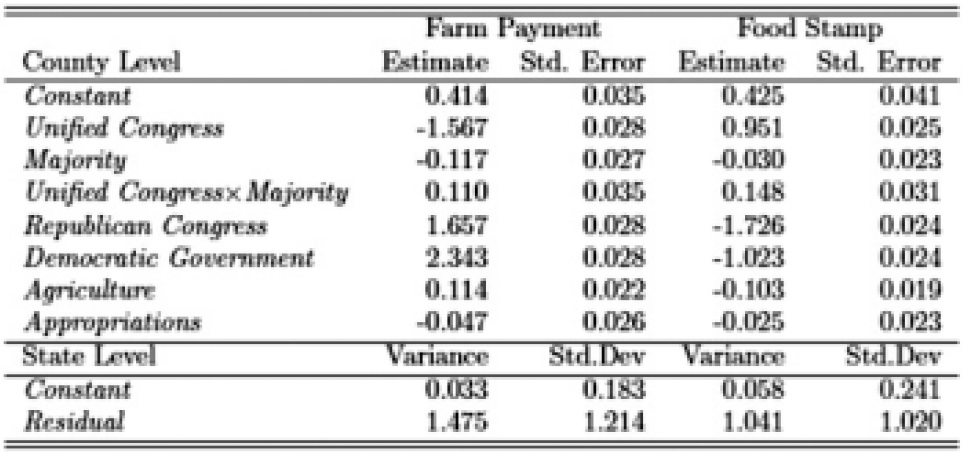
The key explanatory variables are two dummy variables indicating majority party membership in the House of Representatives (Majority) and unified party control of Congress (unified Congress). To see the interaction effect of partisanship with party control of Congress, we include a dummy variable for the Republican Congress, which is coded as 1 when the Republican party holds majority in both chambers and 0 otherwise. Variables for membership on the two House committees more relevant to agriculture issues, Agriculture and Appropriations, are also included. Counties represented by members of these two committees are expected to be different from other counties not represented in terms of farm payment and food stamp benefit changes. For congressional committee membership, we combine two sources; the first comes from Garrison Nelson (n.d.), the second from Charles Stewart and Jonathan Woon (2009).
We use ordinary least squares (OLS) for the pooled analysis of the food stamp benefits and farm payments.15 We include state fixed effects to control for timeconstant state-specific factors such as the overrepresentation of small farm states in the Senate.
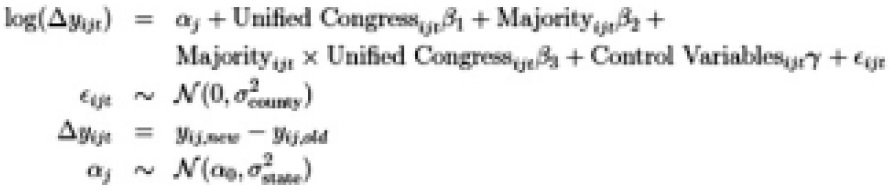
The dependent variables are payment data, while the explanatory variables are mostly dummy variables. Thus, we log transformed the dependent variables for a better fit. The resulting statistical model can be written as follows:


where
14Using the two-year average does not change the substantive conclusion of the results. 15Although our dependent variables are compositional data, OLS produces consistent estimates as generalized least squares for the seemingly unrelated regression model because each of our regression models has identical covariates (See Greene 2000, 616-617).
>
AGGRAGATE CHANGES IN PROGRAM BENEFITS
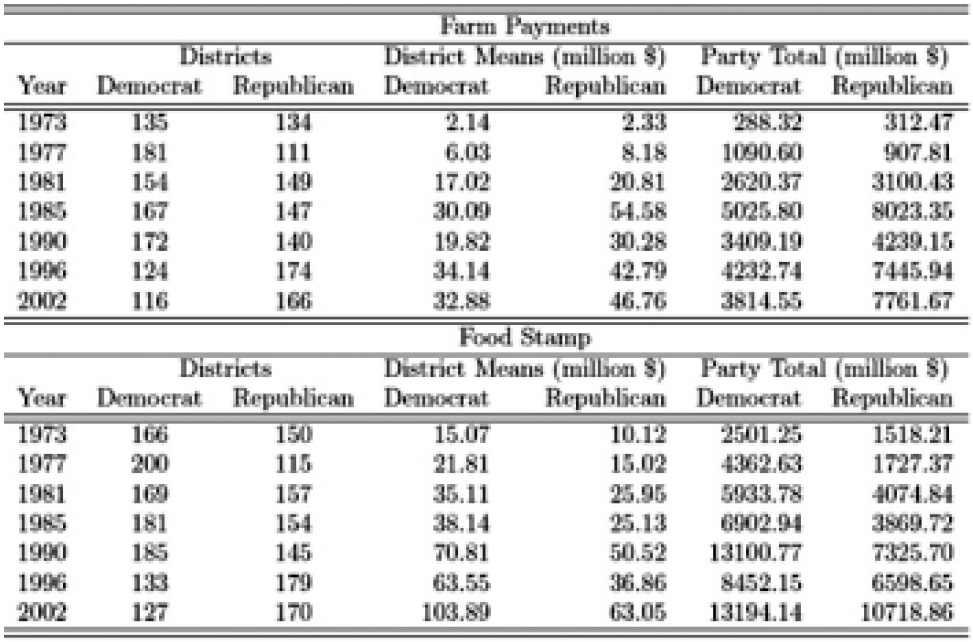
Table 2 reports the partisan distributions of farm payments and food stamp benefits between 1973 and 2002. Columns 2 and 3 report the number of congressional districts receiving farm bill benefits of more than $5,000. Columns 4 and 5 report district means, while columns 6 and 7 show the total benefits received by districts from each party (not including counties receiving less than $5,000).
[Table 2.] Distribution of Farm Payments and Food Stamp Benefits by Party

Distribution of Farm Payments and Food Stamp Benefits by Party
As farm payments are reported at the county level, we compute the amount of farm payments owing to Democratic districts by summing county-level payments at the district level. Let be the total number of Democratic districts receiving farm payments over $5,000 and be the number of payment-receiving counties at district i. Then, the total amount of payment going to the Democratic Party is computed as follows:

Food stamp benefits are computed in the same way as farm payments.
Two clear patterns arise from the analysis. First, while farm support programs heavily benefited Democratic districts in the 1970s, the amount of farm payments going to Republican districts have been larger than that going to Democratic districts since the 1980s. In the 1996 and 2002 farm bills, Republicans received larger farm payments than Democrats both in terms of the number of paymentreceiving districts (the second and third columns in Table 2) and in terms of the total amount of payments (the sixth and seventh columns in Table 2).
Second, Democrats are more dependent upon food stamp benefits than Republicans over time. In the 1970s and 1980s, the partisan difference in the size of food stamp program benefits was small. However, the average amount of food stamp benefits going to a Democratic district has become much larger than that going to a Republican district since the 1990s. The total food stamp benefits received by Democratic districts are also much larger than those received by Republican districts.16
Considering this asymmetric distribution of farm bill benefits between the two parties, it is reasonable to expect that party leaders would have a strong incentive to change the relative size of the two programs in favor of their party’s districts.
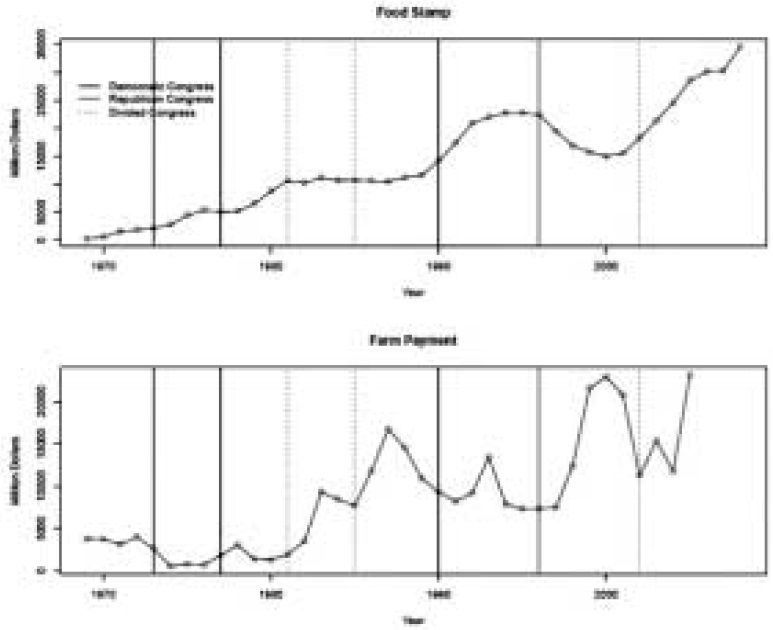
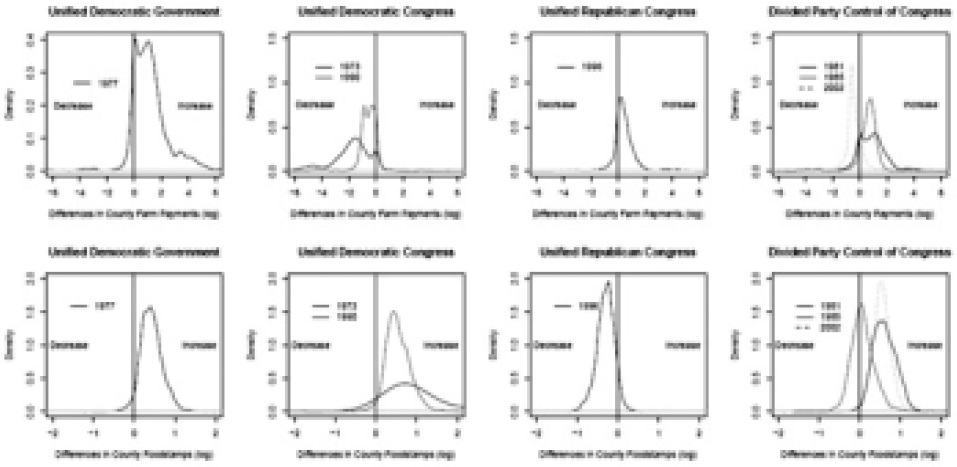
Historical changes in the size of program benefits provide evidence of these partisan tendencies. The top panel in Figure 1 shows aggregate changes in food stamp benefits since 1969, while the bottom panel shows aggregate changes in farm payments over the same period. The dark vertical lines indicate unified party control of Congress by Democrats and the light vertical lines at 1996 indicate unified Republican control of Congress. The dotted lines indicate divided party control of Congress. It is clearly shown that the unified Democratic Congresses were important moments for the growth of the food stamp program over time; in the three historical cases where Democrats controlled both houses of Congress (1973, 1977, and 1990), food stamp benefits increased. In contrast, unified Republican control of Congress in the 1996 farm bill led to a significant fall in food stamp benefits until 2000. However, the changes in the size of farm payments shown in the bottom panel of Figure 1 do not reveal any clear partisan pattern. One notable pattern is the dramatic increase in farm payments that came three years after the 1996 farm bill.17
Figure 2 shows the density plots of net aggregate changes across four different types of partisan government. First, the two plots in the first column show that the unified Democratic government that passed the 1977 farm bill dramatically increased both farm payments and food stamp benefits. As we predicted from our theory, these simultaneous increases in both programs were possible because of the presence of a co-partisan president. The second column clearly demonstrates that the two unified Democratic Congresses in 1973 and 1990 increased food stamp program benefits while decreasing farm payments. Faced with a Republican president’s veto threat, Democratic Congresses could not expand both programs’ benefits. Therefore, they chose to increase only the food stamp program, which disproportionately favored districts represented by incumbent Democrats. To put it differently, these cutbacks in farm payments were a tradeoff that Democratic Congresses had to make in order to expand the food stamp program under Republican presidents. The third column displays the opposite partisan pattern.
The Republican Congress shrunk the food stamp program while handing out more farm payments. Again, the increase in farm payments was the price Republicans paid to pass a highly partisan farm bill that slashed food stamps. Finally, divided party control of Congress—shown in the fourth column of Figure 2—does not produce any consistent pattern in the distribution of farm payments and food stamp benefits.
>
POOLED REGRESSION ANALYSIS OF COUNTY-LEVEL BENEFITS
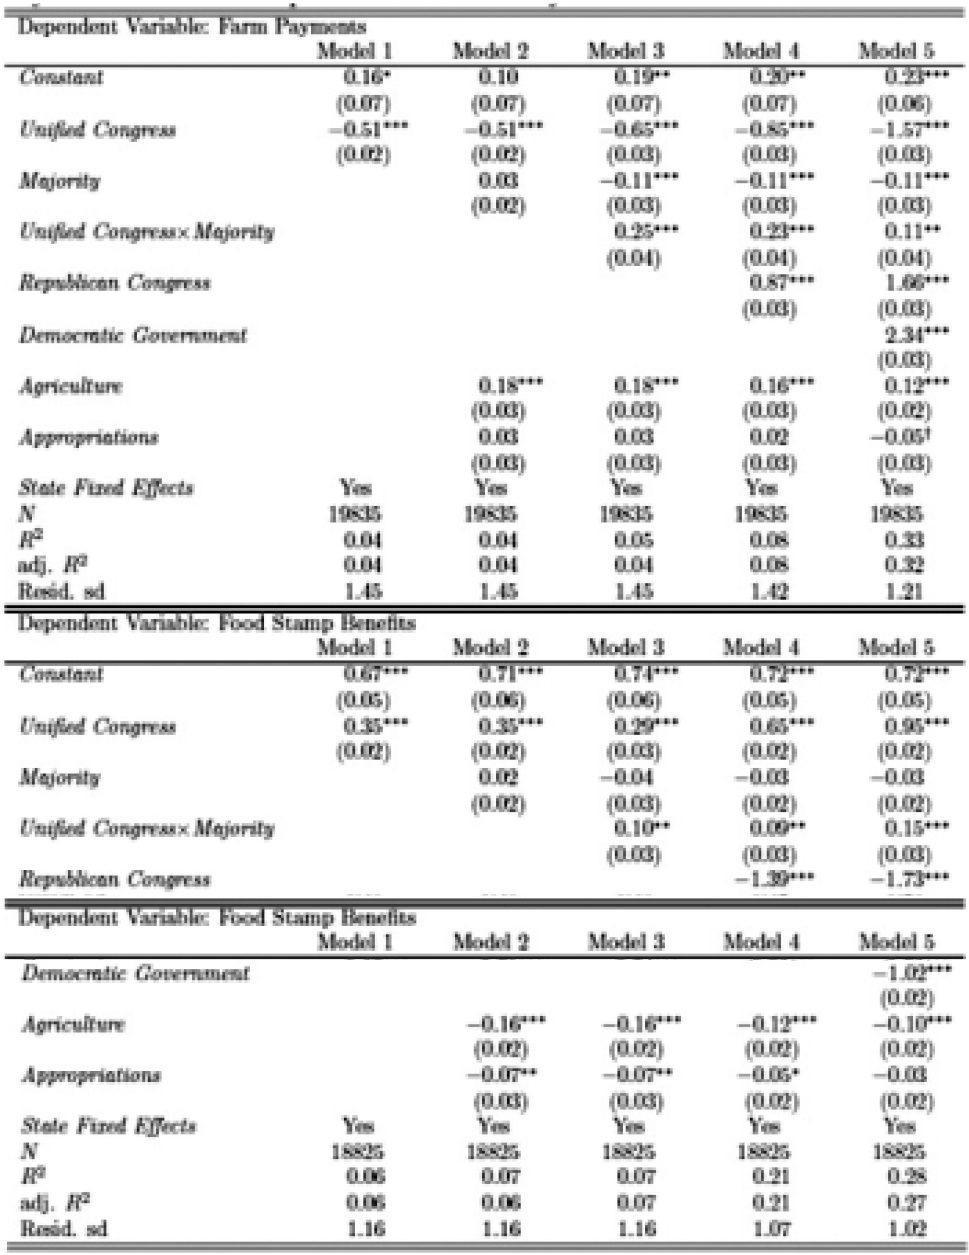
Table 3 summarizes the regression analysis of farm payments and food stamp benefits at the county level across seven omnibus farm bills. As we expected, the signs for the effect of unified party control of Congress (unified Congress) are reversed between farm payments and food stamp benefits. First, the effect of a unified Democratic Congress on the size of farm support programs is always negative. If we control for the positive effect of a Republican Congress (Model 4 and Model 5 in the top panel of Table 3), Democratic Congresses without a Democratic president tend to decrease farm payments across counties while the Republican Congress increases farm payments.

Pooled OLS Analysis of Party Control of Congress and the Distribution of Farm Payments and Food Stamp Benefits at the County Level
In contrast, the effect of the unified Congress variable is consistently positive with regard to food stamp benefits, as shown in the bottom panel of Table 3. The Republican Congress decreased food stamp benefits quite dramatically while the Democratic Congresses always increased them. Note that Democrats received more from the increases when they controlled Congress. Reading from the bottom of Model 5, counties represented by Democrats received 16% more than counties represented by Republicans when the Democratic Party controlled both houses of Congress. As the dependent variable is log transformed, coefficients should be exponentiated to compute the effect size.
For example, the coefficient for the benefits to House Democrats is 0.15. Then, being represented by a House Democrat increases benefits by 16% as exp(0:15) = 1:16. The Republican Congress that passed the 1996 farm bill made significant cuts to food stamp benefits in all counties. On average, it decreased food stamp benefits to Democratic and Republican counties by 54% and 49%, respectively.
Another important finding from Table 3 is the effect of unified Democratic government. The 1977 farm bill increased farm payments by as much as 116% for all counties, while cutting food stamp benefits by 7% for Republican counties and increasing them by 5% to 8% for Democratic counties. On a more counterintuitive note, Agriculture Committee membership had opposite effects for the two dependent variables. Counties represented by Agriculture Committee members received 12% to 19% additional increases in farm payments, but 10% to 15% decreases in food stamp benefits. We believe that these reductions in food stamp benefits within Agriculture Committee members’ districts are likely to be correlated with population declines in rural areas.
>
ALTERNATIVE MODEL SPECIFICATIONS
To check the robustness of the findings from the fixed-effects method, we also fit a varying intercept model using state as a second level, as recommended by Gelman and Hill (2007). The varying intercept model allows the intercept to randomly vary across states to account for unobserved heterogeneity within each state. This is identical to the random-effects model. The model can be shown as follows:

where
Table 4 shows the results of the random intercept model. The results are consistent with those from the fixed-effect method. Unified Congress, which indicates the unified Democratic control of Congress, is statistically significant and has opposite signs in two programs. Republican Congress is also statistically significant and has opposite signs in two programs. These findings imply that the unified party control of Congress has opposite effects on the food stamp benefits and farm subsidies. Most importantly, Unified Congress and Republican Congress point opposite directions in each program, implying that the effects of Republican Congress is opposite to those of Democratic Congress as predicted by our partisan story.

Varying Intercept Model for Party Control of Congress and the Distributions of Farm Payments and Food Stamp Benefits
We also analyzed the final passage votes on farm bills. The associations between members’ party affiliations and vote choices are statistically significant at the 95% confidence level in five farm bills reauthorized under unified Congresses. However, vote choices in final passage votes are affected by many factors and effect sizes vary substantially across the five cases of unified Congresses. Thus, we do not view these results as strong and convincing evidence in favor of our theory, though they are suggestive.18
Overall, the results from various quantitative methods are consistent with our partisan story regarding changes in the size of food stamp program and farm support programs in response to the party composition of Congress and the presidency.
16Explaining the causes of the partisan switches is beyond the scope of this study. We conjecture that these partisan switches are closely related with the partisan realignment started by the Civil Rights and Voting Rights Acts (Sundquist 1983; Miller and Schofield 2003). Observers of American politics commonly note that Southern agrarian states, which were core supporters of the New Deal coalition, have since moved toward the Republican Party (Wattenberg 1991; Nadeau and Stanley 1993; Miller and Schofield 2003; McCarty, Poole and Rosenthal 2006; Miller and Schofield 2008; Jacobson 2010). 17The cause of this dramatic increase will be explained in our case study of the 1996 farm bill. 18The results of the roll call data analysis are reported in the appendix.
In this section, we examine our partisan story by taking a close look at the 1996 farm bill. The 1996 farm bill is an interesting case to look at because it was the first case of unified Republican control of Congress at the time of a farm bill authorization since 1973. Thus, the 1996 farm bill provides a test of whether the Republican bicameral majority generated policy outcomes consistent with our partisan theory.
For the first time since the New Deal, Republican congressional leaders in the 104th Congress had a chance to structure the farm bill in a partisan manner that benefited their members. House Speaker Newt Gingrich promised to return market forces to the “East German socialist” farm programs and to “reform” the food stamp program (
Strong party discipline and a homogeneous membership—combined with the procedural advantages of a bicameral majority—made it possible for the Republican Congress to modify the food stamp program and farm programs significantly. Among some of the changes Congress made were eliminating most legal immigrants’ eligibility for food stamps, placing a time limit on food stamp receipt, reducing the maximum allotments of food stamps, decoupling government farm payments from market price changes, ending acreage reduction programs and planting restrictions, and phasing out the dairy price support programs (Gundersen, Leblanc and Kuhn 1999; Becker 2002).
Food stamps, however, proved to be a wedge issue dividing Republican leaders who wanted to reduce benefits from rank-and-file Republicans representing poor districts. To broker a compromise, Republican leaders’ attempted to transform the food stamp program into state block grants, which would end the entitlement status of the Aid to Families with Dependent Children. However, a bipartisan coalition defeated this measure in committee and on the floors of both houses.19 Then subsequent Congresses also controlled by Republicans restored many of the cuts and changes to food stamp benefits. For example, on May 22, 1998, 98 Republicans joined 190 Democrats to defeat the attempt of the Republican leadership to amend the conference agreement on some legal immigrants’ eligibility to receive food stamps (
Republican farm program “reforms” were similarly modified once agricultural prices started to fall the following year. Since the 1996 farm bill had severed the linkage between farm payments and changes in market prices, farmers’ incomes fell dramatically when commodity prices plunged between 1997 and 1999. Democratic legislators did not hesitate to blame the fall in prices on the Republican reforms.20 In response, the Republican Congress restored most cuts to the 1996 farm bill through supplementary legislation passed during the 105th and 106th Congresses.21 Thus, the landmark reforms of the 1996 farm bill quickly evaporated in favor of a return to the status quo.
The 1996 farm bill illustrates key elements of our theory. As we predicted, the Republican ideological “reform” of the food stamp and farm programs was possible largely because Republicans controlled both houses. Republican leaders used their powers in the House and Senate Agriculture Committees, the House Rules Committee, and the farm bill conference committee to structure the bill according to principles sketched out in the Contract With America. As we explained, Republican leaders’—especially House Speaker Newt Gingrich’s—influence over committee chairs and the legislative agenda served as the main vehicle for implementing the Party’s agenda into the bill. However, in the presence of veto threats by President Clinton over welfare reforms and budget issues, the Republican leadership had to compromise with moderate Republicans and Democrats.
The Republican leadership’s control of the process allowed for some cuts in food stamp benefits. Yet, despite the public rhetoric, there was a dramatic increase in allocations of farm payments. These changes had the effect of reallocating more federal dollars to Republican controlled districts, made possible by the cooptation of moderate Democrats in the face of a threatened presidential veto.
19For a detailed description of the compromise, see King (1999). According to King (1999), “The House Agriculture Committee voted 5-37 against transforming food stamps into a block grant. A block grant amendment offered on the House floor failed 114-316, with Republicans divided almost evenly and Democrats opposed almost unanimously. The Senate Agriculture Committee similarly refused the block grant option, and a substitute motion on the Senate floor failed 36-64, with one-third of Republicans joining the Democrats by voting against it” (King 1999, 370). 20Here we requote the Democratic Party platform in the 1996 presidential election: “The Republican Freedom to Farm Act has resulted in years of low prices and necessitated billion dollar bailouts. It is misguided and must be changed.” 21For example, the Emergency Farm Financial Relief Act of 1998 (P.L. 105-228) released $5.5 billion to farmers on August 12, 1998. Then, the Omnibus Consolidated and Emergency Appropriations Act (P.L. 105-277) provided $5.9 billion on October 21, 1998; the Agriculture Appropriations Act (P.L. 106-178) on October 22, 1999, provided $8.7 billion; the Agricultural Risk Protection Act of 2000 (P.L. 106-224) on June 20 provided $7.1 billion in emergency farm assistance; the Agriculture Appropriations Act (P.L. 106-387) on October 28, 2000, released another $3.5 billion; and the Agricultural Economic Assistance Act (P.L. 107-125) on August 13, 2001, provided a final $5.5 billion in emergency farm assistance.
In this article, we showed how the partisan composition of government has affected the distribution of farm bill benefits in the United States. We argued the inclusion of the food stamp program in omnibus farm bills beginning in the early 1970s as an important factor generating a trade-off between expansion of farm support programs and that of food stamp benefits. This trade-off becomes salient when Congress is unable to increase the total budget of a farm bill. We argued that unified party control of government (both Congress and the presidency) is necessary for the simultaneous expansion of both programs, given the multiple veto points in the farm bill process. In cases of divided government, we predicted that the presence of a bicameral majority is necessary for the expansion of one program’s benefits at the expense of the other.
We acknowledge that it is difficult to find conclusive quantitative evidence for our institutional claims due to the short history of modern omnibus farm bills. However, we found a variety of empirical evidence in favor of our claims by analyzing temporal changes in aggregate program benefits and finding partisan patterns in the distribution of program benefits at the county level.
First, changes in program benefits at the aggregate level are largely consistent with our predictions; the unified Democratic government in 1977 dramatically increased both farm payments and food stamp benefits, while Democratic Congresses facing Republican presidents in 1973 and 1990 were able to expand food stamp benefits only at the expense of farm support benefits. In contrast, the Republican Congress at the time of the 1996 farm bill shrunk the food stamp program while handing out more farm payments. A close examination of the events that followed the 1996 farm bill—actions undertaken by Republican Congresses—furthersupported our theoretical conjecture.
Second, this partisan story is consistent with general patterns in the distribution of county-level program benefits between 1973 and 2002; unified Democratic Congresses tended to decrease the size of farm payments and increase food stamp program benefits, while the Republican Congress of 1996 increased farm payments and decreased food stamp benefits.
A decrease in farm support benefits under a unified Democratic Congress facing a Republican president is counterintuitive to political observers who would consider the Democratic Party to be pro-farm support and the Republican Party to be anti-farm support. Taking a recent example, in the 2008 presidential election, Republican presidential candidate John McCain publicly opposed the 2008 farm bill being prepared in Congress while Democratic presidential candidate Barack Obama favored it.22 We believe that our theory—by focusing on the interplay between the bicameral Congress, the president, and the interdependent nature of food stamp and farm support policymaking—provides a consistent explanation of historical changes in U.S. agriculture policy. Agriculture policy in the United States is certainly highly complex and has multidimensional aspects as Browne (1995) notes. However, we believe that partisanship is a central, though subtle, factor in U.S. agriculture policy, as it is with numerous other public policy issues.
What we found from the U.S. case has broader implications to comparative study of agriculture policy. First, the United States is a hard case to test a partisan theory of agricultural protection in that the United States has weak party system in a comparative perspective (McGillivray 1997) and a relatively low level of agricultural protection (Park and Jensen 2007). We believe that the influence of party is omnipresent in everyday legislative politics, regardless of the form of party control in Congress. We may not always observe the influence of party in policy outcomes since the logic of political competition pits the effect of one party against the effect of the other party, the net effect of which is often transient, temporary, and minuscule. What we demonstrate in this study is that unified party control of both houses in U.S. Congress is a condition under which the countervailing force of minority parties or opposing parties’ Presidents is significantly weakened in the protection of agriculture.
Second, the key findings of this study shed new light on the divided government hypothesis in the literature of trade politics. We show that when trade issues remain in the purview of Congress, party control of Congress, not just the form of government, determines conditions under which trade policy becomes a partisan issue.
Last, an important void in comparative studies of agricultural protection is the lack of theory that explains dynamics in agricultural protection within a country. The knowledge on country’s factor endowment, agricultural production technology, national income, and political institutions, all of which prove to be important in understanding the cross-national variation in the protection of agriculture, does not necessarily enable us to predict the politics of agricultural protection in a country in the short or medium term.
22During the 2008 presidential campaign, McCain said, “If I [McCain] am elected president, I [McCain] will seek an end to all agricultural tariffs, and to all farm subsidies that are not based on clear need. I [McCain] will veto any bill containing special-interest favors and corporate welfare in any form” (Reuters 2008). In a statement on the passage of the farm bill in the Senate, “I [Obama] applaud the Senate’s passage today of the farm bill, which will provide America’s hard-working farmers and ranchers with more support and more predictability”(USA Today 2008).