Controlling for the effects of potentially confounding variables is standard practice in scientific investigation. From a language research perspective, such variables can include word length, phonotactic probability, neighbourhood frequency, familiarity and concreteness (e.g. Arciuli & Slowiaczek, 2007; Pulvermüller, Lutzenberger & Preissl, 1999; Cortese & Fugett, 2004; D’Angiulli, 2004). While physical attributes such as word length are easily measured and accounted for, more cognitive features such as familiarity and concreteness are not; instead, degrees of difference are controlled for through the use of normative data values (e.g. Ogawa & Inamura, 1974; Liu, Shu & Li, 2007). As many language researchers have neither the time nor the finances to gather such normative data from a prospective population, there appears a tendency to rely on published databases to obtain normative values. For English language researchers, such databases include CELEX (Baayen, Piepenbrock, & Gulikers, 1995), the British National Corpus (BNC; Aston & Burnard, 1998), Subtlex (Brysbaert & New, 2009), the Corpus of Contemporary American English (COCA; Davies, 2009), and the Medical Research Council Corpus (MRC; Coltheart, 1981), to name but a few.
This reliance on normative database values appears especially commonplace (e.g., Gonsalves & Paller, 2000; Mattys & Samuel, 2000; Helenius, Parviainen, Paetau & Salmelin, 2009); however, there remain small but nagging doubts over this practice. There are a variety of reasons for this. Firstly, a number of these databases derive normative values that reflect frequency of word appearance in printed media such as newspapers and magazines and not spoken language usage. Although the exact nature of the relationship between speech and literacy remains at the heart of an intense debate (for example, see Hauser, Chomsky & Fitch, 2002), there is a growing body of empirical evidence (for example, see Schlagger & McCandliss, 2007; Preston et al., 2010) along with reasonable theoretical argument (for example, see Olsen, 1998) to suggest that despite speech and literacy being closely related, there are fundamental differences between these processes. Until both the differences and similarities between speech and literacy can be more clearly elucidated, using normative values derived from printed media may be appropriate for
Although there are a number of on-going projects attempting to provide spoken language normative values, these too are problematic. For example, the BNC offers spoken word frequency values for 10 million English language words. To obtain these values, the casual speech of 127 participants was recorded over a three day period and frequency values assigned according to the production of individual words. While these normative values may thus accurately capture spoken word production frequencies, humans are able to comprehend substantially greater numbers of words than they produce in casual conversation (Bishop & Snowling, 2004). Furthermore, as demonstrated by the obvious differences in the physical manifestations of Wernicke’s aphasia and Broca’s aphasia, there is direct physical evidence that comprehension and production, like speech and literacy, are related although different processes (Zurif, Swinney, Prather, Solomon & Bushell, 1993). Allowing for this established difference between production and comprehension, the use of speech production frequency values sourced from the BNC for speech comprehension paradigms may not be appropriate.
Similarly, the Subtlex database sources its values from spoken language production, specifically subtitles associated with electronic media (e.g. film and television). Again, however, the values reflect production (frequency) rather than comprehension (familiarity) making such values a questionable choice for speech perception studies. There is also the issue of language
From a different perspective, spoken language use is known to evolve and change over time (Senghas & Coppolla, 2001). The word
Another possible criticism of normative database value use is that such norms were, and remain, primarily calculated using Northern hemisphere data, especially American and British English. Although Australia, New Zealand, the United States of America, Canada and Great Britain may all speak English, regional dialectal differences are obvious to even the casual observer. This is not simply confined to differences in pronunciation (e.g., /glαs/ versus /glæs/), but also to stress patterning (“oreGANno” versus “oREGano”) and lexical differences (e.g., the verb “to root” brings somewhat different mental imagery to mind depending on whether you are Australian or American). As a result, the use of normative database values derived from Northern hemisphere English language use may not be an accurate reflection of Australasian English language use, again making the use of such databases in Australasian language research potentially questionable.
Ease of access and use can also restrict a normative database’s practical applicability to language research. For example, the COCA provides free access to the top 5 000 most frequent words. Unfortunately, this includes function words (e.g. “the” and “a”), conjunctions (e.g. “and”), pronouns (e.g. “I), numerous adjectives and adverbs, as well as varying syllable lengths (from one to three). If (as was the case with two of the current authors), stimulus selection needed to be determined by syllable length and grammatical class type, the amount of free access data available through the COCA would be severely restricted. Given that there are no-charge alternatives, it is understandable that financially-challenged researchers, irrespective of their geographic location or English dialect, would seek normative values from free-to-use sources.
Finally, none of the databases currently available provide a complete range of normative data values for any linguistic feature other than frequency. Although the MRC does provide some normative data values for concreteness and imageability, the list is far from complete. Thus, like the COCA, this severely restricts the number of individual words which can be chosen for use as experimental stimuli which, in turn, impacts on the ability to randomly select stimulus words. As random selection lies at the heart of scientific experimentation, and is a basic assumption of most statistical analyses (e.g.,
The degree to which any paradigm is potentially confounded by such issues is very much paradigm-dependent; however, designs involving speech perception appear at greatest risk due to normative databases reflecting production rather than comprehension values. This is of particular concern when the experiment involves electroencephalography (EEG) or magnetoencephalography (MEG) where the relatively precise millisecond (ms) timing or locations of speech comprehension/perception neural networks are the subject of investigation. Take, for example, Pulvermüller et al. (1999) who used an event-related potential (ERP) EEG paradigm, to evidence a neural noun/verb double dissociation in less than 300 ms of word stimulus presentation. This dissociation, the authors suggested, involved processing of the two grammatical class types by two different functional neural networks; nouns, it was proposed, recruited occipital lobe areas, while verbs recruited parietal or motor cortex areas. In contrast, Longe et al. (2007, p. 1812) used functional magnetic resonance imaging (fMRI) to suggest that any differences in processing are due to “interactions between the morphological structure of nouns and verbs and the processing implications of this” and not grammatical class processing per se. In both cases, however, stimulus words were controlled using CELEX database frequency values and stimuli presented in visual form, so although the differences between the two apparently contradictory positions may ultimately be attributable to differences between technologies (EEG versus fMRI), it cannot be concluded, as both sets of authors did, that either set of results was due to spoken language processing; rather, by using stimulus words based on normative values related to literacy processing and by presenting those stimuli in visual form, their results may be literacy not speech related. At this point, any effects caused by differences in speech and literacy processing at a neural level remain unknown.
To this end, the purpose of the current study was to compare normative values obtained directly from a prospective experimental population with corresponding values sourced from a selection of existing databases. The 140 words contained within the corpus were originally chosen as experimental stimuli for an EEG investigation of grammatical class (nouns versus verbs) processing, following in the style of both Pulvermuller et al. (1999) and Longe et al. (2007). As a result, original inclusion/exclusion criteria were based firstly on grammatical class purity (that is, the word does not function as both a noun and a verb in contemporary usage), secondly on stress typicality (typical versus atypical) and finally on syllable number (<3). Given that a number of linguistic features have been suggested as influencing neural responses (for discussion, see Pulvermuller et al., 1999), normative data were firstly gathered on the features of familiarity/ frequency, concreteness and imageability from the prospective EEG experimental population. This was conducted via six, separate internet based surveys, three of which presented each stimulus word in written form, the remaining three in spoken form. Individual participant ratings for each stimulus word were then averaged across each sample to provide normative data values for each of the stimulus words. These average values were then compared with word form values sourced from three of the existing database sources; specifically CELEX, the BNC and the MRC. CELEX was chosen to follow in the design of Pulvermuller et al. (1999) and Longe et al. (2007). The BNC was chosen based on spoken word values displaying the best ecological validity during collection (that is, natural versus artificially natural speech). The MRC was chosen as it is the only database offering both concreteness and imageability normative values.
Based on the assumption that the use of these databases for sourcing normative linguistic feature values is acceptable practice for speech comprehension/percpetion paradigms, the following four hypotheses were proposed. Firstly, to confirm that frequency (production) values are interchangeable with familiarity (comprehension) values, there should be a strong positive correlation between all four value sources across the corpus; that is, familiarity values obtained by the current study’s surveys (both written and spoken) should show a strong positive correlation with the frequency values sourced from CELEX and the BNC, and the familiarity values sourced from the MRC.
Secondly, to confirm that mode of presentation (written versus spoken) has no influence on frequency/familiarity values, it was expected that there would be no significant mean differences between BNC spoken frequency values and BNC written frequency values. Thirdly, to also confirm that mode of presentation (written versus spoken) has no influence on familiarity, concreteness or imageability values, it was predicted that there would be no significant mean differences within the current study’s corpus related to presentation type. Finally, if a database’s age does not distort normative values, then there should be no significant differences between the values obtained in the current study’s surveys and those sourced from the MRC (which, as the oldest of the databases is most likely to show an effect).
Six separate, independent samples were recruited from the student and staff populations of the University of New England (UNE), Armidale, New South Wales, Australia and the wider Armidale and Northern Tablelands community. Participants were invited to click on one of six different URLs to access their survey of choice; specifically, Familiarity Written (
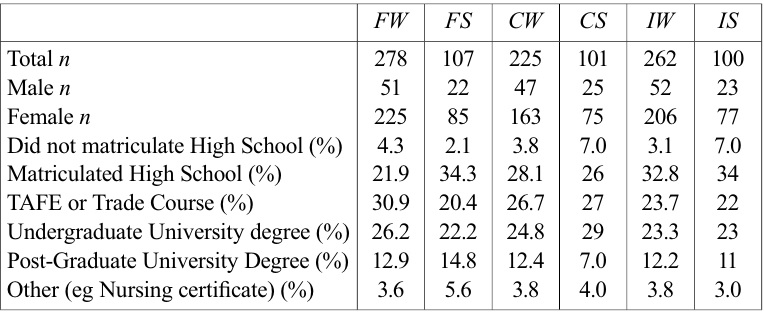
[Table 1.] Educational details and gender distribution by survey type.

Educational details and gender distribution by survey type.
Stimulus words. One hundred disyllabic words (50 x verbs, 50 x nouns) were pseudo-randomly selected from The Australian Concise English Dictionary 4 th Edition (Moore, 2004). Of these, half of each grammatical class (25) displayed typical stress (that is, trochaic stress for nouns, such as “OB-ject”, and iambic stress for verbs, such as “ob-JECT”) with the remainder displaying atypical stress. Another 40 monosyllabic words were also randomly selected, again equally divided between nouns and verbs. This thus resulted in a total of 140 stimulus words. Although some of these words could function as another grammatical class type (e.g., adjective) none, according to the dictionary used, could be used interchangeably within the classes controlled for; that is, none of the nouns were accepted as being able to be used as verbs, and vice-versa. Grammatical class was checked using the dictionary entry, typicality was assigned by the researcher. See Appendix A for the complete stimulus word list.
Surveys. Stimulus words were presented to participants via one of six (
In the case of spoken word presentation surveys (
MRC. The MRC Psycholinguistic Database (Coltheart, 1981) was used to retrieve normative data values for concreteness, imageability and familiarity. These values are derived from an averaging of norms collected from three databases; the Paivio, Yuille and Madigan norms (1968), the Toglia and Battig norms (1978), and the Gilhooley and Logie norms (1980), with each presented as a numeric value between 100 and 700 which were originally derived from a 7 point Likert scale (Wilson, 1988). As the MRC does not offer normative values for all three linguistic features for every word contained in its corpus, it was not possible to obtain appropriate values for all stimulus words used in the current study; thus, comparisons can only be made on a subset of words – concreteness (45), familiarity (51) and imageability (49).
BNC. The BNC does not provide normative data for either concreteness or imageability. It does, however, offer word frequency scores per million for both written and spoken words. Thus it was possible to retrieve normative frequency data for 126 of the 140 spoken words in the current study, as well as 137 of the 140 written words. It should also be noted that the presentation of frequency values in the BNC makes direct comparison with either the MRC or current study’s surveys impossible although strong correlations between these different sources would suggest that they are all measuring the same underlying construct.
CELEX. The CELEX linguistic database was used to access written frequency values. Last updated in 1995, the written frequency values contained in CELEX were derived from texts composed by northern hemisphere (as opposed to Australasian) authors. Like the BNC, CELEX does not offer values for concreteness or imageability, nor does it offer frequency values for every word in the English language, therefore only written frequency values for 73 words could be obtained. Also, like the BNC, the presentation of the frequency values in the CELEX database makes direct comparison with either the MRC or current study’s surveys impossible.
Written surveys (
Spoken (
Data from participants for each of the six separate surveys were initially screened for missing values. Individual participants who displayed >10% missing responses were excluded from subsequent analyses. Where <10% of the responses were missing (< 2% of the total sample), these were replaced by the mean value of the remaining scores for each item (word); that is, the mean of all participants’ responses for that word was used.
Data was then checked for assumption violations. As all surveys, the BNC, MRC and CELEX were significantly skewed, both square root and log 10 transformations were applied. As neither corrected the normality assumption violations, untransformed data were subsequently used for all analyses. It should be noted, however, that theses violations of normality was not especially surprising given the nature of the surveys. It should also be noted that all surveys were skewed in the same direction.
Participant data was then averaged across individual words to allow item analysis based on mean ratings of each word in each condition. To match the values published by the MRC, these values were then multiplied by 100, as per the methodology employed by Gilhooley and Logie (1980).
Given the normality assumption violations and obviously differing sample sizes, only non-parametric tests were considered reliable and will be reported here. Firstly, Spearman’s Rank Order correlations were performed between the different sources (BNC, MRC, CELEX, current survey) on the familiarity/frequency dimension to test hypothesis 1. To test hypotheses 2 and 3, Wilcoxin signed rank tests were then used to compare spoken presentation word values with written word presentation values within both the BNC and current surveys. Finally, to test hypothesis 4, a Friedman twoway ANOVA, was used to examine any differences between the results of the current study’s surveys (both spoken and written types) and the MRC, across the three target linguistic features (familiarity, concreteness, imageability). All tests were conducted using PAWS V.18 (IBM, Chicago, IL), at a significance level of α=.05, two-tailed.
Spearman’s correlations were performed between the written surveys (
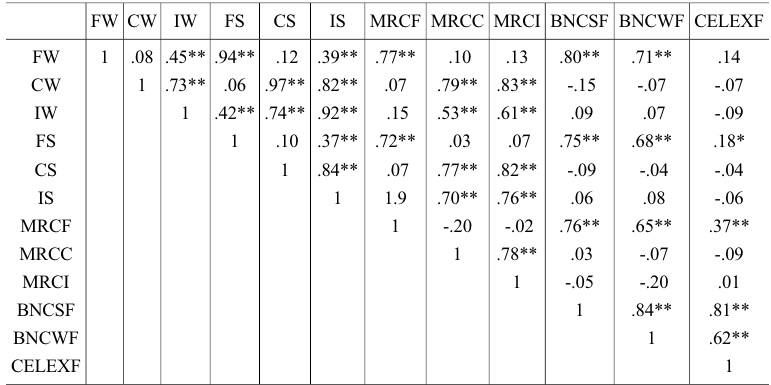
[Table 2.] Spearman’s Rho Rank Correlation Matrix

Spearman’s Rho Rank Correlation Matrix
To test whether frequency/familiarity values would vary significantly between type of presentation (written versus spoken) across the corpus (hypothesis 2), a Wilcoxon signed rank test was performed between the BNC written and spoken frequency values. This showed that written presentation frequency values were, on average, higher than spoken presentation frequency values,
Wilcoxon signed rank tests were then performed between the current study’s written and spoken surveys, across all three linguistic features (familiarity/frequency, concreteness, imageability) to test hypothesis 3. In keeping with the differences found within the BNC corpus, a significant difference was found between presentation style for familiarity,
To finally examine if there were any significant differences between the current survey’s results and the MRC, and thereby test hypothesis 4, a Friedman two-way ANOVA was then performed. This showed significant variation between each presentation type (spoken and written) and the MRC across each linguistic feature. Specifically, significant results were found for familiarity, χ2F =43.17 (corrected for ties),
Partially confirming predictions, strong positive associations were found between the current study’s surveys and both the MRC and the BNC on the familiarity/frequency dimension. This was taken as being sufficient evidence that the current study’s familiarity values were measuring the same underlying construct as the other databases’ (BNC and MRC) frequency/familiarity values. Contrary to predictions, however, there was no significant correlation between CELEX normative frequency values and the current study’s familiarity values, although CELEX did display small to moderate positive correlations with both the MRC familiarity values and BNC written frequency values. The exact reasons for this lack of relationship are unclear, although it thought likely a reflection of differences in value gathering; that is, the CELEX values used were derived from the frequency of words appearing in written text or environments whereas the current study provided a more naturalistic measure of spoken language use. Irrespective of this, the results do suggest that CELEX written frequency values (production) are not interchangeable with familiarity (comprehension) values.
Also contrary to predictions, significant differences were found based on presentation type (written versus spoken) for both the BNC and the current study across all linguistic features; that is, stimuli presented in written form were consistently rated significantly higher than those presented in auditory form, irrespective of whether the construct under consideration was familiarity/frequency, concreteness of imageability. Again the exact reasons are unclear within the current study, however, it may be related to temporal influences on human language perception. In the case of written stimuli, all visual features are available for processing from the very first millisecond the stimulus becomes visible. With auditory stimuli, however, stimulus features unfold over time (at least 500 ms for each of the current study’s stimuli). This difference in temporal availability of features for processing may thus influence subjective feelings of familiarity; by having longer to process the complete range of stimulus features, the participants might, at a pre-conscious level, be influenced to rate written stimuli higher on this basis alone. In a similar vein,
Finally, and again contrary to predictions, a database’s age does appear to distort normative values with the oldest of the databases examined (the MRC) showing significant mean differences compared to the current study across all linguistic features under investigation. While this may be a reflection of the actual sample corpus used or subtle dialectal differences between the different value sources, it is considered more likely that it is a reflection of the age of this database. As demonstrated by Senghas and Coppolla (2001), language can evolve substantially in as little as twenty years. The MRC, however, is derived from data as old as 50 years. Thus, despite the MRC’s ease of use and ability to provide normative data across a range of linguistic features, it appears somewhat past its use-by-date. This is, perhaps, concerning given that a Google Scholar search (conducted 21/11/13) restricted to only 2013 publications returned in excess of 250 papers citing the use of MRC values.
As with any research the current study is not without limitations. Firstly, women outnumbered men by three to one in all six of the current study’s surveys. As a result, gender differences in language use may have skewed the current study’s findings. Although this may impact on the interpretation of the comparisons between the current study’s surveys and the databases used, it does not necessarily have any bearing on the significant differences found between presentation types, especially as the BNC showed a similar significant difference between spoken and written values. Further research into gender differences influencing the perception of familiarity, concreteness and imageability may thus be warranted.
A second limitation of the current study was that first year university students studying psychology represented as many as 90% of participants in individual surveys, thus the values obtained in the current study cannot be generalised to the broader population. It should be noted, however, that psychology students are a prime source of participants for language research paradigms both within Australasia and overseas. As a result, the values obtained here may be more representative of the ‘populations’ used in language research than those published by databases and, as such, a more valid measure for controlling potential confounding variables.
Finally, it became apparent