A self-organized TiO2 nanotube (NT) has been widely considered one of the most promising photocatalysts because of its functional properties [1,2], which include high photocatalytic activity, photo-stability and non-toxicity [3,4]. Moreover, the TiO2 nano-tubular architectures can be precisely controlled by the titanium anodizing process. The TiO2 nanotubes also exhibit a high specific surface area and anisotropic properties [5-7]. However, their utility was restricted by a relatively large band gap (~3.2 eV for anatase) and fast recombination of the photo-generated electron-hole pairs. Especially, in regards to recombination of photo-generated carries, electrons and holes generated by light absorption may be recombined before they participate in catalytic reactions, and the recombination is detrimental to the photocatalytic efficiency. Therefore, to maximize the photocatalytic efficiency, the recombination of electrons and holes must be delayed by separation of photo-induced electrons and holes [8].
Recently, graphene has attracted research interest for its excellent transparency [9,10], high mobility of charge carriers [11,12] and electrical conductivity [13,14]. These properties of graphene will be a great help in improving the photocatalytic efficiency of TiO2. In this study, to improve the photocatalytic activity of titania nanotube catalyst, we attempted to synthesize a graphene/Ag/TiO2 NT photocatalyst. A polymer compound containing CH3COOAg and poly(L-lactide) (PLLA) was utilized for deposition of the Ag nanoparticles (NPs) on the TiO2 nanotubes. The silver nanoparticles were precipitated by reducing the silver ions in CH3COOAg/PLLA during the annealing process. Graphene deposition on the Ag/TiO2 NTs was achieved using an electrophoretic deposition (EPD) process. The surface characteristics of the graphene/Ag/TiO2 NT photocatalyst were investigated using field potenemission scanning electron microscopy (FE-SEM) and Fourier transform infrared spectroscopy (FTIR). Photocatalytic activity was evaluated using dye decomposition rates.
2.1. Preparation of Ag/TiO2 NT catalyst
Commercial-grade (99.6 wt%) titanium plates were used for anodization. The Ti plate was cleaned in acetone and ethanol, and then rinsed with deionized water for 10 min. The anodic TiO2 nanotubular film was synthesized by electrochemical anodization at a constant voltage of 30 V in 0.5 wt% NH4F and 5 wt% H2O containing ethylene glycol (EG) solution. The crystal structure of the titania nanotubes fabricated by anodizing has been identified as an amorphous TiO2 phase [15]. For crystallization of anodic titania nanotubes, additional annealing treatment was needed.
2.2. Deposition process of Ag nanoparticles
Silver acetate (AgC2H3O2, 99.0%; Kojoma Chemical Co.) and PLLA (Fluka) were used to synthesize the Ag NPs on the titania nanotubes. Silver acetate and PLLA were mixed in the weight ratio of 2:1, and the compound was dissolved in CH2Cl2. The solution was dropped on the TiO2 nanotube surfaces under ambient conditions, and then heated in a furnace. To fabricate the crystalline TiO2 nanotubes with Ag NPs, a two-step annealing process was performed. For precipitation of Ag NPs, a titania-nanotubular layer coated with the precursor compound containing AgC2H3O2/PLLA, was first annealed at 380℃ for 1 h, and then a second annealing was performed at 500℃ for crystallization of amorphous TiO2 nanotubes.
2.3. Deposition of graphene on TiO2 nanotubes
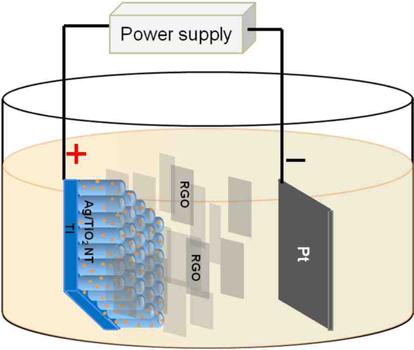
The graphene deposition on the Ag/TiO2 nanotubes was performed using an electrophoretic deposition (EPD) process. Graphene oxide (GO) was purchased from NanoGetter Co. (Seongnam, Korea). The GO was chemically reduced to graphene by reaction with hydrazine [16]. For this purpose, 40 mL of aqueous GO solution was mixed with 0.04 mL of 80% hydrazine aqueous solution and 0.28 mL of 30% aqueous ammonia in a conical flask. To produce graphene, the mixed solution in the flask was then placed in a water bath at 100℃ for 2 h. The graphene particles synthesized by reduction of GO with hydrazine, exhibited a negative charge on the surface at pH greater than 4 [17], and could be deposited on the surface of a positive electrode under the applied potential. In this study, the electrophoretic deposition of graphene on the surface of Ag/TiO2 nanotubes was carried out at a constant voltage of 4 V for 2 min, in a two-electrode cell system. The pH of the graphene solution used as electrolyte was kept at 12, and a platinum sheet was used as the counter electrode. A schematic diagram of the EPD process is shown in Fig. 1.
2.4. Characterization and photocatalytic efficiency
To investigate Ag precipitation in the compound containing CH3COOAg/PLLA, differential scanning calorimetry (DSC; DSC N 650, Sinco, Twin Lakes, WI, USA) and thermogravimetry (TG; Scinco N-1000, Sinco) were utilized. The crystalline structure of the TiO2 nanotubes was characterized by X-ray diffraction analysis (D8 discover, Bruker AXS, Karlsruhe, Germany), and their morphologies were observed using FE-SEM (JSM 7600F, JEOL, Tokyo, Japan). The dye decomposition rates for the photocatalytic efficiency of the TiO2 nanotube were evaluated using aniline blue [18]. In addition, ultraviolet (UV)/Visible spectroscopy (Unicam 8700, Spectronic Camspec Ltd, Leeds, UK) was performed to determine the decomposition rate of the dye in the absorption band of 600 nm.
3.1. Morphology of titania nanotubes
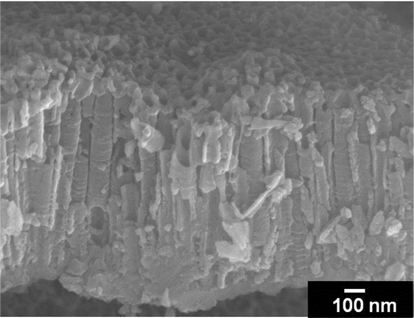
The morphology of anodic titania nanotubular films can be controlled by various fabrication parameters. The anodic potenetial applied and the electrolyte composition, in particular, clearly affects the nanotube arrangement and surface morphology of TiO2 nanotubes. Longer tube-length can be obtained with TiO2 nanotubes fabricated in an ethylene-glycol-mixture solution than fabricated in acidic electrolytes. Fig. 2 shows the regular nano-tubular arrangement on the self-organized TiO2 layer synthesized at 30 V in a mixture of EG/0.5 wt% NH4F/5 wt% H2O. The anodic TiO2 layer consisted of nanotubes with an outer diameter of 100 nm. The anodic TiO2 nanotubes without annealing were identified as being in amorphous phase. Thus, additional annealing treatment was needed for crystallization.
3.2. Thermal reaction of precursor polymer for precipitation of Ag nanoparticles
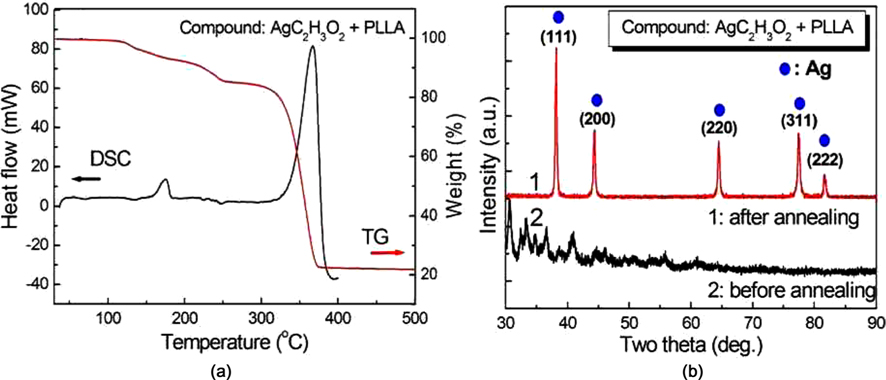
In order to investigate the effect of annealing temperature on the precipitation of Ag NPs, the thermal behavior of the polymer compound containing CH3COOAg/PLLA (in the weight ratio of 2:1) was analyzed using DSC and TG. The DSC and TG analyses were carried out with 10 mg samples in N2 gas at a heating rate of 10℃ /min. Fig. 3a shows the thermal reaction of the precursor polymer with temperature, and a large endothermic peak exhibited in the range 320℃-380℃ due to the thermal decomposition of the precursor polymer (PLLA). In this temperature range, the Ag+ ions in CH3COOAg/PLLA may be reduced to silver nanoparticles (Ago) since the polymer PLLA acts as a reducing agent [19]. The mass loss in the TG curve can be interpreted in terms of the complex decomposition process related to evolution of CO, CO2, COOH, and H2O.
To confirm the precipitation of Ag NPs by reducing Ag+ to Ago, the polymer containing CH3COOAg/PLLA was annealed at 380℃ for 1 h, and then the crystalline structure of the compound was examined. The X-ray diffraction (XRD) result of the polymer compound is shown in Fig. 3b. No specific crystalline structure was identified from the XRD pattern of the polymer compound without annealing treatment. However, when the polymer compound was annealed at 380℃ for 1 h, multiple peaks at 2θ = 38.32°, 44.50°, 64.61°, 77.54°, and 81.68° were obvious, and were identified as the (111), (200), (220), (311), and (222) planes of the silver crystalline structure. The XRD result shown in Fig. 3b indicates that the Ag metal particles can be obtained from the precursor containing CH3COOAg/PLLA, by annealing at 380℃.
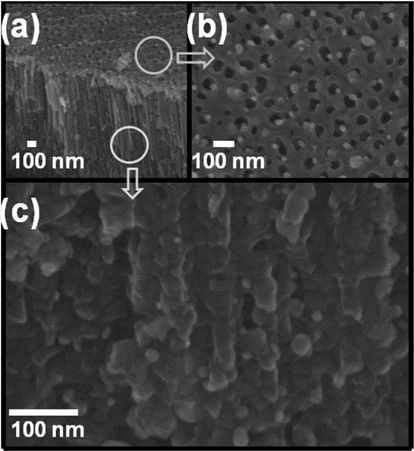
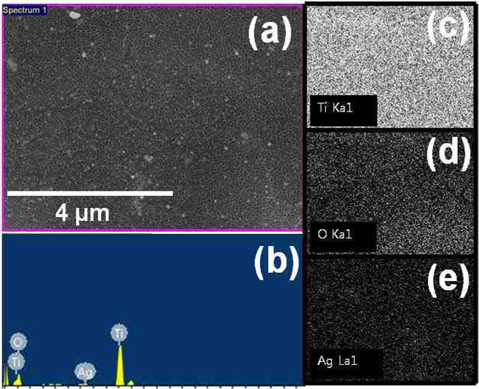
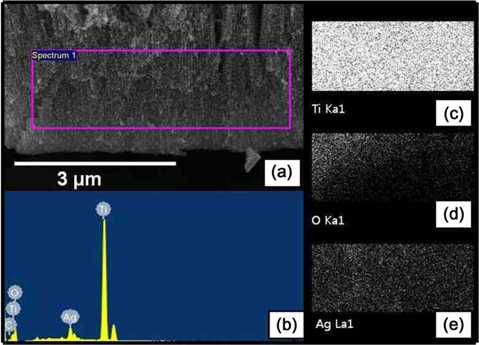
In order to precipitate the Ag NPs on the TiO2 nanotubes, a polymer compound containing CH3COOAg/PLLA in the ratio of 2:1 was utilized. To reduce the Ag+ to Ago metal particles in the polymer compound, and to crystallize the amorphous TiO2 nanotubes, the compound was used to wet the TiO2 nanotubes, after which a two-step annealing process was performed. The first annealing treatment was at 380℃ for 1 h. Because the PLLA posited with the Ag NPs, and of the graphene layer, were also supplies electrons and acts as reducing agent, the silver ions in the CH3COOAg were reduced to silver metal particles. During the second annealing at 500℃ for 1 h, the amorphous phase of titania nanotubes was transformed to anatase-type crystalline structure. Moreover, during this annealing process at 380℃, the high heat also removed the residual polymer. Fig. 4a shows the scanning electron microscopy (SEM) image of the TiO2 nanotubular layer deposited with the Ag NPs. Fig. 4b and c are representative SEM images observed from the top and a cross-section of the sample, respectively. The precipitated silver nanoparticles on the TiO2 nanotubes, prepared by the wetting and annealing process (shown in Fig. 4b and c), exhibit average particle-size of 10-30 nm. The size of the metal particles can be controlled by adjusting the concentration of the compound polymer. The chemical composition of the surface of the titania nanotubes in Fig. 5a was determined by energy dispersion X-ray spectroscopy (EDS), and the result is shown in Fig. 5b. The elemental signals prove the presence of silver, titanium, and oxygen. The Ag peaks were attributed to the precipitation of Ag NPs on the TiO2 nanotubes, while the Ti and O peaks were ascribed to the anatasetype TiO2 nanotubes. X-ray mapping indicated the distribution of the chemical forms of Ti, O, and Ag (Fig. 5c-e). This showed that the precipitated Ag NPs were homogeneously distributed on the surface of the TiO2 nanotubes. Fig. 6 shows the EDS and X-ray mapping results obtained from the TiO2 nano-tube cross-section area deposited with the Ag NPs. The result indicates that the Ag NPs were also deposited homogeneously inside the TiO2 nanotubes, as they were precipitated during the annealing process by reduction of silver ions in the polymer compound.
3.3. Deposition of graphene sheets on TiO2 nanotubes
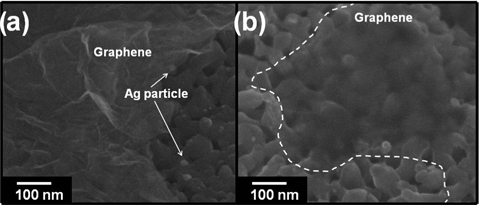
The deposition of graphene on the Ag/TiO2 NTs to create the photocatalyst was performed by an electrophoretic deposition process at 4 V in electrolyte containing reduced GO particles at pH 12. For the electrophoretic deposition process, a two-electrode cell was utilized. In this process, negatively charged, reduced graphene-oxide in solution moves toward the positive electrode under an applied DC electric field, therefore, the graphene was gradually deposited onto the Ag/TiO2 NTs, and the thickness of the graphene layer so deposited, increased with time. Fig. 7 shows the deposited graphene on the Ag/TiO2 NTs after 2 min of electrophoretic deposition at 4 V. Fig. 7a shows that the surfaces of the Ag/TiO2 NTs have been covered with graphene sheets, and partially deposited graphene on the Ag/TiO2 NTs is exhibited in Fig. 7b. Thus, Fig. 7 indicates that the graphene/Ag/TiO2 hybrid composite for photocatalysis had been synthesized, and that the EPD process was useful for the deposition of graphene on the Ag/TiO2 NTs.
3.4. Characteristics of the RGO/Ag/TiO2 NT composite
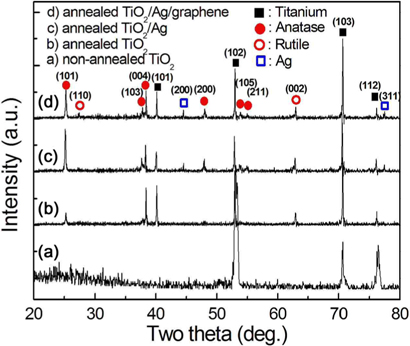
To investigate phase transformation during annealing at 500℃ for 1 h, the XRD analysis was performed on non-annealed and annealed TiO2 nanotube layers. Moreover, the crystal structure of the annealed TiO2 with Ag NPs, annealed TiO2 deposited with the Ag NPs, and of the graphene layer, were also photocatainvestigated. The resulting XRD patterns are shown in Fig. 8.
For non-annealed TiO2 nanotubes (Fig. 8a), the XRD pattern exhibited the presence of titanium and anatase peaks, but the anatase peaks were very weakly presented. The titanium peaks originated from the titanium substrate. Thus, the XRD result indicates that most of the crystal structure on non-annealed titania nanotubes was amorphous phase, and that anatase phase was only slightly produced in the anodized TiO2 nanotubes. However, for annealed TiO2 nanotubes, as shown in Fig. 8b, the anatase-type crystalline TiO2 peaks increased. Thus, the annealing treatment changed the amorphous TiO2 nanotubular film to a crystalline TiO2 structure. For the annealed Ag/TiO2 NTs, as shown in Fig. 8c, the anatase peaks increased slightly, and silver peaks observed were weak. However, in the case of the diffraction pattern of annealed graphene/Ag/TiO2 NTs in Fig. 8d, no distinct changes of the peaks associated with Fig. 8c were observed in the XRD result. This may be attributed to the small graphene content in the TiO2 hybrid nanotube, as reported elsewhere [20-22].
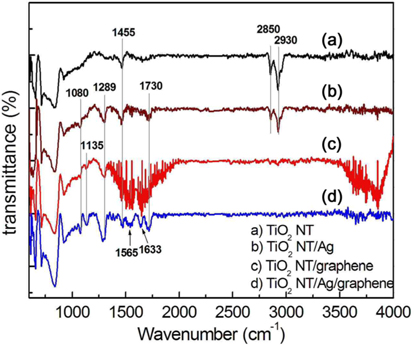
The FTIR spectra of TiO2 NTs, Ag/TiO2 NTs, and graphene/Ag/TiO2 NTs are shown in Fig. 9. Moreover, for comparison of characteristic features, the spectrum of TiO2 NTs deposited with graphene (graphene/TiO2 NTs) is also represented (Fig. 9c). In Fig. 9, the low frequency absorption (below 1000 cm−1) is attributed to Ti–O–Ti vibration [23-26], while the broad absorption from 3000 to 3700 cm−1 is assigned to the O–H stretching vibration of the surface hydroxyl from adsorbed water [26,27]. The absorption peaks at 2930, 2850, and 1455 cm−1 [28] of anodic TiO2 NT in Fig. 9a, are attributed to the Ti–OH bond [28-30]. For FTIR spectra of Ag/TiO2 NTs and graphene/Ag/TiO2 NTs, the absorption bands around 1730 [31] and 1289 cm−1 correspond to carboxylic C-O stretching, and the peaks at 1080 cm−1 are assumed to be affected by the partial presence of functional groups formed by the residual precursor compound containing the AgC2H3O2/PLLA.
For the graphene/Ag/TiO2 NTs, new absorption bands showed at 1135, 1565, and 1633 cm−1. The absorption band of 1135 cm−1 is attributed to the stretching vibration of C-H and the band at 1565 cm−1 [32,33] is related to the C-C bonds due to skeletal vibration of the graphene sheets. The absorption band around 1633 cm−1 can be attributed to C=C ring stretching [31,34] or to the H–O–H bending band of adsorbed H2O molecules [34,35]. Therefore, the spectra of the graphene/Ag/TiO2 NTs showed absorptions associated with graphene (1565 and 1633 cm−1), and these results indicate that the graphene sheets were successfully deposited on the Ag/TiO2 NT by the electrophoretic deposition process.
3.5. Photocatalytic efficiency of titania nanotube catalysts
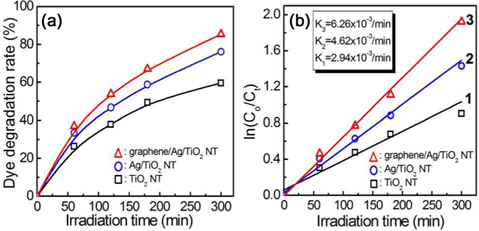
In order to investigate photocatalytic efficiency, dye decomposition tests were performed on TiO2 NTs, Ag/TiO2 NTs, and graphene/Ag/TiO2 NTs catalysts. Fig. 10a shows the photocatalytic efficiency of the titania nano-tubular catalysts for dye degradation during irradiation with an Hg lamp. Before the experiment, the starting solution was adjusted to 83 μM aniline blue for decomposition efficiency, and the pH was kept constant at 4.0 throughout the experiment. In order to obtain the actual photocatalytic efficiency of the prepared catalysts, blank tests were carried out, and the photocatalytic efficiencies were compensated. After a dye decomposition test for 5 h, the photocatainvestigatalytic reaction with bare TiO2 nanotubes caused 26.4% of the dye to be removed after 1 h, 49.3% after 3 h, and 59.5% after 5 h. The corresponding dye removal rates were 33.4%, 58.7%, and 76.1% for the Ag/TiO2 NTs; and 37.0%, 67.0%, and 85.3% for the graphene/Ag/TiO2 NTs hybrid catalyst, respectively.
For kinetic analysis of the photocatalytic reaction, the rate constant of the TiO2 composite catalyst was evaluated. The rate constant for the dye degradation reaction on TiO2 composites was calculated using eq (1):

where [A] is the concentration of reactant, k is the rate constant, and x is the reaction order. The reaction order for dye decomposition on the TiO2 NT catalysts has been reported as first order [15]. Therefore, the change of concentration with reaction time can be written as eq (2) and eq (3):

where Co represents the initial concentration, Ct is the resultant concentration of dye after reaction time (min), and
The rate constants for the dye degradation were 2.94 × 10⁻³ min−1 for TiO2 NTs, 4.62 × 10⁻³ min−1 for Ag/TiO2 NTs, and 6.26 × 10⁻³ min−1 for the graphene/Ag/TiO2 NTs composite catalyst, as shown in Fig. 10b. The dye degradation results (Fig. 10a and b), showed that the photocatalytic efficiency was significantly affected by deposition of Ag particles and graphene on the TiO2 nanotubes. From Fig. 10, the dye destruction efficiency of Ag/TiO2 NT catalyst was greater than with the TiO2 NT photocatalyst. Moreover, the graphene/Ag/TiO2 NT composite catalyst exhibited much higher dye destruction efficiency than did the other TiO2 photocatalysts.
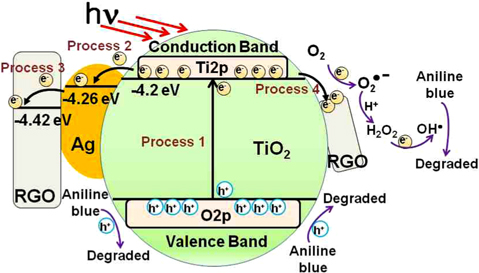
Regarding the effects of graphene and Ag deposition, Fig. 11 exhibits the photocatalytic degradation mechanism of the graphene/Ag/TiO2 NTs system. In Fig. 11, the potential of the conduction band of TiO2 NTs is −4.2 eV [36], and the work functions of Ag [37] and graphene [38] indicate −4.26 and −4.42 eV, respectively. This result suggests that the photo-induced electron transfer from the conduction band of TiO2 NTs to Ag or graphene was due to a difference in the work function. When light with energy equal to or greater than the band gap of TiO2 (3.2 eV) is absorbed on the TiO2 catalyst, photo-excited holes and electrons move to the TiO2 surface (Process 1), where they participate in catalytic reactions [39-41]. The photo-produced holes H+ and OH• radicals are known as strongly active agents in the dye-degradation process, andOH• radicals can be generated by oxidation of water.

Moreover, the photo-generated electrons in the conduction band of TiO2 were consumed by surface absorbed O2 to form , OH• and other superoxide radicals.


Due to oxidation of the aniline blue (AB) by OH• radicals, or to direct oxidation by photo-generated holes, the AB is decomposed.


The photocatalytic decomposition reaction of aniline blue is presented in Fig. 11. In the photocatalytic reaction, many electron–hole pairs could recombine before they reach the surface of the TiO2. This recombination is detrimental to photocatalytic efficiency. Thus, the photocatalytic rate constant of TiO2 NTs was much lower due to recombination of the photo-induced charge carriers.
However, if the Ag NPs were homogeneously deposited on the TiO2 surface, the photo-generated electrons transfer from the conduction band of TiO2 to the Ag particles (Process 2). Thus, the Ag NPs act as electron traps [42-44], which can effectively decrease the rate of electron-hole recombination, and increase the photocatalytic activity. On the other hand, the photocatalytic efficiency can be decreased by oversized Ag particles on titania surfaces, which act as recombination centers [45]. For the graphene/Ag/TiO2 NTs composite catalyst, the photo-induced charge recombination could be more effectively suppressed (Process 2, 3, and 4) due to differences in the work function, compared to the other photocatalysts. High efficiency in charge separation leads to increased photocatalytic activity for the dye-degradation reaction. In this work, to create the graphene/Ag/TiO2 NTs hybrid catalyst, synthesized Ag NPs and graphene sheets were homogeneously deposited onto TiO2 NTs. This led to a decreased rate of electron-hole recombination and increased photocatalytic activity. Therefore, the graphene/Ag/TiO2 NTs composite catalyst exhibited much higher dye destruction efficiency due to the synergistic effect of the graphene and the Ag deposition on the titania nanotubes.
To obtain high-performance photocatalytic degradation, a graphene/Ag/TiO2 NT hybrid catalyst was synthesized, and its fabrication process, surface characteristics, and photocatalytic activity were investigated. The TiO2 nanotubular photocatalyst was fabricated by anodization, and the Ag NPs on the TiO2 nanotubes were synthesized by a wetting and annealing process. During annealing in the temperature range of 320℃-380℃, the silver nanoparticles on the titania nanotubes were precipitated by reduction of silver ions in a compound polymer containing AgC2H3O2/PLLA. The deposition of graphene on the Ag/TiO2 NTs was performed by electrophoretic deposition. The FE-SEM and FTIR results for the graphene/Ag/TiO2 NTs showed that the Ag NPs and graphene sheets were successfully deposited on the TiO2 nanotubes by reduction of the compound polymer containing AgC2H3O2/PLLA, and simultaneous electrophoretic deposition.
From the dye degradation result, the photocatalytic efficiency was significantly affected by deposition of Ag NPs and graphene on the TiO2 catalyst. The Ag-coated TiO2 NT, compared with bare TiO2 NT, exhibited a high rate of dye degradation, which is attributed to suppressing the recombination of the hole-electron pairs. The best dye destruction efficiency was obtained with the graphene/Ag/TiO2 NT photocatalyst. Its high photocatalytic efficiency may be attributed to the synergistic effect of the graphene and Ag deposition onto the TiO2 NTs.