Digital infrared thermal imaging is a non-invasive adjunctive diagnostic technique that allows an examiner to visualize and quantify changes in skin surface temperature. The asymmetry of temperature differences between the diseased and the contralateral healthy body parts can be automatically analyzed and has been studied in many areas of medical science. In this paper, we propose a method for intelligent automatic asymmetry detection based on a K-means analysis and a YCbCr color model. The implemented software successfully visualizes an asymmetric distribution of colors with respect to the patients’ health status.
Digital infrared thermal imaging (DITI) is a fast, passive, non-contact, and non-invasive alternative to conventional clinical thermometers for monitoring body temperature [1]. DITI has been used in many areas of medical science as well as in the field of non-destructive testing (NDT). In the field of NDT, it is mainly used for surface defect detection and online monitoring of processes [2-4].
The usefulness of thermograms for the diagnosis of physical illnesses was reported as early as 1963 [5]. Over several decades, with rapidly developing computer technology and artificial intelligence, DITI has been extensively studied in many fields of medical science, such as diabetic neuropathy [6], vascular disorders [7], fever screening [8], dry eye syndrome diagnosis [9], and breast cancer detection [10-13], and even as a pre-screening tool for the detection of canine bone cancer [14]. For example, it has been reported that when state-of-the-art infrared technology was combined with advanced computer hardware and software technology, the sensitivity for breast cancer detection was 97% in 92 patients undergoing breast biopsy [15]. Further, a system with an artificial neural network for breast cancer detection with DITI showed particularly low sensitivity and was useful for women under the age of 50 years [11].
For a DITI analysis in medical science, the power of such pre-screening or detection of extraordinary conditions comes from an asymmetry analysis in which temperature differences between the diseased and the contralateral healthy body parts are analyzed [1]. Since cancer cells with their higher metabolic rate are hotter than normal cells, which makes cancerous tumors appear as hotspots in DIT images, this technique is particularly useful in female breast imaging [13]. While higher-order statistics such as variance, skewness, kurtosis, and joint entropy are effective measures of asymmetry [13], there are other technical methodologies to develop an automatic asymmetry analysis system, such as independent component analysis [12], Hough transform-aided image segmentation and pattern classification [16], and fuzzy logic [17].
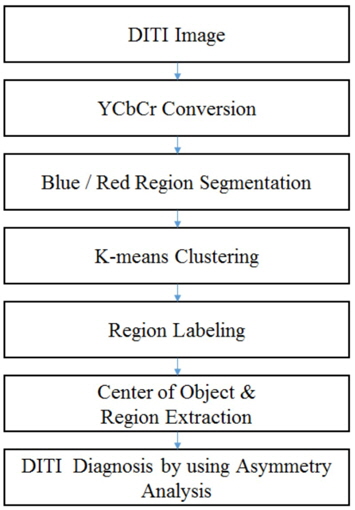
In this study, we focus on asymmetry detection using DITI with different color models and propose a method based on the well-known K-means clustering algorithm [18]. The YCbCr color model that we have used in this study is a way of encoding RGB information and successfully applying it to a human skin model for face detection [19]. As illustrated in Figure 1, we first extract the blue and red regions from the YCbCr space-transferred DITI and then apply K-means to form the object clusters. Then, we search the center of gravity among the extracted objects and form a circle to define the magnitude of the red/blue objects. Thereafter, the degree of asymmetry can be easily analyzed.
2. Automatic Asymmetry Detection
2.1 Object Extraction by K-Means Clustering
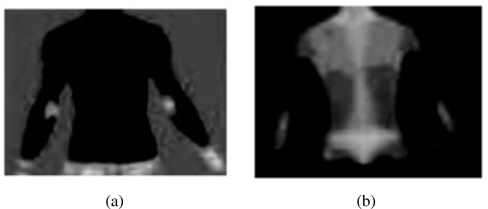
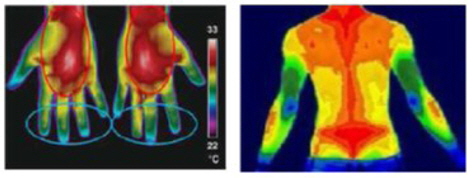
As one can see from Figure 2, the spectrum of colors indicates an increase or decrease in the amount of infrared radiation being emitted from the body surface in a DIT image; here, red denotes a relatively high temperature and blue, a relatively low temperature. In order to effectively separate the red and blue regions, we transfer the usual RGB color model to the YCrCb color model. The idea of such color model transfer is based on the fact that humans are more sensitive to brightness than to a color itself; thus, brightness contrast is a more reliable measure. In the YCrCb color model, Y denotes the luminance, and Cb and Cr represent the blue-difference and the red-difference chroma components. Thus, the red region and the blue region are extracted on the basis of such Cb and Cr values, as shown in Figure 3.
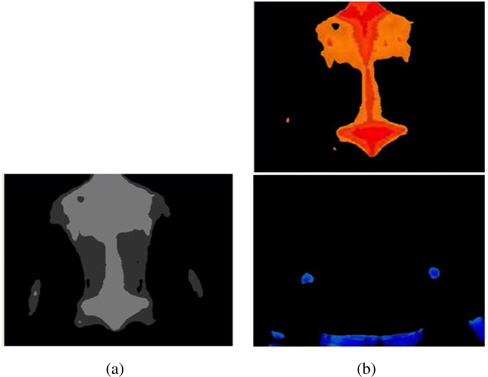
The next step is to make clusters by K-means [18] and extract regions using region labeling. K-means is a well-known unsupervised learning algorithm to form K clusters from data with iterative updates of k centers so that the within-cluster sum of squares is minimized.
After clustering, we apply a region labeling method [20] to connect the related pixels in order to form an object of concern. We adopt repetitive region labeling. The effect of K-means clustering and region labeling are shown in Figure 4.
In order to analyze the extracted red and blue regions, we set the center of gravity points

where
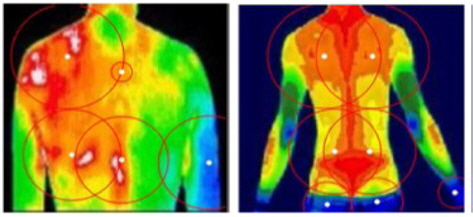
Using these center points, we draw circles that contain all the target regions, as shown in Figure 5.
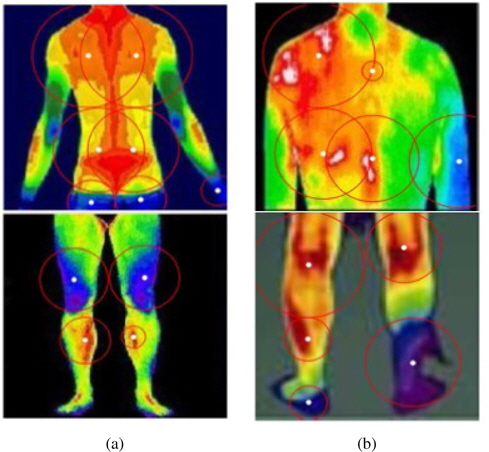
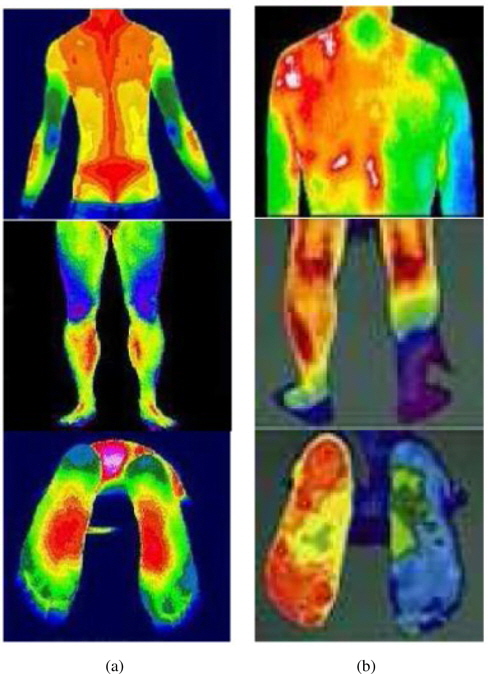
Using DITI, medical experts judge whether a subject has an unhealthy status on the basis of the degree of asymmetry in the body temperature distribution. Figure 6 shows some typical DIT images that represent healthy and unhealthy subjects.
As one can see from Figure 6(a), a healthy subject has a balanced distribution of body temperature and shows a high degree of left–right symmetry. Furthermore, there exist highly contrasted regions of high temperature (popliteal, cubital fossa, flesh, and breast) and of low temperature (elbow, heel, and knee). However, an unhealthy subject does not show such characteristic features in DITI, as shown in Figure 6(b).
Thus, we can easily provide some quantitative measures of such asymmetry in the form of blue/red distribution statistics and left–right imbalance. If there is a highly skewed distribution of the red region, it is a sign of unhealthiness due to high body temperature. In contrast, if the blue region is overwhelming in the lower body or hands/feet, the subject may be suffering from hypothermia or circulatory disturbances.
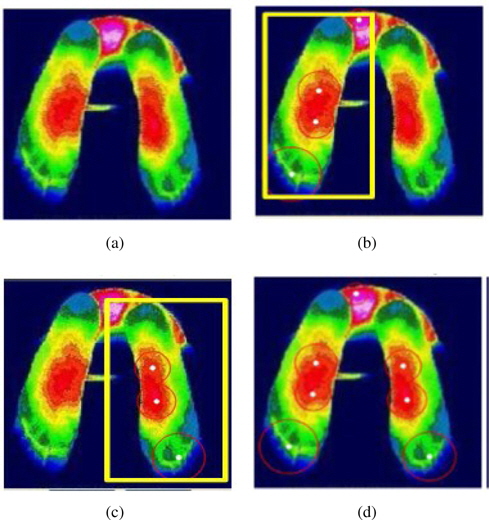
Figure 7 illustrates how to measure the left–right symmetry in the proposed method. As explained in the previous section, we draw circles from the center points decided by K-means clustering and compare the left part and the right part. Typical asymmetries are found when a subject has a herniated cervical (lumbar) disc, chronic shoulder pain (upper body) or spinal disk disorder, rheumatoid arthritis, or knee arthralgia (lower body).
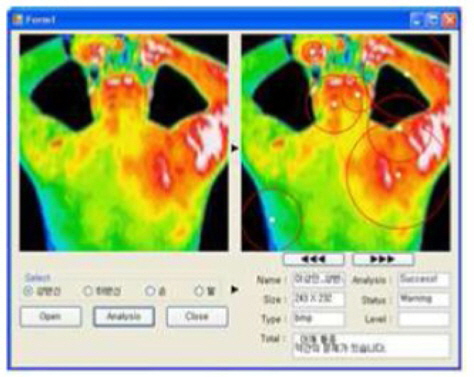
The proposed method was implemented with a Microsoft Visual Studio 2010 tool, and experiments were performed on an IBM-compatible PC with Intel Core i7-2600 CPU @ 3.40 GHz and 4-GB RAM. A typical snapshot of the software is shown in Figure 8.
Our software was tested by medical experts from the medical school of Pusan National University, Korea, and the typical outputs of the healthy and unhealthy subjects are shown in Figure 9. It was tested more than 20 times, and multiple medical experts verified the efficacy of the software.
In this paper, we propose a method to analyze DIT images automatically by using K-means unsupervised clustering and region labeling on the YCrCb color model. Since human vision is more sensitive to the brightness contrast than to a color itself, the YCrCb color model helps to extract more salient red/blue regions with respect to the body temperature, and the distribution statistics and the asymmetry degree are crucial for the diagnosis of a subject as healthy or unhealthy. In the experiment, the implemented software reacts appropriately to real data. In the future, we intend to study certain related research themes such as a clinical evaluation of the statistical parameters and specific-disease-related color–body part pattern detection.