This study examines the foremost concerns related to most noted research performance index. The most popular and widely acceptable h-index underestimates the highly visible scientist, the middle order group, due to citation distribution issues. The study addresses this issue and uses 'Corrected Quality Ratio' (CQ) to check the implicit underpinnings as evident in h-index. CQ helps to incorporate the aspects of a good research performance indicator. This simple revision performs more intimately and logically to gauge the broader research impact for all groups and highly visible scientists with less statistical error.
Metrics/indices play a crucial role for peer-based, metrics-based, or hybrid research evaluation approaches. Selection and usage of indices to appraise quantity and impact of the productive core is a sensitive subject for Research Performance Evaluation (RPE). In evaluative scientometric studies, these parameters are measured by Activity Indicator (AI), Observed Impact Indicator (OII), journal related indices, and/or other newly introduced global indices (h and h-type indices). These indicators stand for the quantity, impact, influence, or quality of the scholarly communication. AI measures the quantity of the productivity core (publication) while OII stands for impact of productivity core (citation and its subsequent metrics).
Disciplinary perspectives, the use of indicators in different contexts, the arbitrary nature of indicators, and electronic publishing scenarios have turned the attention of scientometricians, policymakers, and researchers of other fields to modifying the existing indices and to discovering new metrics to gauge quantity and quality. Citation, its subsequent metrics, and the root indicator publications have a sound place in the decision-making process.
In 2005, Hirsch proposed h-index, which was immediately noticed by the scientometricians and warmly welcomed by all stakeholders. It is defined as: “A scientist has index h if h of his/her Np papers has at least h citations each and the other (Np − h) papers have no more than h citations each” (Hirsch, 2005, p. 16569). The said index aims to measure the impact of scholarly communication in terms of quality (citation) and productivity (publication) in an objective manner. It represents the most productive core of an author’s output in terms of the most cited papers (Burrell, 2007). A continuous debate among scientometricians, policymakers, as well as researchers of other fields has made h-index one of the hottest topics in the history of scientometric research.
Rousseau (2006) introduced the term Hirsch core (h-core), which is a group of high-performance publications with respect to the scientist’s career (Jin, et al., 2007). A good indicator should be intuitive and sensitive to the number of uncited papers (Tol, 2009). Such an index should exceed from h-core papers (Vinkler, 2007) and “must assign a positive score to each new citation as it occurs” (Anderson, et al., 2008). Notwithstanding, h-index also suffers from several implicit disadvantages such as sensitivity to highly cited paper (Egghe, 2006a; Egghe, 2006b; Norris & Oppenheim, 2010), giving more weight to one or few highly cited publications (Glänzel, 2006; Egghe, 2006a; Costas & Bordons, 2007), lacking in sensitivity to performance change (Bihui, et al., 2007), disadvantaging earlier career work (Glanzel, 2006; Burrell, 2007), and being time dependent (Burrell, 2007). While highly cited papers may represent breakthrough results in computing h-index (Vinkler, 2007), this index is also criticized for its lack in accuracy and precision (Lehmann, et al., 2005).
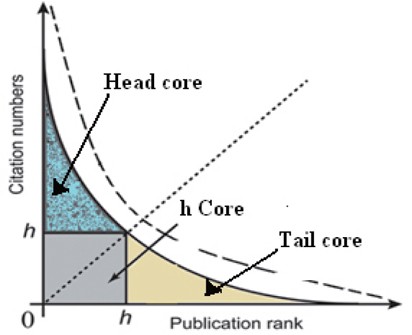
Soon after h-index, several modification and improvements have been proposed. Due to its persuasive nature, the field dependence, self-citation, multi-authorship, and career length were also taken into account (Bornmann, et al., 2011; Norris & Oppenheim, 2009). It is important to note that most of the new indices focused on h-core only, while citation distribution in the head and tail cores remain ignored due to their formulaic limitations (Pathap, 2010; Bornmann, et al., 2011; Zahang, 2009; 2013). Fig. 1 shows the head, tail, and h-core. The publications and citations, which define h-index, are called h-core; whereas publications with citations more/less than h-core are defined as head and core, respectively.
The literature reveals that the h-index not only incorporates quantity and quality, but it is also simple, efficient, and has ease in use. It laurels over the other research evaluation metrics due to a blend of objectivity and subjectivity, and its scientific and persuasive nature. This index is insensitive to highly as well as zero cited articles and is robust (van Raan 2006; Cronin & Meho 2006; Imperial & Navarro 2007; Oppenheim 2007; Luz et.al., 2008; Bornmann, et al., 2008; Bouabid & Martin 2008; Lazaridis 2009, Norris and Oppenheim, 2010, Tahira, et al., 2013). These underpinnings have led to the introduction of numerous h-type indices, mostly focused on citation distribution issues. We refer to review studies by Norris and Oppenheim (2010) and Bornmann, et al., (2011). Though h-index has made its place for Research Performance Evaluation (RPE), yet there is a need to address its inherent reservations more intimately and logically.
The actor CPP was considered as a multiplicative connection to the Corrected Quality Ratio (CQ) to incorporate the overall quality of production (Lindsey, 1978). The hG-H model used it to link to publications (Schubert & Glänzel, 2007) and in p-index with citation as quantity indicator (Parthap, 2010). We are considering CPP actor to deal with the core issue of the citation distribution as evident in classic h-index. The aim is to address the implicit dimensions of original h-index.
Our proposed index uses ‘Citation Per Publication’ (CPP) as a balancing correction to improve the original h-index underpinnings related to citation distribution issues in the head and tail cores. It is expressed as a multiplicative connection between h and CPP with the geometric mean of these functions (Fig. 1). We employed a geometric mean to compute different functions, which are multiplied together to produce a single “figure of merit” (Spizman & Weinstein, 2008).
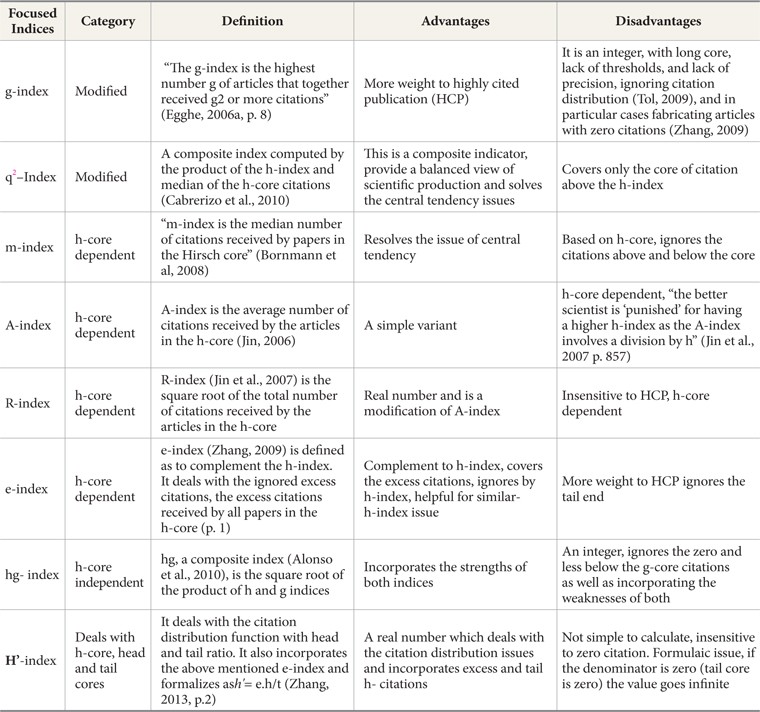
Keeping in view the foundation issues of original h-index (see Table 1), we have designed three categories from the proposed h-type indices: modified h-indices, h-type indices dependent on h-core, and h-type indices independent of h-core. These categories are concerned with h-core, head, and tail citation distributions. For the present study, we have considered at least one index from these categories. To avoid redundancy, a few indices which fall in these categories, like hw (Egghe & Rousseau, 2008) and v-index (Riikonen & Vihinen, 2008), are not considered. These selected indices along with the proposed h-cpp index are examined and evaluated to check their performance for evaluation purposes.
[Table 1.] Salient Features of h-type Indices of Three Designed Categories

Salient Features of h-type Indices of Three Designed Categories
Two experiments are conducted at the author level. Jacso wrote a series of articles on pros and cons of popular online referenced enhanced databases e.g. Google scholar, Scopus, and Web of Science (WoSTM) (Jacso, 2005a; 2005b; 2008a; 2008b; 2008c). He found WoSTM appropriate for calculating h-index scores (Jacso, 2008c).
The study first refers to the case of the first 100 most productive Malaysian related engineers’ data from WoSTM over a ten year period (2001-2010). Our research term was ‘Malaysia’ and we limited to only those engineering categories from WoSTM that have the word ‘engineering’ in common. The term ‘Malaysian related engineers’ is used for researchers who are affiliated to with11 selected Malaysian universities (> 50 publications) under nine WoSTM engineering categories for document type articles and reviews only. The second data set used as the benchmark is the 100 most prolific economists dataset from Tol’s study (Tol, 2009), with his permission.
The eminence of scientists is manifested by their activity and impact indicators. Overall, much fluctuation is observed among scientists’ positions when applying the original h, H’, and h-cpp indices. The CPP as a quality measure is criticized owing to its penalizing of high productivity (Hirsch, 2005; Tahira, et al., 2013). This fact is evident in Table 2. We discuss the positioning order of these authors by employing the four Cole and Cole (1973) criteria based on publication and citation behavior of author publishing.
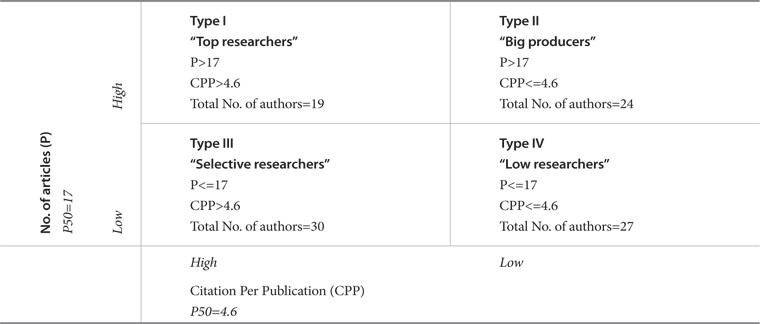
[Table 2.] Typology of Malaysian Related Engineers

Typology of Malaysian Related Engineers
A noteworthy fluctuation is observed in the positioning order of Malaysian related engineers by employing these indices (Beside these indices, there are various other potential indices. Such discrepancies in results lead to introducing new indices. All of these indices either give some insight or add value in one or another way. Here, the question immediately arises, which index is the best to accomplish different dimensions of performance evaluation, with less reservation, or is there any possible improvement to handle the quantity and quality aspects of research evaluation?
Publication is a base and other measures such as activity, observed, expected, and relative impact indicators are developed from it. Publication is an indicator rather easy to handle and can be manipulated purposely. Eventually, these strategies have effect on impact indices. Let us elaborate the case with four group analysis at author level.
To explore the effect of these strategies on publications and impact behavior, we applied Cole and Cole (1967; 1973) dichotomous cross classification criteria on our 100 most productive Malaysian related engineers’ data. We used Coastas and Bordons’ (2008) denomination of the groups as mentioned in Table 2. We categorized four groups employing the threshold strategy for P and CPP of their fifty percentiles. The median of the ‘total number of documents’ and ‘citations per document rate’ of this case was (P50=17) and (P50=4.6), respectively. Researchers are classified into four groups and are named as ‘top producer,’ ‘big producer,’ ‘selective,’ and ‘silent’ groups (as illustrated in Table 2).
5. DESCRIPTIVE ANALYSIS AND BOX PLOTS ILLUSTRATIONS OF FOUR GROUPS
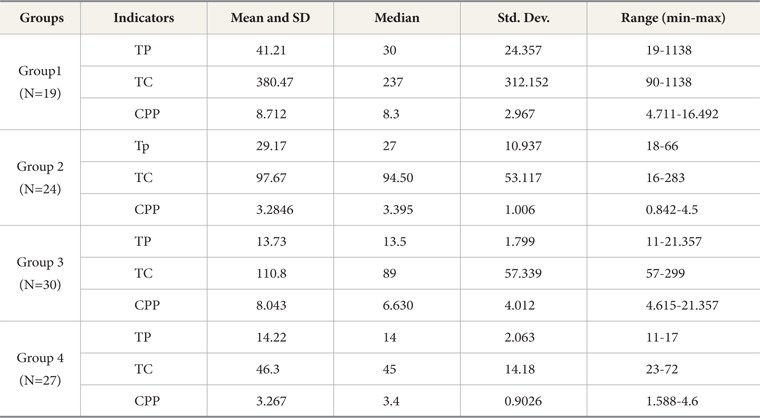
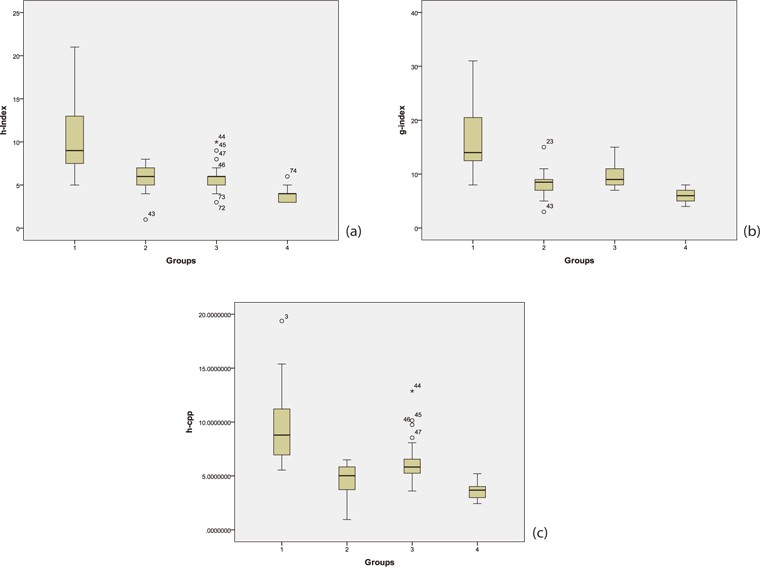
Selective researchers’ average Citation per Publication (CPP) as calculated from their group data is almost the same as for top producers (8.712 and 8.012) (See Table 3). On the other hand, big and low producer groups have the same average value of CPP (3.285 and 3.287). The four groups of Malaysian related engineers are compared for their performances via box plot illustrations (Fig. 2a-c). In accordance to h and g indices, the plots of the revised index demonstrate a better median for extreme upper and lower values.
[Table 3.] Descriptive Analysis

Descriptive Analysis
6. SIGNIFICANCE IN THE DIFFERENCE BETWEEN TYPES OF SCIENTISTS
Raan empirically concluded that the h-index is not so good for discriminating among excellent and good peer rated chemistry groups. Costas and Bordons (2007) observed that highly visible scientists might be underestimated. The performance evaluation of traditional metrics (total publication and total citation) and h-index is observed to be similar in the case study at institutional level for two groups (RU and non-RU Malaysian universities) in engineering departmental data. We found that only CPP has an exception for RU and non-RU universities (Tahira, et al., 2013). On the other hand, at researcher level, Coastas and Bordons (2008) compared the h and g-indices for four group analysis. They argued that the g-index is slightly better in distinguishing author due to a longer core. Schreiber (2010) also made such observation.
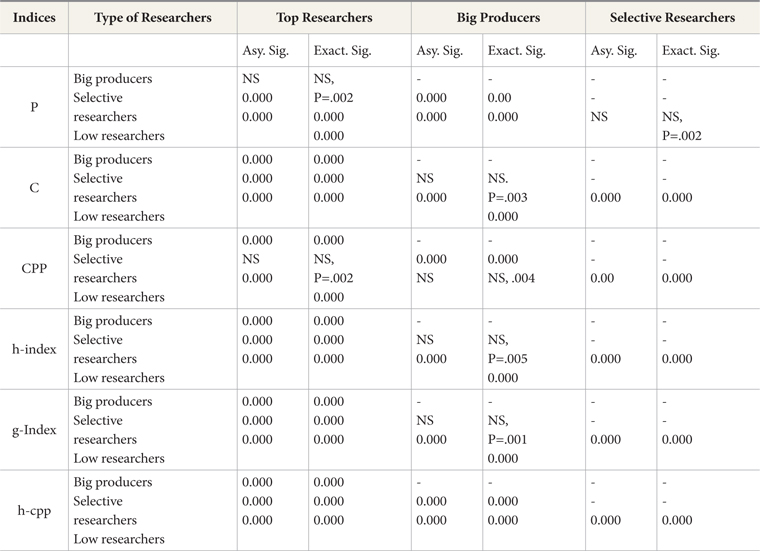
In order to determine if the proposed revision creates any difference between types of scientists, we employed Mann-Whitney U on six variables as shown in Table 4. We hypothesized that these indices are good for discriminating at group level. The test statistics is examined by the Asymptotic Sig. (2-tailed) and Exact Sig. (2-tailed) and with their point of probability.
[Table 4.] Statistical Significance in Differences Between Types of Scientists (Mann-Whitney U)

Statistical Significance in Differences Between Types of Scientists (Mann-Whitney U)
With reference to h and g indices, we can see no significant difference between big producers and selective researchers, whereas the h-cpp does discriminate among all groups including big producers and selective researchers. In Coastas and Bordons’ (2008) case, similar findings were observed for these two groups of Natural Resource Scientists in relation to h and g indices. They argued that the g-index is slightly better because it is sensitive to selective scientists, and this group shows in average a higher g-index/h-index ratio and better positioning in g-index ranking.
7. VALIDATION OF REVISED INDEX
High correlation is observed in several studies among h-type indices. On the basis of correlation, it is not justified to differentiate and make a difference among the performance of different indices. For the evaluation of models in Table 1, we apply correlation analysis and three stage statistical techniques: Multiple regressions (R) with their Mean Square Error (MSE) and Mean Absolute Error (MAE). MSE and MAE can help out to differentiate the performance of these models better (Willmott & Matsuura, 2005).
At first, we evaluate the case of the 100 Malaysian related engineers and after that we re-examine a dataset of the 100 most prolific economists of in Tol’s study for the same set of indices.
8. MALAYSIAN RELATED ENGINEERS CASE
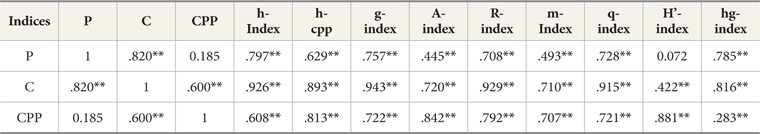
A whole set of h-type indices are considered for the first case (Table 5); the results indicate that all indices show a high correlation with the traditional metrics, but this relation is stronger with the OII. Only
[Table 5.] Results of Correlation Matrix
Results of Correlation Matrix
The proposed model (h-ccp) exhibits a high significant ‘R’ like other studied indices with the exception from g and R, while low values of MSE and MAE are observed for h-cpp compared to all competitors’ indices (Table 6).
[Table 6.] Results of Regression Analysis
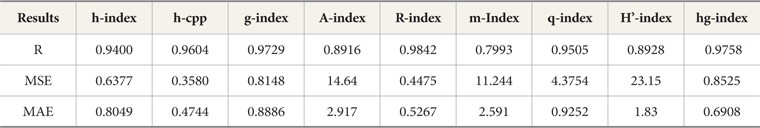
Results of Regression Analysis
9. PROLIFIC ECONOMICS RESEARCHERS
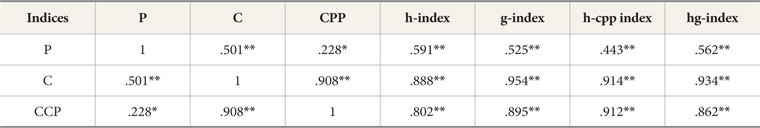
In the second case (based on Tol’s study), we could evaluate h, g, h-cpp, and hg models due to the non-availability of authors’ all citation data. High order correlation of these indices with OII (C and CPP) is presented in Table 7. It is observed that among all indices, h-cpp shows a better correlation with CPP, whereas for C, the correlation is higher than h and less for g and hg indices.
[Table 7.] Results of Correlation Matrix

Results of Correlation Matrix
All of the studied models (Table 8) have significantly high values of R (>0.9). Revised index depicts a slightly higher value of R than h and hg indices. However, h-cpp indicates low values of MSE and MAE for all cases. The revised index is intuitively reasonable and simple to compute. The new development provides a better model fit with less statistical errors.
[Table 8.] Results of Regression Analysis
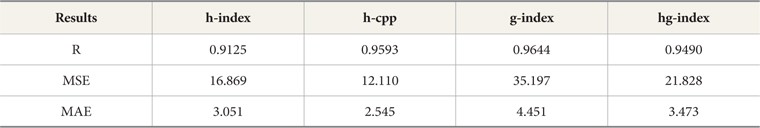
Results of Regression Analysis
The sole use of CPP as a quality measure is criticized owing to its penalizing of high productivity (Hirsch 2005, Tahira, et al., 2013). When this actor (CPP) is used with other metrics/indices as CQ, it characterizes the scientific output of researchers with aggregated values in a more balanced way as observed in cases of P-index (Parthap, 2009) and recent proposed development h-cpp. This incorporation holds h as representative of ‘Quantity of the Productive Core’ and CPP as ‘Impact of the Productive Core. Previously the actor CPP was used with P and C to equate with the value of h-index’ (Schubert & Glanzel, 2007; Parthap, 2010).
In order to tackle the implicit disadvantages of h-index, we have proposed a revision named
The beauty of the revised index is working closely with the h-index theory and inclusion of the implicit dimensions with a sort of normalization in dataset. Its value can be greater, equal, or less than the classic h-index. A single number cannot reflect all aspects (van Raan, 2005). Although this revision checks the h-index robustness as several other h-type indices: g, hg, q2 etc., h-cpp as a composite indicator can be more informed, economical, and robust for RPE and incorporates the reservations of a good index for research. The fact that stands out as fundamental is the need to address the existing underpinnings logically to incorporate the reservations of a good index for research evaluation purpose in a single composite number. Another possibility is to bracket CPP with h-index in one set (representing both quantity and impact core) for evaluation purposes rather than use of CQ. We suggest more discussion and analysis at different aggregate levels with various composite indices to explore the dimensions of research activity.