The PubMed database was used for retrieving data on ‘cancer biology.’ Articles were downloaded from the years 2000 to 2011. The articles were classified chronologically and transferred to a spreadsheet application for analysis of the data as per the objectives of the study.
To investigate the nature of growth of articles via exponential, linear, and logistics tests.
The year wise analysis of the growth of articles output shows that for the years 2000 to 2005 and later there is a sudden increase in output, during the years 2006 to 2007 and 2008 to 2011. The high productivity of articles during these years may be due to their significance in cancer biology literature, having received prominence in research.
There is an obvious need for better compilations of statistics on numbers of publications in the years from 2000 to 2011 on various disciplines on a worldwide scale, for informed critical assessments of the amount of new knowledge contributed by these publications, and for enhancements and refinements of present Scientometric techniques (citation and publication counts), so that valid measures of knowledge growth may be obtained. Only then will Scientometrics be able to provide accurate, useful descriptions and predictions of knowledge growth.
Cancer can be defined as a disease in which a group of abnormal cells grow uncontrollably by disregarding the normal rules of cell division. Normal cells are constantly subject to signals that dictate whether the cell should divide, differentiate into another cell, or die. Cancer cells develop a degree of autonomy from these signals, resulting in uncontrolled growth and proliferation. If this proliferation is allowed to continue and spread, it can be fatal; almost 90% of cancer-related deaths are to tumour spreading. The foundation of modern cancer biology rests on a simple principle that virtually all mammalian cells share similar molecular networks that control proliferation, differentiation, and cell death.
Phenomenal advances in cancer research have given an insight into how cancer cells develop (Hejmadi, 2010). The growth of literature is a key work for all scholars and students of comparative literature (Chadwick, 1986). The changes in the size of literature over a specific period are termed as growth literature. Gilbert (1978) has reviewed the existing literature on the indicators of growth of knowledge in scientific specialties, and has listed many ways of measuring it, noting their strengths and limitations and commenting, at the same time, on their uses. Gupta, Sharma, and Karisiddappa (1977) suggested two approaches that have normally been considered in understanding knowledge growth: (i) Qualitative and (ii) Quantitative. A qualitative approach suggests structural or descriptive models of knowledge growth, while a descriptive model uses social phenomenon to explain diffusion and creation of knowledge. A quantitative approach employs summarization of statistics to describe the observed behaviour, while applying growth and technology diffusion models and bibliometric/Scientometric techniques. Many studies have been made on the growth of literature in the field of science literature but only very few studies have been conducted on cancer biology research. Hence an attempt has been made to analyse the growth of cancer biology research literature. The authors studied only growth indicators as a pilot study for further study, viz. collaborative research trend; cross national analysis; obsolescence; etc.
• To study and explore the applicability of selected growth models in the world in cancer biology literature; • To determine the rate of growth of cancer biology literature by calculating relative growth rates and doubling time for publications; • To fit both a modified exponential curve and logistic curve for the original publications data, studying actual growth.
Literature growth studies have become very common in the field of Bibliometrics, Informatrics, and Scientometrics. Studying growth patterns in the NLM’s serials collection and in Index Medicus journals between 1966 and 1985,
The present study is confined to cancer biology literature as reflected in the PubMed database from the years 2000 to 2011.
The PubMed database was used for retrieving data on ‘cancer biology’. Articles were downloaded covering the years 2000 to 2011. The articles were classified chronologically and transferred to a spreadsheet application, and the data is analysed as per the objectives of the study.
To investigate the nature of growth of articles via exponential, linear, and logistic tests. The exponential growth is defined as
Where
a = the initial size of literature, i.e. at time t=o and b, the continuous growth rate is related to the percentage by which the size increases each year.
The logistic has a lower limit and an upper limit or a ceiling beyond which the size cannot grow, and can be represented mathematically as
Where,
U = expected size of literature
K and
Similarly, the linear growth is represented as
Relative Growth Rate (RGR) and Doubling Time (Dt) has been applied. RGR means the increase in the number of articles per unit of time. The mean RGR of articles over the specific period of interval is represented as
Rt = Relative Growth Rate of articles over the specific period of time
log
log
Similarly, RGR of subject articles has increased in number of articles per unit of time. The mean RGR of subject articles Rt(SA) over specific period of time is determined as
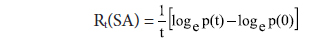
Rt(SA) = Relative Growth Rate of articles over the specific period of time
log
log
Dt (Doubling Time) has been calculated using the following formula:

Dt (Doubling Time) is directly related to RGR and is defined as the time required for the articles to double in number from the existing amount. If the number of articles in a subject doubles during a given period, then the difference between logarithms of number at the beginning and at the end of this period must be the logarithm of the number 2. We used a Napier logarithm and so the taken value of log
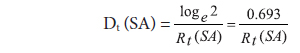
Here, Dt (SA) = average doubling time of subject articles
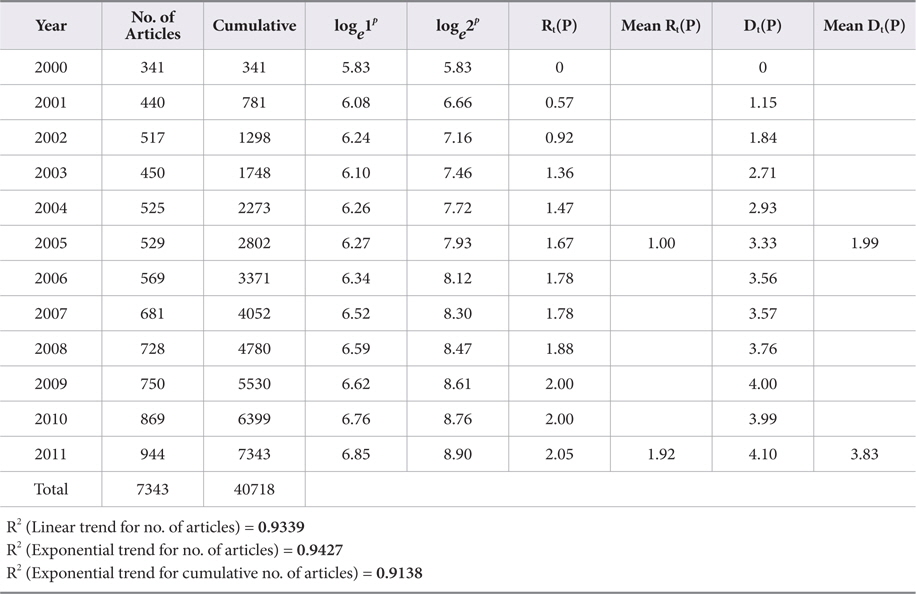
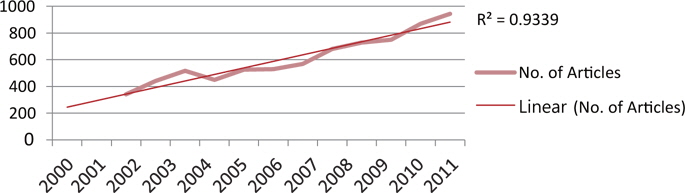
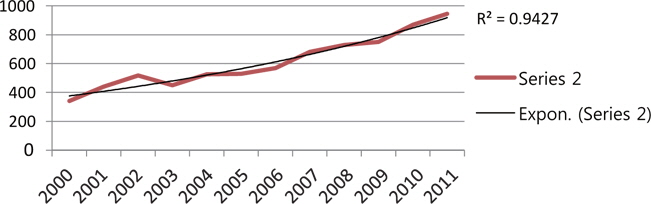
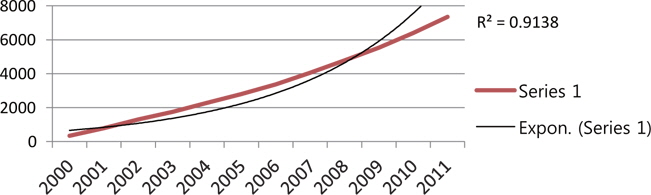
As Table 1 clearly indicates, the value of an average RGR of articles Rt(P) increased gradually from 0.57 to 2.05. Correspondingly, the values of Doubling Time of the publication of articles Dt(P) increased gradually from 2002 (1.84 years) to 2011 (4.10 years). The mean relative growth Rt(P) for the first 6 years (from 2000 to 2005) indicates a growth rate of 1.00, whereas for the latter 6 years (from 2006 to 2011) it increased to 1.92. The linear and exponential growth trend is fitted to number of articles for the years 2000 to 2011. Table 1 and Figs. 2 and 3 reveals that the R2 value for the exponential trend (0.9427) is more than that of the linear trend (0.9339); this indicates that the exponential trend is more suitably fitted as compared to the linear trend. Further, the exponential trend is fitted to cumulative number of articles from 2000 to 2011. The R2 value for this trend is 0.9138; this shows 91.38% variation observed from the cumulative number of articles.

Relative Growth-rate (RGR) and Doubling Time (Dt) of Articles in Cancer Biology from 2000 to 2011
Furthermore, mean Dt(P) for the first six years was 1.99 and increased to 3.83 in the latter six years, i.e. from 2006 to 2011. It shows that the mean relative growth of cancer biology literature has shown an increasing trend. This may be due to the interdisciplinary and multidisciplinary nature of research and the communication patterns of medical researchers.
The year wise analysis of the growth of articles output shows that growth is poor in the year 2000 to 2005 and then there is a sudden increases in productivity during the years 2006 to 2007 and 2008 to 2011. The high productivity of articles during these years may be due to their significance in cancer biology literature, having received prominence in research. Another reason is the research area may benefit from good infrastructure facilities in R&D institutions.
a) Since the growth of literature is on an exponential trend, medical libraries may think of resource sharing and networking options in order to avoid financial constraints;
b) Medical libraries may allocate budget for various resources scientifically.
The many papers have tried to estimate the growth of knowledge in various ways, as many questions have been raised about the validity and reliability of Scientometrics measures for this process. It appears that, for the “growth of knowledge” subfield, the time is not yet ripe for a logarithmic decline in the number of first-rate papers. There is an obvious need for better compilation of statistics on numbers of publications in the years from 2000 to 2011 in various disciplines on a worldwide scale, for informed critical assessments of the amount of new knowledge contributed by these publications, and for enhancement and refinement of the present Scientometrics techniques (citation and publication counts), so that valid measures of knowledge growth may be obtained. Also, studies of literature growth need to become more exact in the description of their models and more rigorous in the application of statistical tests to determine how well these models fit reality. Only then will Scientometrics be able to provide accurate, useful descriptions and predictions of knowledge growth.