In this study, we consider visible light communication in an indoor line-of-sight environment. It has been proved that among the multiple input multiple output (MIMO) techniques, spatial modulation (SM) performs better than repetition coding (RC) and spatial multiplexing (SMP). On the basis of a combination of SM and pulse amplitude modulation (PAM), here, we propose an enhanced SM algorithm to improve the bit error rate. Traditional SM activates only one light-emitting diode (LED) at one time, and the proposed enhanced SM activates two LEDs at one time and reduces the intensity levels of PAM by half. Under the condition of a highly correlated channel, power imbalance is used to improve the algorithm performance. The comparison between the two schemes is implemented at the same signal-to-noise ratio. The simulation results illustrate that the enhanced SM outperforms the traditional SM in both highly correlated and lowly correlated channels. Furthermore, the proposed enhanced SM scheme can increase the transmission rate in most cases.
Recently, visible light communication (VLC) has been receiving increasing attention in the field of indoor communication. It allows light to illuminate a room and transmit data simultaneously. The light-emitting diode (LED) has become the most widely used light source commercially available currently because of its long life, high luminous efficiency, and property of being radiationally harmless. Besides, it can provide a safe environment in a room without light penetration. Because its wavelength is in the range of 375–780 nm, a significant spectrum relief is provided for the crowded radio frequency (RF) spectrum of the traditional wireless communications systems. VLC is strongly applicable in places where electromagnetic radiation is restricted such as airports and hospitals because the signal carried by the light will not cause any interference. The IEEE 802.15.7 Visible Light Communication Task Group has defined a PHY and MAC standard for VLC [1].
Nowadays, faced with the possibility of data explosion, we care more about high-speed, accurate data transmission. In general, the data transmission speed of a single LED can reach 500 Mbps. A number of modulation schemes are introduced in [2] for VLC, such as pulse position modulation (PPM), dual header pulse interval modulation (DH-PIM), and orthogonal frequency division multiplexing (OFDM). Multiple input and multiple output (MIMO) techniques are one of the most effective ways of increasing data transmission speed. Further, indoor communication should be equipped with multiple lights for ensuring sufficient illumination. The concept of optical spatial modulation (OSM) was proposed in [3]. Different from SM in RF, the transmitted signals must be real rather than complex. Mondal et al. [4] analyzed the spatial multiplexing of VLC and enhanced the multiplexing performance. Fath and Haas [5] compared different MIMO techniques for optical wireless communication in indoor environments under the condition of direct line of sight (LOS). Among the three algorithms, namely repetition coding (RC), spatial multiplexing (SMP), and spatial modulation (SM), SM outperforms SMP in terms of robustness in a highly correlated channel and RC in terms of the spatial efficiency. The channels of indoor VLC are highly correlated between each other [3]. Mesleh et al. [6] suggested that transmitter-receiver alignments can reduce this correlation. Fath et al. [7] proposed coded spatial modulation in which convolutional code was used. It was proved that this channel coding algorithm could overcome the effect of the highly correlated channel but with poor efficiency.
For VLC, Fath and Haas [5] used a combination of SM and pulse amplitude modulation (PAM) to transmit multiple bits of information. SM activates only one LED at one time and the location of the LED carries a certain amount of information. However, when only one LED is activated, the multiple brightness levels of PAM cause a high bit error rate (BER). To improve the BER performance, in this paper, we propose an enhanced SM algorithm in which two LEDs are activated at one time, and half the brightness levels are used to maintain a constant transmission rate. For each LED, the transmission power is reduced by the square root of two in order to provide the same signal-to-noise ratio (SNR).
The remainder of this paper is organized as follows: in Section II, the basic channel model is presented. Section III describes the algorithm of the conventional SM and the enhanced SM as well as the demodulation method. The simulation results are presented in Section IV. Finally, Section V presents the conclusion of this paper.
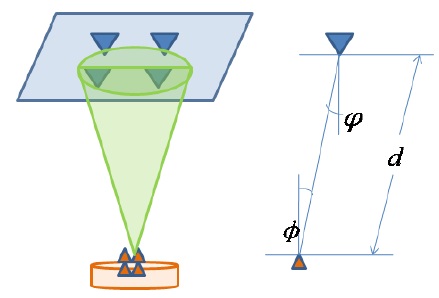
Our system model is shown in Fig. 1. In our model, each receiver with multiple detectors works under a certain zone of a group of LEDs. It is assumed that different zones would not have any interference with each other. Each group of LEDs has multiple input sources. Our model assumes that the receiver is fixed, and the distance between the lights is relatively close.
Considering that the system is under the LOS condition, we can express the received signal as

where s denotes the signal vector to be transmitted and n represents the additive white Gaussian noise (AWGN) with zero mean, double-sided power spectral density
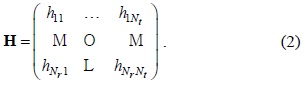
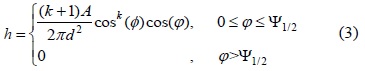
The element

where and Փ1/2 denotes the transmitter semiangle (at half power), which is assumed to be 15°. Furthermore, ψ1/2 denotes the field-of-view (FOV) semiangle of the receiver.
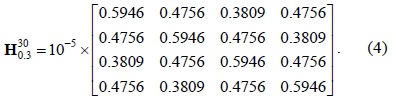
The experiment is set in a room with a ceiling height of 3m and a table height of 0.75 m. Four lights are located on the ceiling, and a receiver with four detectors is located on the table. The distance between the adjacent light sources is adjustable in our simulation (here, it is set to 0.3 m for example), and the distance between detectors is 0.1 m. The channel matrix is generated as follows when the FOV of a detector is set to 30°:

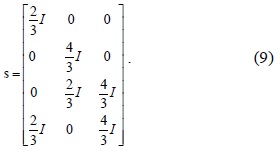
If FOV decreases to 10°, the channel matrix becomes
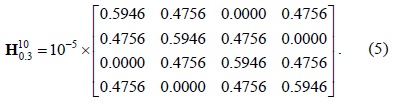
Obviously, in (5), the channel coefficient between LED 3 and detector 1 becomes zero and vice versa, making the channel less correlated. If FOV decreases further to 5°, the channel matrix becomes
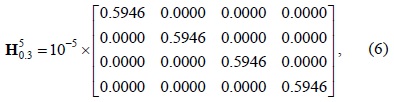
which produces a completely independent channel.
Multiple signal bits are transmitted at one time by using a combination of different brightness levels and spatial locations of LEDs. Thus, the signal bits are mapped to the spatial information and different intensities.
Traditional SM allows one LED to be activated at one time, and our enhanced SM activates two LEDs at one time, with the mapping methods as specified in Tables 1 and 2, respectively.
[Table 1.] Traditional spatial modulation mapping
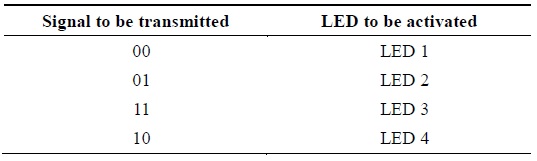
Traditional spatial modulation mapping
[Table 2.] Enhanced spatial modulation mapping
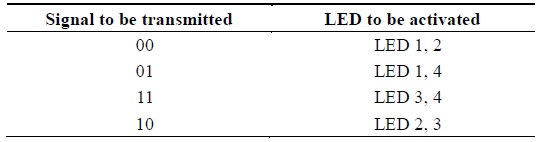
Enhanced spatial modulation mapping
It can be seen from Table 2 that two types of signals, which differ in two bits, are transmitted by totally different LEDs in order to reduce the BER. For example, ‘00’ activates LEDs 1 and 2, and ‘11’ activates LEDs 3 and 4.
>
B. Pulse Amplitude Modulation
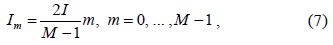
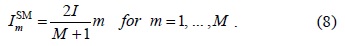
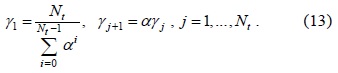
PAM is used to modulate the intensities of SM. For general modulation, the intensities are given as follows:

where

Notice that the mean power does not change after the modification. If

Each row stands for the corresponding number of light and each column stands for a time slot. Every four bits are regarded as a group; further, the former two bits are mapped to the related LEDs, and the latter two bits to the two level intensities.
The comparison of the transmission rate of the enhanced SM and the traditional SM is analyzed as follows: The transmission rate of traditional SM measured in bits is with
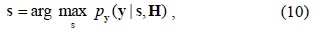
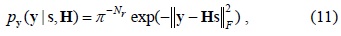
The demodulation is based on the maximum likelihood (ML) principle with perfect channel knowledge and ideal time synchronization at the receiver side. In [9], the researchers demonstrated that this is the optimal detection of SM. The detector decides the vector with the minimum Euclidean distance by using the following equation:

where

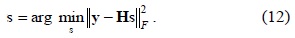
where denotes the Frobenius norm. Thus, the detection becomes

In the cases of both the traditional SM and the enhanced SM, every LED has the same average intensity. However, Fath and Haas [5] have shown that an appropriate power imbalance among the LEDs may influence their performance in terms of the BER.
The induced power imbalance can be calculated by
The factor can neither be too large nor too small, which will cause a large energy loss or little difference between each light, respectively. It has been proved that a value of around 1 dB is a good choice for
When the channel is highly correlated, this scheme can be used in our algorithm to improve performance, which is not influenced by the transmission rate or the SNR.
In the case of the traditional SM, in which only one LED is activated at one time, the energy transmitted by the light is proportional to the square of the intensity, that is,
BER analysis is an effective way to compare the system performance. The simulation is based on a Monte Carlo simulation in MATLAB, and the BER is calculated using a considerably large number of transmitted signal bits, which are set to 105. Considering that channel H has the attenuation level of 10-5 , and the noise is set at this level, we set the magnitude of
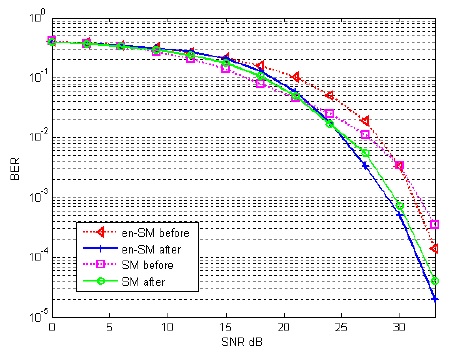
Fig. 2 shows the performance before and after the power imbalance when the distance of each LED=0.3 m and the FOV=30°. It can be concluded that the power imbalance with
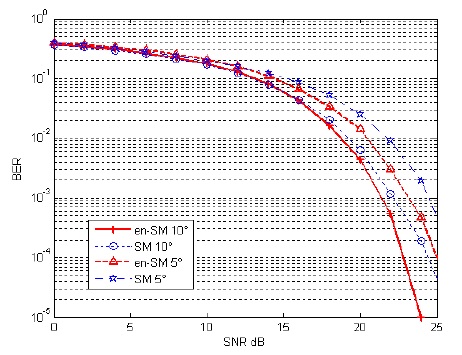
Fig. 3 shows the simulation results obtained when the distance of each light=0.3 m and the FOV=10° and 5° in the case of lowly correlated channels. The results show that under the condition of traditional SM, the BER does not reach 10-3 until the SNR reaches 23 dB. In the case of enhanced SM, in contrast, the BER meets the bound when the SNR is 21 dB. Therefore, we can conclude that the proposed algorithm outperforms the former one in this case.
In the case of the independent channel (5°), since there is too much attenuation, both algorithms are worse than in the case of 10°. However, this demonstrates that if any decorrelation schemes are used in the channel, the enhanced SM will still exhibit a better performance.
In this paper, we propose an enhanced SM algorithm for indoor VLC. The simulation results show that the proposed algorithm outperforms the traditional SM in terms of the BER when the SNR is the same at the transmitter side. The proposed algorithm provides the transmitter with diversity and maintains the same transmission power. Furthermore, it increases the transmission rate as compared to the traditional SM. If the channel is highly correlated, the power imbalance can be used to improve the algorithm performance. If the channel is lowly correlated, the proposed algorithm can exhibit a better performance. Therefore, reducing the channel correlation will be considered in future works.