Nonmedical use of prescription stimulants such as methylphenidate (MPH) and amphetamine (AP) by normal persons has been increased to improve cognitive functions. Due to high potential for their abuse, reliable analytical methods were required to detect these prescription stimulants in biological samples. A direct injection liquid chromatography-tandem mass spectrometric (LC-MS/MS) method was developed and implemented for simultaneous determination of MPH, AP and their metabolites ritalinic acid (RA) and 4-hydroxyamphetamine (HAP) in human urine. Urine sample was centrifuged and the upper layer (100 µL) was mixed with 800 µL of distilled water and 100 µL of internal standards (0.2 µg/mL in methanol). The mixture was then directly injected into the LC-MS/MS system. The mobile phase was composed of 0.2% formic acid in distilled water (A) and acetonitrile (B). Chromatographic separation was performed by using a Capcell Pak MG-II C18 (150 mm × 2.0 mm i.d., 5 µm, Shiseido) column and all analytes were eluted within 5 min. Linear least-squares regression with a 1/x weighting factor was used to generate a calibration curve and the assay was linear from 20 to 1500 ng/mL (HAP), 40-3000 ng/mL (AP and RA) and 2-150 ng/mL (MPH). The intra- and inter-day precisions were within 16.4%. The intra- and inter-day accuracies ranged from -15.6% to 10.8%. The limits of detection for all the analytes were less than 4.7 ng/mL. The suitability of the method was examined by analyzing urine samples from drug abusers.
The psychostimulants methylphenidate (MPH) and amphetamine (AP) are the most commonly prescribed drugs for treating Attention-Deficit/Hyperactivity Disorder (ADHD).1,2 They are known to boost and balance levels of neurotransmitters and considered to be the primary pharmacotherapy drugs for ADHD. The result of these medications helps to improve the signs and symptoms of inattention and hyperactivity.3-5
MPH is extensively metabolized in the human liver and its main urinary metabolite is ritalinic acid (RA), as the deesterified product,6,7 while AP is metabolized to benzoic acid, 1-phenylpropan-2-one and 4-hydroxyamphetamine (HAP), of which the active sympathomimetic amine is HAP.8
Recently, the incidence of ADHD diagnosis has significantly increased, along with the use of prescription psychostimulants.9,10 In addition, the illicit use of prescription ADHD medications has gained increasing interest among students in Republic of Korea and other countries.11-14 Although most ADHD patients use their medications appropriately, the increased number of prescriptions may increase the illicit use of these drugs for nonmedical purposes.15 The Korean Ministry of Food and Drug Safety is concerned that these ADHD medications are the most commonly abused drugs among teenagers and that the use of these psychostimulants may play a role in the development of drug addiction.16 MPH and AP were registered on the official list of controlled substances by the Korean government due to their high abuse potential.
The illicit use of ADHD medications necessitates convenient and rapid analytical methods in biological samples for forensic drug testing. Several analytical methods have been developed for detecting MPH (Ritalin) or AP (Adderall) in biological samples. They include the enzyme-linked immunosorbent assay (ELISA),17 gas chromatography-mass spectrometry (GC-MS),17-19 and liquid chromatography-tandem mass spectrometry (LC-MS/MS),17,20-22 but none of these studies included the confirmation method for simultaneous determination of MPH and AP in urine. The analysis of AP and HAP in urine has been generally carried out by GC-MS methods,18,19 whereas LC-MS/MS has been proposed for the analysis of MPH and RA.17,20-22 The major advantages of LC-MS/MS technique over GC-MS are its applicability to broad range of compounds, high specificity, direct detection of hydrophilic analytes without derivatization and a high degree of verification by using multiple reaction monitoring (MRM) transitions.23-25 Due to these advantages, we used LC-MS/MS method for simultaneous analysis of MPH, RA, AP and HAP in urine.
In this study, we developed a simple and rapid LC-MS/MS method for simultaneous determination of MPH, AP and their metabolites, RA and HAP, using simple sample preparation and direct injection of diluted urine. The method was validated and its applicability was confirmed by analysis of real urine samples.
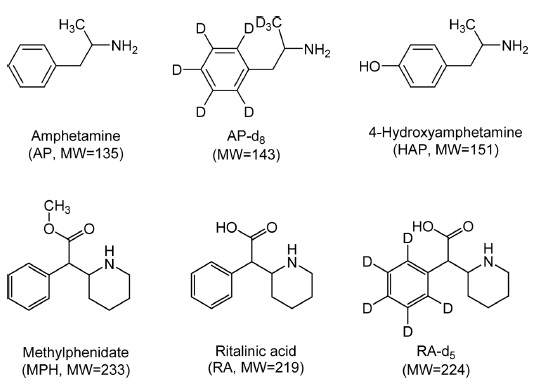
AP and AP-d8 were obtained as solutions from Cerilliant (Austin, TX, USA) while MPH and RA were purchased from Sigma-Aldrich (St. Louis, MO, USA). HAP hydrobromide was obtained from USP (Rockville, MD, USA). RA-d5 was obtained as a solution from Isotech (Miamisburg, OH, USA). Figure 1 shows the chemical structures of the analytes and deuterated internal standards (IS). HPLC-grade acetonitrile was purchased from JT Baker/Avantor (Center Valley, PA, USA). The water was purified using a Direct-Q water purification system (Millipore, Bedford, MA, USA). Formic acid was purchased from Sigma-Aldrich. All other chemicals were of analytical grade or higher. Polypropylene tube (1.5 mL) was purchased from Eppendorf (Safe-Lock tube, Hamburg, Germany).
>
Standard solutions and mobile phase
The working standard solutions (0.1, 1.0, and 10.0 µg/mL) of MPH, RA, AP and HAP were prepared by appropriate dilution with methanol. The internal standard (IS) working solution was prepared in methanol to give a combined working solution of 0.2 µg/mL for AP-d8 and RA-d5. All of these solutions were stored at -20℃ in amber bottles before use.
Mobile phase A was 0.2% formic acid in water and mobile phase B was acetonitrile. Each solution was sonicated for 5 min in an ultrasonic bath and filtered using 0.45 µm membrane filters (Millipore, USA).
>
Preparation of urine samples
Blank urine samples were donated by the laboratory staff. Urine samples were obtained from the Narcotics Departments at the District Prosecutors’ Offices in the Seoul metropolitan area and sample preparation steps were followed. Briefly, each urine sample was centrifuged and the upper layer (100 µL) was mixed with 800 µL of distilled water and 100 µL of IS (0.2 µg/mL in methanol). Then 3 µL of prepared sample was injected into the LCMS/MS system.
The HPLC system consisted of an Agilent 1290 Infinity series handheld control module, binary gradient pump, vacuum degasser, autosampler and thermostated column compartment (Santa Clara, CA, USA). The analytical column was a Capcell Pak MG-II C18 (150 mm × 2.0 mm i.d., 5 µm, Shiseido). Mobile phase A was 0.2% formic acid in water while mobile phase B was acetonitrile. The flow rate was 400 µL/min. The gradient was started with 10% of mobile phase B, increased to 30% at 4.5 min, 90% at 5 min and held at 90% B for 0.5 min. The column was reequilibrated at 10% B for 2.5 min.
The HPLC was coupled to an API 4000 triple-quadrupole mass spectrometer equipped with a TurboIonSpray source (AB SCIEX, Foster city, CA, USA). Electrospray ionization (ESI) was carried out in the positive mode using nitrogen as the nebulizing, turbo spray and curtain gas, with the values set to 45, 75 and 30 (arbitrary units), respectively. The turbo-gas temperature and the spraying needle voltage were set to 650℃ and 5500 V, respectively. The mass spectrometer was operated with unit (0.7 full width at half height) resolution for Q1 and Q3 quadrupoles. Multiple reaction monitoring (MRM) detection was performed using nitrogen as the collision gas set at 7 (arbitrary unit). The mass spectrometric parameters were determined as follows: declustering potential (DP), entrance potential (EP), collision energy (CE), collision cell exit potential (CXP). Analyst 1.6 software was used for equipment control, data acquisition and integration.
>
Validation of the Analytical Method
The method was validated by measuring the selectivity, linearity, limit of detection (LOD), lower limit of quantification (LLOQ), precision and accuracy, recovery, matrix effect and process efficiency (PE, %) according to the protocols.26,27
To evaluate the selectivity, ten different blank urines were analyzed for potential interferences from the matrix. The apparent responses at the retention times of the analytes and IS under investigation were compared to the response of the analytes near the LLOQ.
The LOD was calculated based on the concentration corresponding to a signal plus 3 standard deviations from the mean of ten replicates of blank urine. The LLOQ was defined as the lowest concentration on the calibration curve with a precision (% CV) less than 20% and an accuracy (% bias) within ±20%.
The linearity of the method was evaluated over the concentration range of 20, 50, 100, 200, 500, 750 and 1500 ng/mL (HAP), 40, 100, 200, 400, 1000, 1500 and 3000 ng/mL (AP and RA), and 2, 5, 10, 20, 50, 75 and 150 ng/mL (MPH) and expressed by the determination coefficient (r2). The calibration curve was constructed using two different samples for each point on the curve to ensure the precision of the system. The linear least-squares regression with a 1/x weighting factor was used to generate a calibration curve.
Quality control (QC) samples at four different concentrations (LLOQ, low, mid and high) were prepared by spiking the blank urine with known amounts of each analyte. QC samples were prepared to 20, 40, 300 and 1000 ng/mL (HAP), 40, 80, 600 and 2000 ng/mL (AP and RA) and 2, 4, 30 and 100 ng/mL (MPH) in blank urine, respectively. The intra-day precision and accuracy of the method were established by six independent determinations of the QC samples in each of the three experimental assays (n=18). The inter-day precision and accuracy were established by six independent determinations of the same QC samples on four independent experimental assays of the aforementioned replicates (n=24).
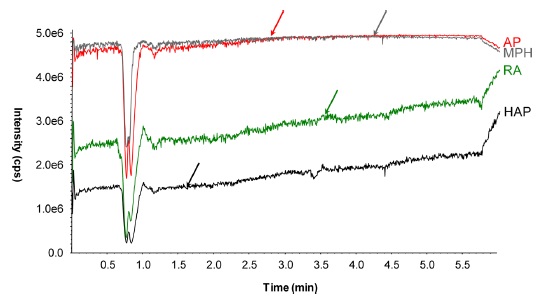
Matrix effect was studied by post-column infusion of HAP, AP, RA, and MPH individually at 10.0 µg/mL with a Harvard Syringe Pump (Holliston, MA, USA) at a flow rate of 10 µL/min. The most intense MRM transition for each analyte was monitored. The pre-treated urine sample was injected during post-column infusion of the analyte.
PE was evaluated via two sets of samples as described by Matuszewski et al..28 Set A contained analytes and IS in mobile phase. In the set B, urine samples were spiked with analytes and IS. By comparing the peak areas obtained from the analysis of two sets of samples, PE (%=B/A × 100) was assessed. PE was determined at low, middle and high QC concentrations for each analyte.
MS/MS parameters were tuned and optimized to achieve maximum sensitivity independently for each analyte. The ion optics and tuning parameters were set to increase the sensitivity for the analytes. The ESI interface parameters, such as nebulizing, turbo spray and curtain gas, were also optimized by flow-injection analysis for each analyte in positive ionization mode.
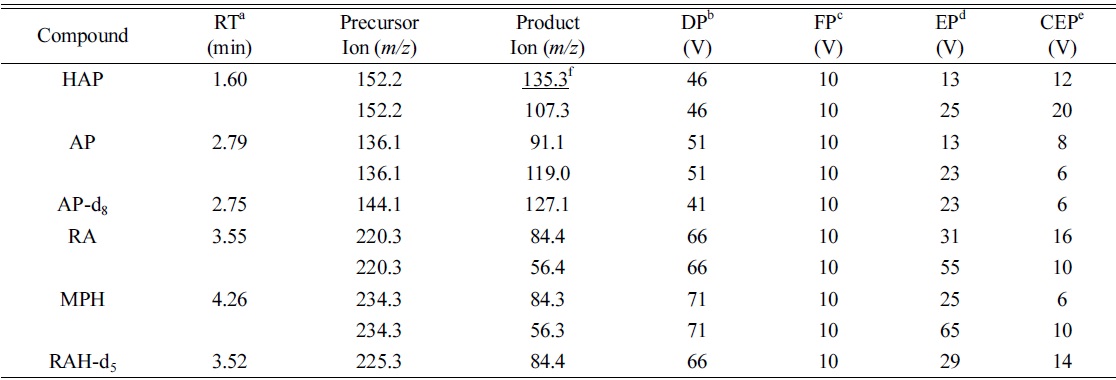
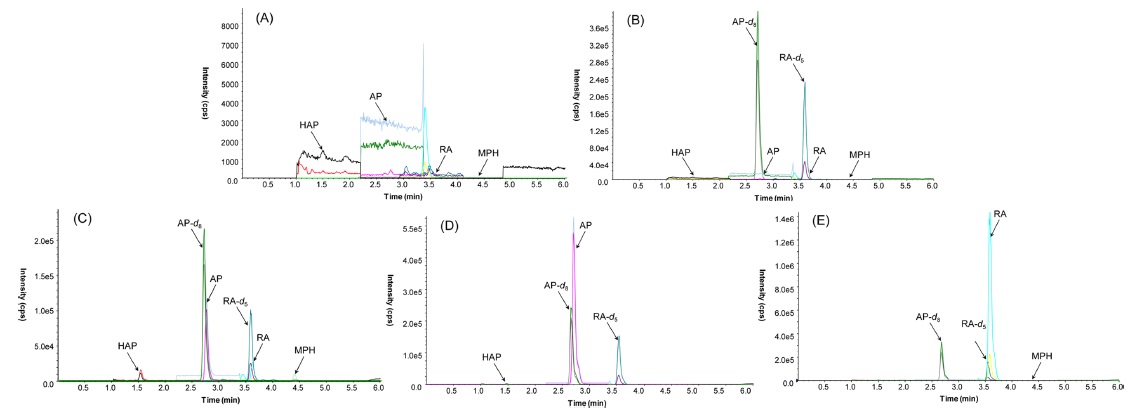
Figure 3(C) presents a representative MRM chromatogram obtained following the LC-MS/MS analysis of 20 ng/mL of HAP, 40 ng/mL of AP and RA, and 2 ng/mL of MPH spiked in drug-free urine. The four analytes were completely separated in 5 min, and the order of elution was clearly observed on the MRM chromatograms. A 3.5 min equilibrium time was needed at the end of each run for elution of possible interference compounds. Table 1 lists the monitored MRM transitions, retention times and respective mass spectrometric parameters of the analytes and IS.

Retention times, MRM transitions and compound dependent parameters for LC-ESI-MS/MS analysis of the analytes and internal standards (IS)
>
Evaluation of the Validation Data
The method was validated before being applied to real samples by evaluating the selectivity, linearity, LOD and LLOQ, precision and accuracy, and PE. The selectivity of the method was measured by comparing the chromatograms of different samples of blank urine and spiked urine. A representative chromatogram for the selectivity of assay was shown in Figure 3. All blank urine samples were found to be free of interferences at the retention time of the target MRM transitions for the analytes.
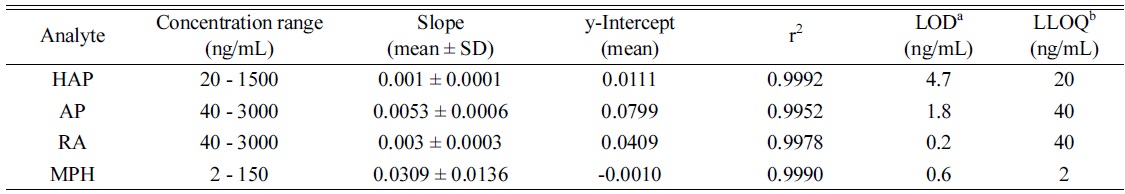
Table 2 summarizes the linear dynamic ranges, the determination coefficient (r2), LOD and LLOQ data. The calibration ranges for AP and RA were established in order to cover the majority of the real urine sample concentrations based on previous studies.8,20,22 The calibration curves for the analytes were linear in the range of the tested concentrations with the coefficient of determination (r2 ≥ 0.9952). All the linearity coefficients of the calibration curves were higher than the accepted criterion (r2 > 0.99), indicating an acceptable linear relationship.29 The LOD and LLOQ values were 0.2-4.7 ng/mL and 2.0-40 ng/mL for the analytes, respectively.
Method calibration
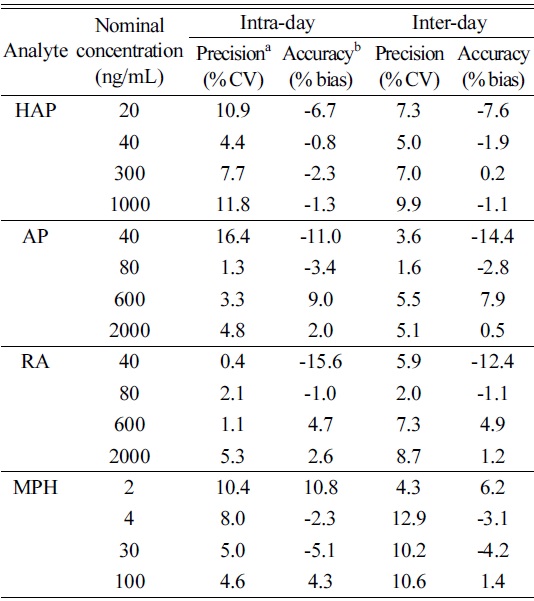
Table 3 summarizes the quantitative validation parameters. These data were within the acceptance criteria of ±15% of nominal concentration for low, middle and high QC concentrations except for the LLOQ, where it should not deviate by more than ±20%. The intra- and inter-day precisions were within 16.4% and 12.9% respectively, and the intra- and inter-day accuracies were between -15.6-10.8% and -14.4-7.9%, respectively.
[Table 3.] Intra- and inter-day precision and accuracy for the LLOQ and QC samples

Intra- and inter-day precision and accuracy for the LLOQ and QC samples
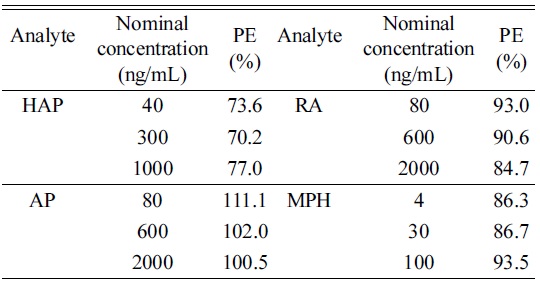
Matrix effect from injection of diluted urine was monitored for the signals from the infused analytes (Figure 2). No significant ion suppression or enhancement virtually presented at the retention time of HAP, AP, RA, and MPH during post-column experiment. The result for process efficiency was shown in Table 4. PE (%) range was 70.2-77.0% (HAP), 101.0-111.1% (AP), 84.7-93.0% (RA), and 86.3-93.5% (MPH). This indicates that over the range of concentrations tested, the PE remained consistent. These results were considered to have been unaffected by ion suppression or enhancement due to sample matrix.
[Table 4.] Process efficiency (PE) for the analytes
Process efficiency (PE) for the analytes
Case 1
A 15-year-old male bought 2 grams of AP from the Netherlands through the Silk Road website where internet users can buy and sell illegal drugs anonymously due to its routing service called Tor, an anonymity network that allows online users to browse anonymously without potential traffic monitoring. He took a snort of AP in powder form with his friend. He admitted the consumption of AP. A high concentration (369.3 ng/mL) of parent AP was found in his urine, but the concentration of HAP was below the LLOQ. The result is shown in Figure 3(D).
Case 2
A 38-year-old male failed to get prescribed MPH and so ordered MPH from an online retailer in Philippines. A witness confirmed that he took it orally, but he denied any consumption. The urinary concentration of RA was 2841 ng/mL while parent MPH was not detected. The resulting chromatogram is shown in Figure 3(E). Unlike urinalysis, both parent MPH and its metabolite RA were quantified in his hair.
A rapid and simple LC-ESI-MS/MS method for determination of MPH, AP, RA and HAP in urine was developed and validated. The method was shown to provide a reliable, fast and useful means of treating a large number of volume-limited samples and speeding up the analysis. The applicability was proven by analyzing forensic urine samples.