In the current era of data-intensive services, the handling of big data is a crucial issue that affects almost every discipline and industry. In this study, we propose a classification method for large volumes of numeric data, which is implemented in a distributed programming framework, i.e., MapReduce. The proposed method partitions the data space into a grid structure and it then models the probability distributions of classes for grid cells by collecting sufficient statistics using distributed MapReduce tasks. The class labeling of new data is achieved by k-nearest neighbor classification based on Bayesian inference.
The recent technological advances in sensors and storage devices, as well as the advent of various multimedia-based applications, mean that huge volumes of data are accumulated, which need to be processed. Big data present new practical and theoretical challenges in terms of the volume of data, the variety of data types, and the speed of processing. Thus, various platforms and algorithms have been developed and put into practice to address these issues [1, 2, 5, 6].
In the present study, we address the problem of constructing classifiers from a big data training set that comprises continuous attributes. As the volume of data increases, classification techniques that require multiple-pass processing experience severe resource demands. Thus, existing algorithms can be parallelized to handle this problem, or new single-pass algorithms need to be developed. In general, many machine learning algorithms assume that the training dataset is not large and they have been developed for training datasets that are moderate in size. Indeed, some of these techniques are not considered to be applicable to high dimensional data due to the curse of dimensionality. However, big data application domains can be free from the curse of dimensionality because the volume of data is sufficiently large.
The
The remainder of this paper is organized as follows. Section 2 provides a brief introduction to the Hadoop framework and the MapReduce programming paradigm, as well as
Considerable amounts of time and space are required to handle large volumes of data. Occasionally, it might not be possible to accommodate a large dataset on a single computer. This is one of the main reasons for using a distributed file system, where a file system can be networked among multiple servers to manage big files. The servers in the distributed file system need to be robust against failure because a failure at any point could cause the entire system to malfunction. Thus, the files are partitioned into blocks and multiple replicas of the blocks are stored in different servers. Hadoop is an Apache project for a distributed computing platform and it provides a distributed file system called the Hadoop Distributed File System [2].
It is not sufficient to process or analyze big data to obtain a distributed file system. Instead, it is necessary to produce a framework for developing distributed parallel processing applications that can handle big data files. A simple approach to performing a task in a distributed, parallel manner is to decompose the task into independent subtasks, where they can be processed without communication between them. The MapReduce model [1] is a programming paradigm that allows a program to be organized with independently executable processing modules called
To execute MapReduce-based programs, a framework is required to deploy them in a distributed system and to manage resources, such as instantiating multiple
2.2 k-Nearest Neighbor Classifiers
The
When a query data object arrives, a search is performed to find the
If the data occupy a high dimensional space and the number of data objects is large, it is not easy to locate the
3. MapReduce-based k-nearest Neighbor Bayesian Classifier
In this study, we consider a classification problem for a dataset that comprises numeric data with continuous attributes. Each training data object is labeled with its class. The volume of data can be huge and thus we cannot construct classifiers by scanning the training data multiple times in practical applications. The volume of data can be a bottleneck for conventional
It is assumed that the dataset
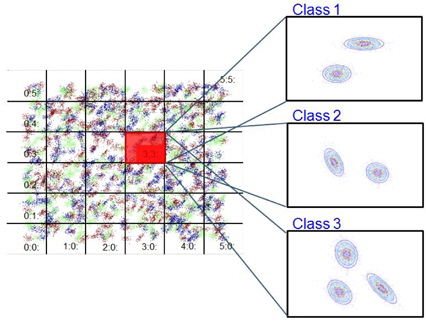
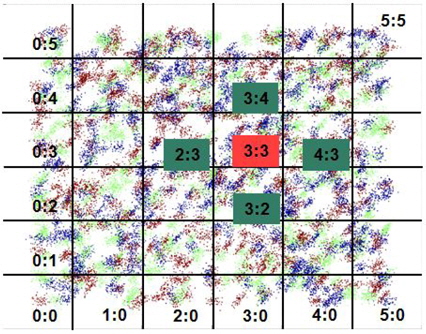
To handle large volumes of data, the proposed method organizes the data space into a grid structure where the dimension of each attribute is partitioned at equidistant intervals. This partitioning process divides the data space into cells, where each cell maintains the class-wise statistical information for the data subset that belongs to the cell. Instead of using individual training data objects, the method models them based on the probability distributions of each class. The classification of query data is performed by Bayesian inference using the prior probabilities and likelihoods of the neighboring cells of the query data.
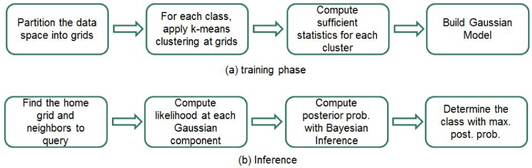
The proposed strategy has two phases: the training phase and inference phase. The inference phase comprises the following steps.
Step 1. Partition the data space into grids. Step 2. Apply the k-means clustering algorithm to class-wise data in the grids with different numbers of clusters. Determine the appropriate number of clusters for each class in the grids. Step 3. Compute the statistics for each cluster. Step 4. Build Gaussian models of the grids.
After constructing Gaussian models for the grids, class inference is performed for a query according to the following sequence.
Step 1. Find the home grid and the neighbors of a query. Step 2. Compute the likelihoods of the query for each Gaussian component. Step 3. Compute the posterior probabilities of the classes by Bayesian inference. Step 4. Determine the class of the query with the highest posterior probability.
The continuous attribute domains are partitioned into several intervals, e.g., equidistant intervals, user-specified intervals, equi-frequency intervals, or data distribution-based partitions. Data processing is straightforward for equidistant interval partitioning and user-specified partitioning, but equi-frequency interval partitioning requires that the attribute values are sorted, which is a computationally intensive task. Distribution-based partitioning requires some baseline information for each attribute, such as the means and standard deviations.
The proposed method partitions each attribute dimension at an equidistant interval. If we suppose that attribute
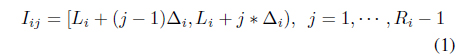


Each attribute may have a different numbers of intervals. A cell in the data space is indexed by (
When a data object

which means that we can easily locate the home cell of a data object via a simple arithmetic operation even in a high dimensional space. The neighboring cells are easily determined by the indices. The indices (

In a similar manner, the indices of

An
3.2 Class-wise k-Means Clustering for Cluster Determination
The proposed method models each grid as a mixture of Gaussians for each class. The constituent clusters are determined for each class using the
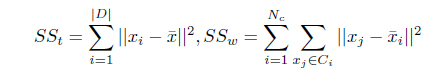
Several cluster validity indices can be used to measure how well the clusters are formed [8, 20]. The

where
, where
In a mixture of Gaussian models, it is better to merge two neighboring clusters because small condensed Gaussian components can have biased effects on Bayesian inference. To measure the proximity of two clusters, we propose a so-called separability index

where
The following strategy is used to determine the number of clusters for each class in a grid:
procedure Determine_No._of_Clusters For i = 2 to K do Apply the k-means algorithm to the dataset with i clusters Compute the RS index score RS(i) for the clustering results end Choose the number of clusters that yield the highest RS index score For each pair of clusters among the selected number of clusters Compute the separability index Sp(i, j) for the pair(Ci, Cj) If the index score Sp(i, j) > the specified threshold θs Merge the corresponding pair of clusters
3.3 Bayesian Inference and Sufficient Statistics for the Probability Distribution
Bayesian inference uses the Bayes’ rule to derive the posterior probability

In the Bayesian-based classifier, a probability model is constructed for the likelihood function from the training dataset and the prior probability is determined for each class. When a data object
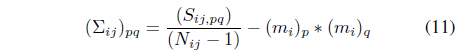
The proposed method models the probability distributions of the classes for each cell. The probability distributions are assumed to be Gaussian. Gaussian distributions can be specified by the mean and covariance matrix. The method keeps track of the sufficient statistics required for the Gaussian distributions, i.e., the numbers of data objects, sums of the attribute values, and squared sums of the attribute values for each class. To consider the correlations between attribute variables, we must maintain the sums of the products for each pair of attribute variables. Let


The sufficient statistics-based method can acquire statistical information during a single scan of the dataset, which can be updated incrementally when additional data objects are available due to the additive property of the sufficient statistics.
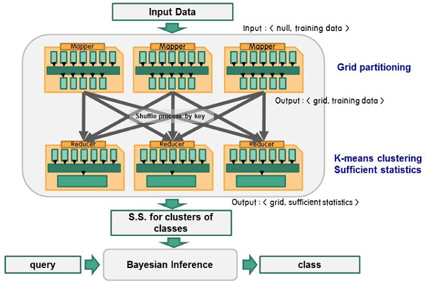
3.4 MapReduce Algorithm for Collecting the Sufficient Statistics
The following MapReduce operations are used to obtain the sufficient statistics for the mean and covariance matrix of the attribute values. The
procedure: map(key = null, value = record R) L[ ] := splits(R) Compute the index k1k2 ··· kM of the data that correspond to L[2..M + 1] Using Eq. (4) V al := ‘1’ For i := 2 to M + 1 V al := V al + “ ” + L[i] For i : = 2 to M + 1 For j:= i to M + 1 V al := V al + “ ” + L[i] ∗ L[j] write((k1k2 ··· kM,L[1]), V al)
The
procedure: reduce(key = (k1k2 ··· kM, class), values) count := 0 Sum[1..M] := 0 V ar[1..(M(M + 1)/2)] := 0 Foreach val in values L[ ] = splits(val) count := count + L[1] For i : = 1 to M Sum[i] = L[i+1] For i : = 1 to M For j := i + 1 to M V ar[i ∗ (i − 1)/2 + j] := V ar[i ∗ (i − 1)/2 + j] + L[i ∗ (i − 1)/2 + j + M + 1] Mean[1..M] := 0 for i : = 1 to M Mean[i] := Sum[i]/count Cov[1..M][1..M] = 0 For i := 1 to M For j := i + 1 to M Cov[i][j] := V ar[i ∗ (i − 1)/2 + j]/(count − 1) For i := 1 to M For j := i to M Cov[i][j] := Cov[i][j] − Mean[i] ∗ Mean[j] V al := class + “ ” + count For i : = 1 to M V al := V al + “ ” + Mean[i] For i : = 1 to M For j := i to M V al := V al + “ ” + Cov[i][j] Write(k1k2 ··· kM, V al))
The
procedure: combine(key = (k1k2 ··· kM, class), values) count := 0 Sum[1..M] := 0 V ar[1..(M(M + 1)/2)] := 0 Foreach val in values L[ ] = splits(val) count := count + L[1] For i : = 1 to M Sum[i] = L[i+1] For i : = 1 to M For j := i + 1 to M V ar[i ∗ (i − 1)/2 + j] := V ar[i ∗ (i − 1)/2 + j] + L[i ∗ (i − 1)/2 + j + M + 1] V al := count For i : = 1 to M V al := V al + “ ” + Sum[i] For i : = 1 to M For j := i + 1 to M V al := V al + “ ” + V ar[i] Write(key, V al))
3.5 Classification of New Data Using Bayesian Inference
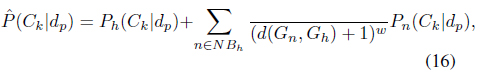
To classify a new query data, the proposed method uses the Bayesian inference rule. The MapReduce functions provide the model parameters for the Gaussian probability distributions of the classes in each grid cell. Each cell maintains the model parameters for the probability distributions of the classes. We refer to the cell that contains the query data as the home cell
The prior probability of class

The likelihood
The posterior probability

The denominator

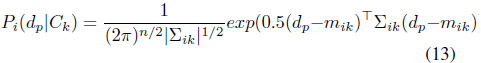
The probability support of class

where (
The final probability

The data object

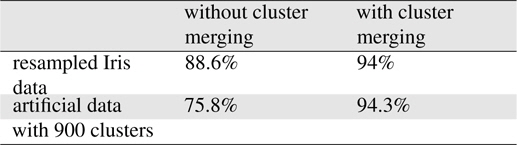
The proposed algorithm was implemented using the MapReduce libraries in Hadoop. The programs developed were executed on a Hadoop cluster with eight commodity computers. To assess the applicability of the proposed method, we applied the method to a numeric benchmark dataset: Iris[10], which comprised 150 objects with four numeric attributes and three classes. A tenfold cross-validation was performed using the dataset. To determine the appropriate probability distributions, we required a sufficiently large dataset; thus, we enlarged the dataset by sampling new data and adding Gaussian noise to the attribute values in the existing dataset, thereby obtaining a training dataset of 10,000 objects. Each attribute domain was partitioned into five equidistant intervals. The number of cells was 625. The accuracy obtained in the experiment was comparable to that obtained with the C4.5 algorithm using Iris data with 150 data objects. We found that the proposed method performed adequately in the classification of big data. The use of the
Another artificial dataset with three attributes and three classes was generated randomly using 900 Gaussian distributions, where the centroids of the covariance matrices were selected randomly. For each Gaussian distribution, 500 data points were generated that formed a cluster in the space. In the experiments, the range of each attribute was partitioned into five intervals. A tenfold cross-validation was performed using the dataset. According to the experiments, the average accuracy was 94.3%.
In other experimental settings, we changed the number of partitions of the attributes from two to six. There was no significant change in the accuracy, but there was a trade-off between the execution time and the storage required to maintain sufficient statistics for the grids as the number of partitions changed. The increase in the number of partitions decreased the data volume handled by a single reducer and more reducers were instantiated, so the degree of parallelism was also increased. Because the reducers ran the
The merging of neighboring clusters using the separability index improved the accuracy considerably, as shown in Table 1. Thus, small condensed Gaussian distributions with small determinants in their covariance matrices had higher likelihoods for queries.
[Table 1.] Effects of cluster merging

Effects of cluster merging
The MapReduce model is an efficient computational model for distributed parallel processing with big data. In this study, we proposed a grid-based Bayesian inference classification method that can handle big data.
The proposed method has the following advantages. It is a single-pass algorithm that does not require multiple scans of the training data to construct a classifier. It is very efficient at locating the neighbors because the home cell of a data query is determined by simple arithmetic computation and the neighboring cells are determined by index manipulation. It is scalable for big volumes of data because only the sufficient statistics for the probability distributions are maintained, which can be updated by simple arithmetic operations as data objects arrive. The neighboring class distribution can be visualized readily because the neighboring cells are easily located and their class probability distributions can be computed simply.
The proposed method has the following disadvantages. Fixed length interval-based partitioning of the data space might not capture the appropriate probability distributions of the classes. To mitigate this problem, we could decrease the interval lengths but there might be too many cells to be maintained in a highdimensional data space. A sufficiently large training dataset is required to ensure that each grid cell has sufficient data subsets to characterize the parameters of the probability distributions. The proposed approach is not appropriate for classification problems with small training sets but it works well for big data. The costly
Our experiments showed that the proposed system performed well as a classifier for big data. Thus, the method could be used for solving big data classification problems. In future research, we aim to extend the proposed method to the simultaneous handling of datasets with both categorical and numerical attributes.