Cells in a culture process transform with time and produce many overlapping cells in their vicinity. We are interested in a separation algorithm for images of overlapping cells taken using a fluorescence optical microscope system during a cell culture process. In this study, all cells are assumed to have an ellipse-like shape. For an ellipse fitting-based method, an improved least squares method is used by decomposing the design matrix into quadratic and linear parts for the separation of overlapping cells. Through various experiments, the improved least squares method (numerically stable direct least squares fitting [NSDLSF]) is compared with the conventional least squares method (direct least squares fitting [DLSF]). The results reveal that NSDLSF has a successful separation ratio with an average accuracy of 95% for two overlapping cells, an average accuracy of 91% for three overlapping cells, and about 82% accuracy for four overlapping cells.
Cells in a culture process transform with time. The analysis of the behavior of cells such as stem cells from the images taken during the early stage of a cell culture process is an important research topic in the fields of biology and medicine [1, 2]. Recently, automatic cell tracking has been studied to observe cell characteristics such as apoptosis, aggregation, migration, and stretching in the cell differentiation process. In the cell culture process, two more cells may touch or overlap each other and be separated from one cell [1-4].
A reliable cell tracking system should be capable of tracking well not only in individual cells but also in overlapping cells. The performance degradation of most existing cell tracking algorithms takes place when two and more different cells are overlapped or overlapped cells are divided. These errors are frequently compounded with the misclassification of the split and merge of the overlapping cell division or fusion events, resulting in erroneous cell lineages [1-4].
However, cell objects in the cell images used in the published studies were very clear and large and had an ellipse-like shape when viewed under a high-magnification optical microscope.
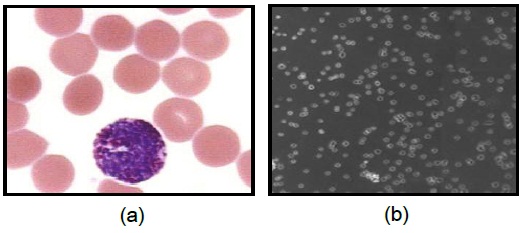
studies, researchers have used images similar to Fig. 1(a) whose background is clear and cell size is large. Fig. 1(b) contains many cells and the image quality is degraded.
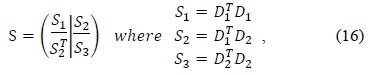
In this paper, we propose a separation algorithm for overlapping cells, which is based on two different ellipse fitting methods, namely the conventional direct least squares method and the improved direct least squares method, to split even multiple small overlapping cells. The proposed algorithm can be briefly described as follows:
We used a mixed threshold method to extract a cell from two or more overlapping cells even in an unclear image with background noise and poor illumination. First, an input cell image, which is a color or a grayscale image, was converted into a binary image by using the modified mixed threshold method. The background color of the image was white, and objects such as individual cells and overlapping cells were black in color. Second, we compared the conventional ellipse fitting with the improved ellipse fitting method based on an enhanced direct least squares method for tens of thousands of multiple small overlapping cells, as shown in Fig. 1(b).
To separate cell objects from the background, we need the binarization process for the given cell image. Upon binarization, pixels that have a higher intensity than the threshold

Automatic thresholding automatically selects an optimal threshold value for distinguishing objects from the background on the basis of their intensity distribution. There are two categories of automatic thresholding: global thresholding and local thresholding. Global thresholding selects a single threshold value from the histogram of the entire image. This method is simple, but it produces marginal noise for unevenly lighted images. In local thresholding, the threshold is determined for each pixel on the basis of its own gray value and the gray values of its neighborhood. This approach is called the adaptive thresholding method because it is adaptive to the local image characteristic. The adaptive threshold method has a high computational cost but gives good results even for a severely degraded image.
Most of the cell images obtained using optical microscopy are images with noise. In particular, we are interested in a degraded cell image because of the uneven microscope light. For our image, the adaptive threshold algorithm is good, but its computational cost is very high. Therefore, we used a mixed threshold method that modified the multistage adaptive threshold method proposed by Yan et al. [6]. The mixed threshold method chooses between a global threshold and an adaptive local threshold depending on the pixel intensity.
We use a global threshold
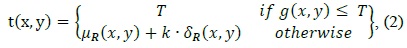
where
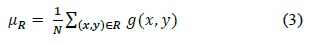
and

denote the mean and the standard deviation, respectively.
Sometimes, cells in a cell image can have holes, as shown in Fig. 1(b). This is observed when fluorescence does not stick close to the floor at the center of the cell. The next preprocessing step is to apply the flood fill algorithm to fill these holes. Finally, we extract the boundaries of the single cells and the overlapping cells. Before applying an ellipse fitting method, we split the boundaries into line segments. We use concave points on the boundaries to do this. This process involves splitting the touching cells into different ellipses, which represents separated cells. A fitted ellipse is used for representing a cell.
III. SEPARATION OF OVERLAPPING CELLS BASED ON ELLIPSE FITTING
>
A. Direct Least Squares Fitting of Ellipses
We used two types of ellipse fitting algorithms: direct least squares fitting of an ellipse by Fitzgibbon et al. [7] (hereinafter Fitzgibbon’s method) and numerically stable direct least squares fitting of an ellipse by Halir and Flusser [8] (hereinafter Halir’s method). Both these methods are non-iterative algorithms for fitting an ellipse to a set of data points. Let us briefly overview Fitzgibbon’s method.
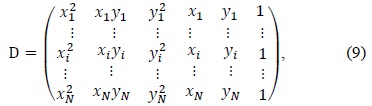
An ellipse is a special case of a general conic, which can be described by an implicit second-order polynomial as follows:

with an ellipse-specific constraint

where

The fitting of a general conic may be approached by minimizing the sum of the squared algebraic distance of points. Therefore, the ellipse-specific fitting problem can be described as follows:

Here,
By using the Lagrange multiplier

This may be rewritten as follows:

where
All previously reported ellipse fitting-based methods that split overlapping cells are based on the direct least squares fitting of an ellipse [9, 10].
>
B. Numerically Stable Direct Least Squares Fitting of Ellipses
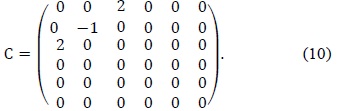
According to Halir and Flusser [8], the constraint matrix
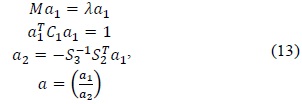
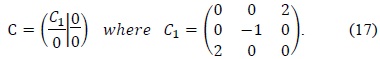
To overcome these drawbacks of the original least squares method, we used Halir’s numerically stable direct least squares fitting of an ellipse. By using Halir’s method, we could rewrite (12) as the following set of equations:

where

where


Finally, we can find the eigenvector
>
C. Separation Algorithm of Overlapping Cells
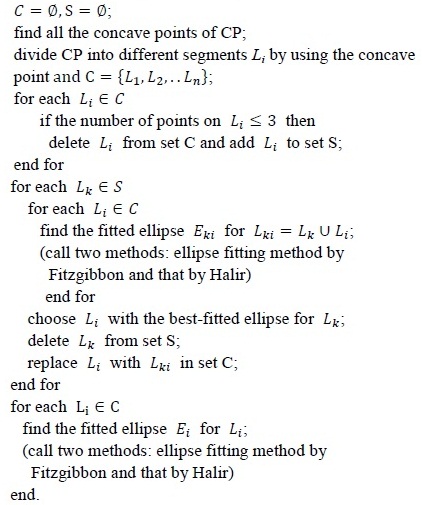
The proposed algorithm is based on the ellipse fitting method to split the overlapping cells. The procedure is given below:
Algorithm (OverlappingCellPolygon CP)

The algorithm was implemented in Visual C++ and MATLAB.
To verify the performance of the proposed algorithm, we used optical microscope images taken at intervals of 30 minutes during the cell culture process. The quality of data was degraded with severe noise and uneven microscope light. Further, there are tens of thousands of cells and overlapping cells in an image.
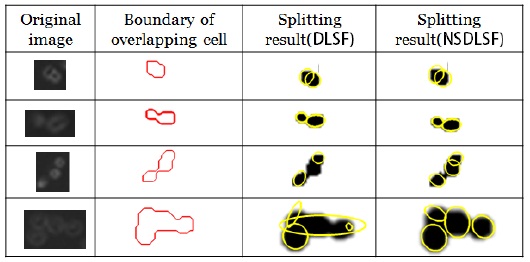
Fig. 2 shows the results of separating the overlapping cells. The second column shows the preprocessing results and the boundary information, and the third and fourth columns present the splitting results obtained by applying Fitzgibbon’s and Halir’s ellipse fitting method in the proposed algorithm, respectively. Both the methods gave good results for two overlapping cells. However, for three or more overlapping cells, the proposed algorithm using Fitzgibbon’s fitting method could not find the fitted ellipses in many overlapping cells. The third and fourth columns show the erroneous results obtained by an unstable computation of the eigenvalues such as infinite or complex numbers.
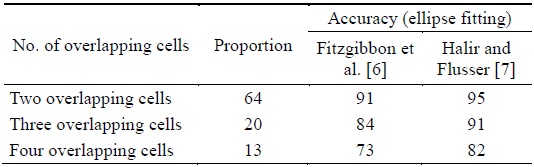
Table 1 shows that the successful separation ratio was higher when the ellipse fitting method by Halir and Flusser [8] was used in the proposed algorithm. This is because of the fact that Fitzgibbon’s fitting method produced incorrect results for three or more overlapping cells among the many overlapping cells. In the proposed algorithm using Halir’s method, the overlapping cells were split with an average separation accuracy of 95%, 91%, and 82% for two overlapping cells, three overlapping cells, and four overlapping cells, respectively.
[Table 1.] Performance of the proposed algorithms (unit: %)

Performance of the proposed algorithms (unit: %)
In this study, we proposed a separation algorithm for overlapping cells, which is based on two different ellipse fitting methods, namely the conventional direct least squares method and the improved direct least squares method. Through various experiments, the improved least squares method (numerically stable direct least squares fitting [NSDLSF]) is compared with the conventional least squares method (direct least squares fitting [DLSF]) and has proved to give a better result. The results reveal that NSDLSF has a successful separation ratio with an average accuracy of 95% for two overlapping cells, an average accuracy of 91% for three overlapping cells, and about 82% accuracy for four overlapping cells.

![Two different cell images: (a) one of cell image types which usually has been used in other researches [5] and (b) one of the images used in the present research](http://oak.go.kr/repository/journal/17229/E1ICAW_2015_v13n3_215_f001.jpg)