

A vast amount of information arrives every day through a variety of news media such as newswires, TV, newspapers, radio, and website sources. In addition, the significant growth and dynamic environment of digital information creates challenges in information retrieval (IR) technology. The amount of constant information which readers can effectively use is still limited compared to the continuous growth of rapidly changing online information. Thus it has become increasingly important to provide and enhance methods to find and present textual information effectively and efficiently. Technologies have been proposed to solve the information overload issues, including information customization, search engines, and information agency. Therefore research on Topic Detection and Tracking (TDT) serves as a core technology for a system that monitors news broadcasts. It helps to alert information professionals such as journalists to interesting and new events happening in the world. Journalists are keen to track and, in particular, to know the latest news about a story from a large amount of information that arrives daily.
Most TDT research has concentrated primarily on the design and evaluation of algorithms to implement TDT tasks such as stream segmentation, story detection, link detection, and story tracking. Bag of words (BOW) and named entities (NE) approaches are widely implemented either in document representation or in user interface design of TDT systems (Kumaran & Allan, 2004). Meanwhile Interactive Topic Detection and Tracking (
In this research we did not discuss the interface design or features but focused on the approaches used: either BOW or NE or their combination. The objectives of this research are: (i) to implement the combined approach of BOW and NE in
The focus of this section is to review related works on
2.1. Interactive Event Tracking (Ievent) Interface
The Interactive Event Tracking System (
The reviewed works in
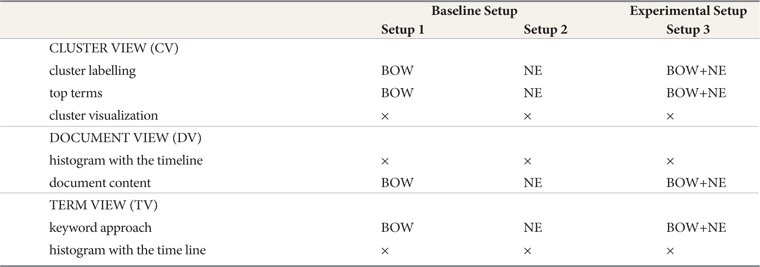
There are four features out of seven of
[Table 1.] The Differences of the Three Setups
The Differences of the Three Setups
a. BOW are the keywords aiming to provide the What and were implemented in Setup 1. Most frequent keywords were offered in the features of iEvent. b. NE are the significant keywords that aim to provide the Who, Where and When and were implemented in Setup 2. Most frequent named entities were offered in the features of iEvent. c. Combination of BOW and NE that aim to provide the What, Who, Where and When and were implemented in Setup 3. Most frequent keywords and named entities were offered in the features of iEvent.
The four features of
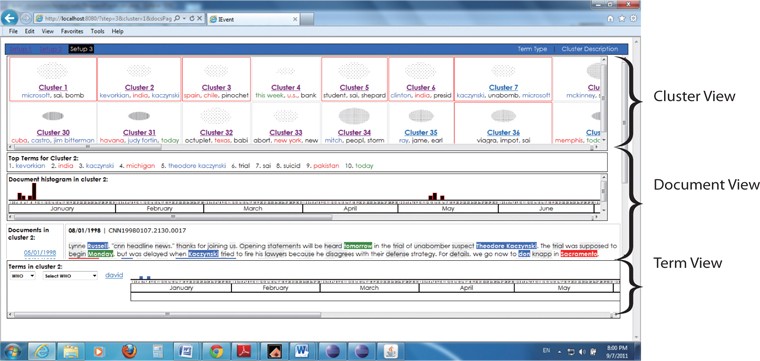
The Cluster View visualized information related to the size and density of a cluster, and displayed the ten most frequent terms (Top terms) in the cluster. The main difference here is in the Cluster labelling feature (refer to Fig. 1) and top ten terms feature (refer to Fig. 2). Clusters were generated using single pass clustering (Mohd et al., 2012) and were labelled using the three most frequently named entities; for example, Cluster 30 was labelled using keywords in Setup 1, named entities in Setup 2, and a combination of BOW and NE in Setup 3.
When the user clicked on Cluster 30, there was additional information presented on the top ten terms as shown in Fig. 2. The difference in these features between the three setups is that the user was provided with mixed BOW and NE in Setup 3 instead of using BOW only in Setup 1 and NE only in Setup 2.
Document View provided the user with information about the document timeline in a histogram form and the document content in a cluster. There was no difference in timeline across setups where this feature was showing the occurrence and the number of documents (document frequency) for a specific date. This supported the journalist in viewing the information flow in a press article or in analyzing the discourse.
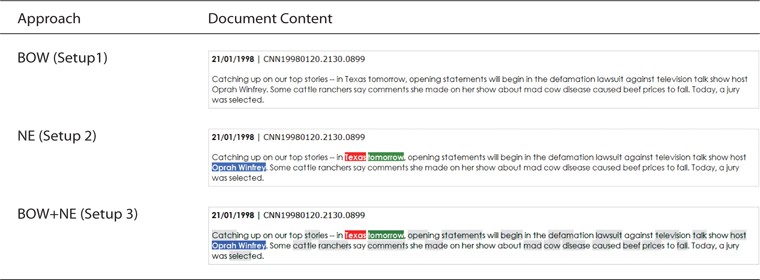
However, as shown in Fig. 3, users could see a small difference in the document content, especially between Setup 3 (experimental Setup) and Setup 2 (baseline Setup) and a significant difference with Setup 1 (baseline Setup). The types of term such as Who, What, Where, and When are highlighted according to the setup.
Cascading Style Sheets (CSS) were used to differentiate three types of named entities with different colors and terms assigned, as shown in Table 2.
[Table 2.] Types of Terms in Setup 3

Types of Terms in Setup 3
Term View provided information on the occurrence of keywords and NE within the timeline with a histogram in a cluster, and an option terms list where there is no difference in timeline across setups. The difference only appeared in the option terms list, where Setup 1 (baseline setup) provided the user with “What” only and Setup 2 (baseline setup) provided the user with “Who, Where, and When”; meanwhile Setup 3 (experimental setup) provided the user with “Who, Where, When, and What.”
The three components were arranged on the interface from top to bottom based on their relevance to the user, beginning with Cluster View (CV), followed by Document View (DV), and lastly Term View (TV). CV enabled the users to browse the whole collection before they went on to search a specific cluster, while DV allowed them to view all the documents in the chosen cluster and provided them with an interactive graphical timeline interface to browse the major events and the cluster contents. Finally, TV displayed the terms in the cluster and provided a timeline to link the terms with the related document in DV. The components were arranged in an inverted pyramid on the interface to help users to narrow their browsing and to be more focused in their searching. In this study,
We used a dataset that consisted of a collection of documents chosen from TDT2 and TDT3 corpuses which contained 1,468 CNN news documents. We used a copy of the dataset from the
The users were a mixture of journalists and postgraduate journalism students at the Universiti Kebangsaan Malaysia. Ten users were chosen, of whom three were female. 50% of the respondents were journalists and the remaining proportion were journalism students.
The evaluation of text classification effectiveness in an IR experimental system is often based on statistical measurements. These measurements are precision, recall, and F1-measure (Rijsbergen, 1979; Kowalski, 1997). In our case, the
We treated each cluster as if it were the desired set of documents for a topic. The selection of topics for the Tracking in this experiment were based on the F1-measure (Mohd et al., 2012; Lewis & Gale, 1994; Pons-Porrata et al., 2004). To validate whether the
There were two tasks, Tracking and Detection, which were given to the users.
4.4.1. Tracking Task
The definition of the Tracking task was to track the cluster that contained the identified topic. The user had to track the cluster that included the given topic and show that a sufficient amount of information on the event was provided by the system. This is consistent with the mission of a news journalist. Reporting and Profiling are sub-activities of this task where Reporting is defined as writing an article about a given topic; it requires the user to write an article about a topic through the formulation of significant facts. Meanwhile, Profiling is defined as drafting significant keywords as an outline for a topic. These tasks were considered to simulate natural news monitoring behavior by users. We aimed to create a type of interaction between the users and
The steps in carrying out the Tracking task were: A topic summary was given to the users. Based on the information contained in the topic summary, the users were asked to track the related cluster. The users investigated the documents in the related cluster they found. The users were asked to draft the important facts or points to execute the Reporting task. They listed out the dealing cluster. The users created a profile by drafting useful keywords to perform the profiling task. The users expressed their opinion on the features provided by iEvent when performing the Tracking task by completing a questionnaire.
4.4.2. Detection Task
The detection task was the second task performed by the users. It is defined as identifying the topic dealt by a definite cluster. This is consistent with a journalist’s task of identifying significant events that happened on a definite day (Mohd et al., 2012). The steps to carry out the Detection task are:
A specific cluster was given to the users with a list of twenty topics. They were then asked to detect the topics from the documents contained in a specific cluster using any features of iEvent to perform this task. The users were asked to rank a maximum of three topics from the list of twenty topics given, if they felt that the specific cluster contained more than one. Finally, they expressed their opinion on the features provided by iEvent whilst performing the Detection task by completing a questionnaire.
In the Tracking task, there were six topics used and the users were given 15 minutes to complete each topic. They were given a total of 1:30 hours to attempt the entire Tracking task in three sessions.
In the Detection task there were also six clusters given where the users spent a maximum of 10 minutes to complete each cluster. In total, they were given one hour to complete the task in three sessions. Finally, at the conclusion of the tasks, the users completed a questionnaire which took approximately 5 minutes. The whole user experiment took about 2 hours 30 minutes to 3 hours excluding a short training session.
Users were given an opportunity to carry out the tasks using the interface. A Latin Square design (Spärck-Jones, 1981; Spärck-Jones & Willett, 1997; Doyle, 1975) was used which allowed us to evaluate the same topic using different setups. Fig. 6 shows the experimental design, where the order of topics assigned in the Tracking tasks and the order of clusters given in the Detection task were rotated to avoid any learning factor.
Topic 1 (Oprah Lawsuit), for example, has an opportunity to change sequentially from first until sixth in order during the Tracking task. The clusters assigned in the Detection task were hidden during execution of the Tracking task to avoid any intersection of clusters that may have affected users’ performance. The clusters were completed using single pass clustering with the threshold
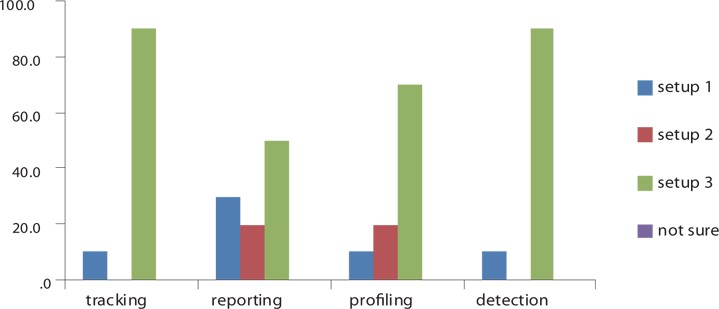
During the experiment, 120 tasks were performed. 50% of these tasks were Tracking while the remaining tasks were Detection. The general results showed that 90% of the users liked to use
The results also revealed that more than 70% of the users that used
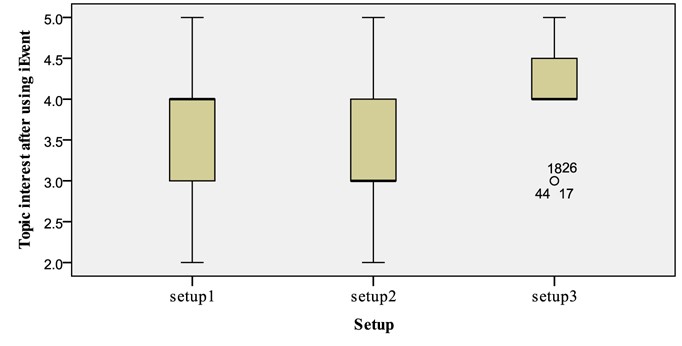
A possible explanation for these results might be the users’ success in performing both tasks (see Fig. 7). It is clear that there was a change in the users’ topic interest after using
During the
First, the users’ overall opinions on the use of the combination approach (BOW+NE) in Setup 3 were examined. Next, we investigated the users’ performance in the Reporting task, such as the amount of news written, and in the Profiling task, such as the amount and the types of keywords given to write a profile of a story (terms, NE, or a combination). Finally, we investigated whether the users agreed that the use of the combination approach in
5.2.1. Overall Opinions
Users’ opinions of iEvent during the Tracking task were analysed between setups. We investigated whether they perceived
Summary Percentage of Users’ Opinions (easy, relaxing, simple, satisfying, and interesting) Across Setup in Tracking Task
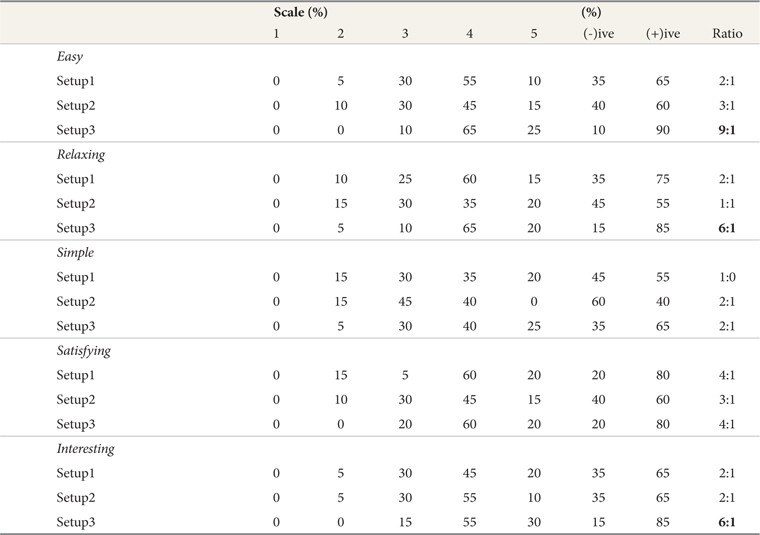
A ratio of 9 users to 1 found that Setup 3 was easier than the other Setups. 65% of users agreed that Setup 3 (
As mentioned above, the Kruskal-Wallis Test confirmed that there was no statistically significant difference (p>0.05) in users’ opinions with regard to relaxing, satisfying, and interesting. It clearly appears, however, that Setup 3 scored higher in terms of scale and ratio compared with Setup 1 and Setup 2, as shown in Table 3.
In the interview session, the users agreed that the use of the combination approach (BOW+NE) provided them with good findings and quick and precise information on the Who, Where, When, and What of an event, which made the Tracking task easy using Setup 3.
Interestingly, the satisfaction factor was also related to the high percentage of correct clusters tracked. This provides strong evidence that
a. None - where users did not provide any information or they did not complete the task. b. Wrong - where users tracked the wrong cluster. c. Partially Correct - where users list out the minor cluster as their main finding.d. Correct - where users list out the major cluster as their main finding.
The complete Tracking task was successful with 98.33% of tasks as correct and 1.67% as partially correct because sometimes a wrong cluster was chosen that caused wasted time in performance of the task (15 minutes). Moreover, users were confused by some terms, e.g. Merge, Texas, in topics which were highlighted in a cluster on a wrong topic.
The average time taken to conduct this task successfully across setups was approximately 12 minutes, 13 seconds. The users spent about 11 minutes, 35 seconds using the combination approach (BOW+NE) in Setup 3, 11 minutes, 20 seconds using NE in Setup 2, and 13 minutes, 45 seconds for BOW in Setup 1. The time taken in Setup 3 represents a mid-point between the shorter time that was taken in Setup 2 and the longer time in Setup 1. A possible explanation for the mid-time taken in Setup 3 was that it represented a compromise between the specific information (NE) provided by Setup 2 and the general information provided by Setup 1 (BOW). Since Setup 3 provided the users with a meaningful information, both tasks are facilitated.
5.2.2. Reporting Task
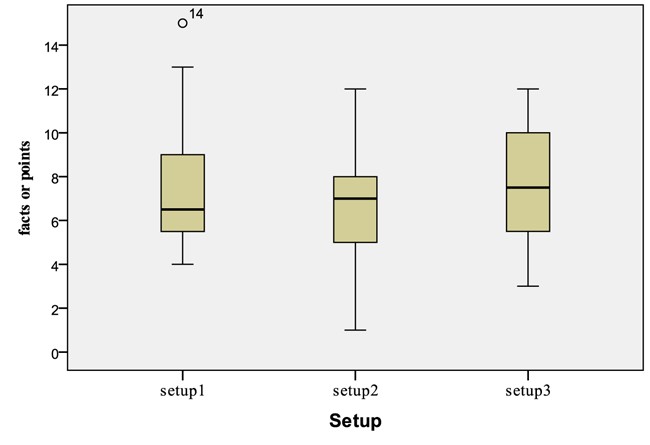
The Reporting task is one of the sub activities in Tracking. In this section, we report the findings of users’ performance during this task after analysis of the number of lines that users wrote across setups. There was no statistically significant difference in the amount of news written in conjunction with the setups (Kruskal-Wallis Test,
5.2.3. Profiling Task
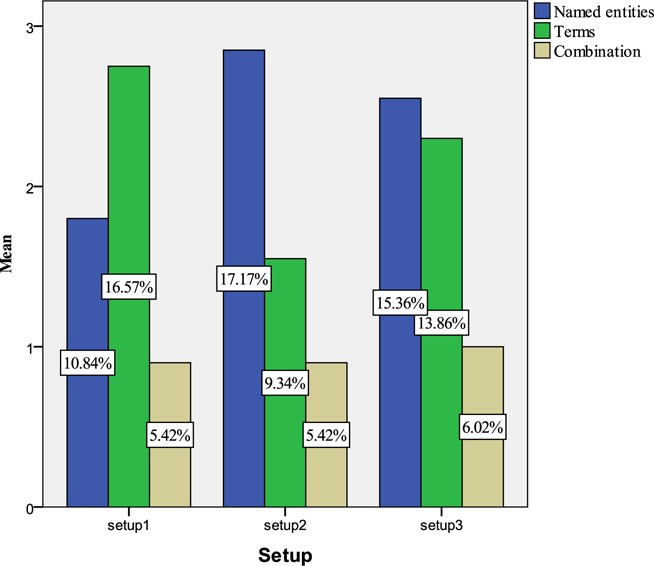
The users were asked to write important keywords as a profile for a topic where there were three types of keywords: named entities, terms, and combination (terms and named entities). For example, users might write keywords such as Exxon (NE), merge two companies (terms), and Exxon merge (combination) for the topic Mobil-Exxon Merger. We analysed the types of keywords provided by the users. The Kruskal-Wallis Test confirmed that there was no statistically significant difference between the types of keywords and the setups used in the Profiling task (
Findings revealed that users had a tendency to provide more terms when they were using Setup 1 and larger named entities when using Setup 2. When they were provided with a combination of BOW and NE in Setup 3, however, the results indicated that they prefer to use NE as the important terms in the profile of the task. Fig. 10 shows that Setup 3 provided users with a larger amount of information (34.74%) compared with Setup 1 (32.83%) and Setup 2 (31.93%). The users interviewed agreed that the new approach (BOW+NE) provided a high quality source of information (balance distribution of terms and named entities), thus it was suitable for use in the Profiling task.
We can conclude, therefore, that the combination of BOW and NE is a good approach in this task. Users are provided with broad terms, and at the same time the combination automatically provides them with highly significant terms (NE).
5.2.4. Features
This section deals with analysing each feature of
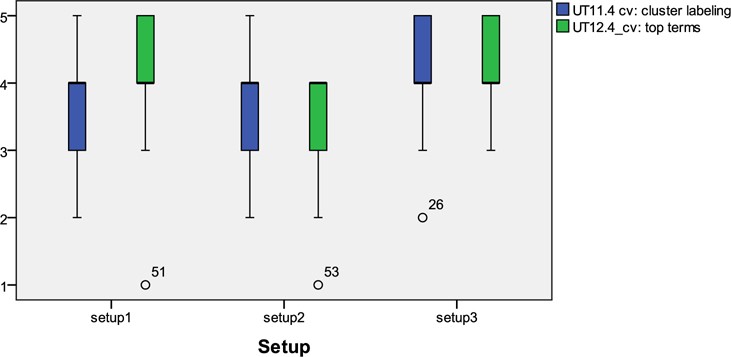
There was a statistically significant difference shown in the evaluation of the ‘CV: cluster labelling’ feature across setups (Kruskal-Wallis Test,
[Table 4.] ‘CV: cluster labelling’ Feature Across Setups Perceived as Useful

‘CV: cluster labelling’ Feature Across Setups Perceived as Useful
A ratio of 9 users to 1 found that the combination approach (BOW + NE) that was used in the ‘CV: cluster labelling’ feature in Setup 3 of
We can conclude that users found the combination approach (BOW+NE) used in the ‘CV: cluster labelling’ features in Setup 3 of
There was also a statistically significant difference shown in the evaluation of the ‘CV: keyword approach’ feature across setups (Kruskal-Wallis Test,
[Fig. 11.] Box plot on effectiveness (scale 1-5) of the ‘CV: keyword approach’ feature across Setups
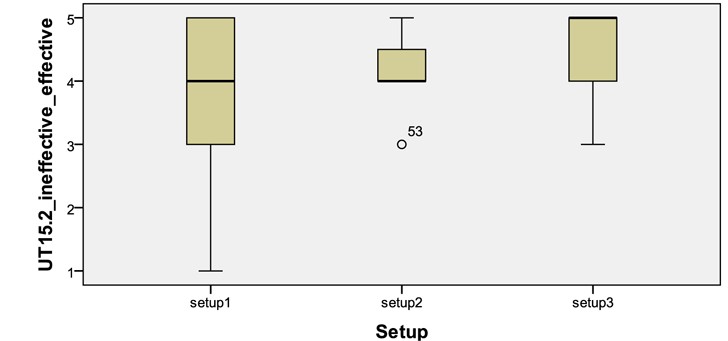
For this opinion value, the Kruskal-Wallis Test also confirmed that there was a statistically significant difference across setups shown in the evaluation of the ‘CV: cluster labelling’ feature (
[Table 5.] ‘CV: cluster labelling’ Features Across Setups Perceived as Helpful

‘CV: cluster labelling’ Features Across Setups Perceived as Helpful
This indicates that users found the combination approach that was used in the ‘CV: cluster labelling’ features in Setup 3 of
For this opinion, the Kruscal-Wallis Test confirmed there was a statistically significant difference (
The evaluation shows that all features of
This section is concerned with the analysis of users’ agreement on the ease of detecting the topics and frequency of features with the combination approach (BOW+NE) across setups.
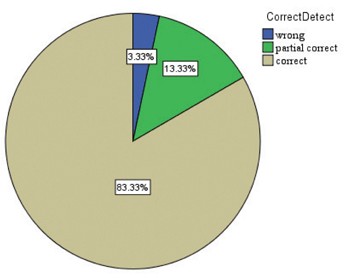
The whole Detection task was conducted successfully with 83.33% of task findings being correct and 13.33% being partially correct. There were 3.33% unsuccessful Detection tasks; we believe the reason for this is because of some users’ confusion between the topics. Generally, this confirmed that
The Kruskal-Wallis Test also confirmed that there was no statistically significant difference in the number of correct topics detected (
a. None - where users did not gather any information or they did not complete the task. b. Wrong - where users detected the wrong topic. c. Partially Correct - where users listed out the minor topic as their main findingd. Correct - where users listed out the major topic as their main finding
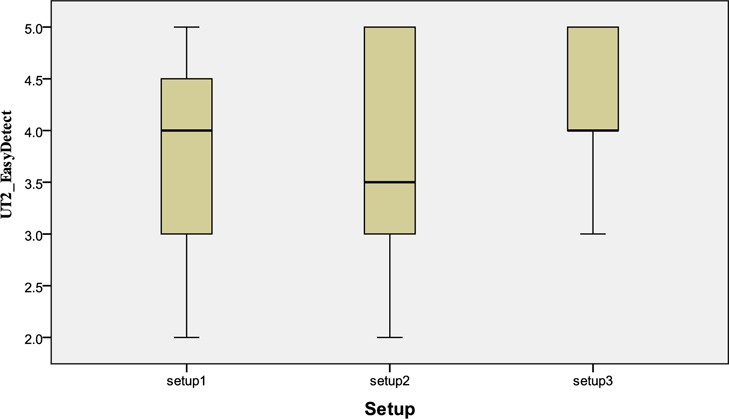
It was apparent from the Kruskal-Wallis Test that there was no statistically significant difference between the users’ opinions (
As mentioned previously in Section 5.1 (General Findings), during the post-evaluation interview the users found that the combination approach (BOW+NE) was more descriptive because they had to detect the topic dealt by a specific cluster in the Detection task, and Setup 3 (combination approach) provided users with Who, Where, When, and What information at the same time.
As shown in Table 6, 55% of users agreed that it was easy (scale 4) to detect a topic using Setup 3 (
[Table 6.] Percentage of User Opinions on Ease of Detecting a Topic Across Setups

Percentage of User Opinions on Ease of Detecting a Topic Across Setups
Further analysis on the interaction logs proved that users had a higher activity for the ‘DV: document content’ feature in Setup 3 (77.3%) compared to Setup 1 (68.8%) and Setup 2 (65.7%). These results clarified that users clicked less on the ‘DV: document content’ feature with NE (Setup 2) and BOW (Setup 1), than with the combination approach (BOW+NE) in Setup 3. Highlighting BOW and NE in the ‘DV: document content’ feature has provided users with quick and significant information rather than displaying plain document content. In addition, it provided users with links to highlight other clusters which had the NE or BOW in the document content by clicking on the terms or named entities. Additionally, in the successful attempts at the Detection task, the users took less time using the combination approach (BOW+NE) (00:04:22) compared to using NE (00:04:41) and keywords (00:04:50).
Furthermore, the interaction logs showed that there was slight activity in the ‘TV: keyword approach’ feature. This was seen clearly in Setup 3 and less clearly in the other two Setups. This may be due to users attempting to use Who, Where, When, and What terms.
These results indicate that the combination approach (BOW+NE) used in the ‘DV: document content’ feature provided them with all the terms, and the NE used in the ‘DV: document content’ feature helps them to make a quick decision in respect to a topic in the Detection task.
In general, most of the features in Setup 2 (NE) facilitated users in the Tracking task. Meanwhile, Setup 1 (BOW) facilitated them in the Detection task. Interestingly, users agreed that most of the features in the combination approach (BOW+NE) facilitated performance of both tasks. Users found, however, that the use of the combination approach (BOW+NE), for example in the ‘DV: document content’ feature, also provided them with broader information that helped them to detect the topic quickly. This proves that the combination approach (BOW+NE) was effective and efficient in both tasks. Table 7 shows the features with their approaches which facilitated users in performing the TDT tasks.
[Table 7.] Comparison of Features, with Approaches, Which Facilitated TDT tasks

Comparison of Features, with Approaches, Which Facilitated TDT tasks
The Kruskal-Wallis Test confirmed that there was no statistically significant difference between the successful Tracking (
Future analysis on the interaction logs enabled us to make a comparison of the mean number of clicks among the successful tasks between setups, as shown in Table 8.
[Table 8.] Comparison of Features, with Approaches, Which Facilitated TDT tasks

Comparison of Features, with Approaches, Which Facilitated TDT tasks
It seems from Table 8 that there is a disparity in mean number of clicks between the approaches that were used in performing tasks across setups. This can be seen clearly between Setup 1 and Setup 2 where mean clicks in Setup 2 in the Tracking task are higher than for Setup 1. Meanwhile, the mean number of clicks in Setup 1 is higher in the Detection task. Surprisingly, it is clear that the mean clicks in Setup 3 was closely equal to the mean average of each task in both Setup 1 and Setup 2, showing that the combination approach (BOW+NE) facilitated both tasks. There are two explanations for the previous findings in interaction logs: First, the higher number of clicks indicates a lack of information or higher interaction between the users and the system; second, the average number in clicks provided by Setup 3 may indicate that users are provided with enough information to perform both tasks.
Users are provided with the two types of information and they can choose to display either keywords or keywords with named entities highlighted. A combination of this information is interesting since named entities are high quality pieces of information and keywords are descriptive. Rather than providing users with the Who, Where, and When it would be interesting to provide the What in one setting and investigate its effects. Thus, this study has presented an experimental study conducted with journalists to investigate the combination of bag of words and named entities (BOW+NE) approaches implemented in the


