In a multi-hop wireless network, connectivity is determined by the link that is established by the receiving signal strength computed by subtracting the path loss from the transmission power. Two path loss models are commonly used in research, namely two-ray ground and shadow fading, which determine the receiving signal strength and affect the link quality. Link quality is one of the key factors that affect network performance. In general, network performance improves with better link quality in a wireless network. In this study, we measure the network connectivity and performance in a shadow fading path loss model, and our observation shows that both are severely degraded in this path loss model. To improve network performance, we propose power control schemes utilizing link quality to identify the set of nodes required to adjust the transmission power in order to improve the network throughput in both homogeneous and heterogeneous multi-hop wireless networks. Numerical studies to evaluate the proposed schemes are presented and compared.
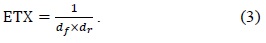
In a multi-hop wireless network, the nodes must cooperate to dynamically establish routes using wireless links and these routes must involve multiple hops with each node acting as a router. In many multi-hop wireless network scenarios, arbitrary node deployment or interference can change dynamically, resulting in topology changes. A multihop wireless network also inherits the traditional problems of wireless communications; this when combined with mobility and a lack of infrastructure makes the design and development of such a network challenging [1-3]. Connectivity is essential in any network for communication; it can be established if two nodes are within the communication range of each other in a wireless network. Unlike wired networks, links in wireless networks are unreliable because of the nature of their medium, air, which makes link quality susceptible to many factors such as noise, interference, and obstacles. Many researchers have studied the connectivity of multi-hop wireless networks in homogeneous conditions where nodes have identical properties and inhabit a uniform environment (e.g., identical transmission power, battery life, radio propagation ranges, and antennas). However, measurement studies [4] have shown that several of the assumptions in the homogeneous context are inaccurate. In particular, they have reported that real networks could have directional links. For example, if all the nodes have different transmission power, their transmission range differs and a directional link can be formed. Similarly, a directional link is formed by nodes having non-identical signal propagation due to differences in the local environment (e.g., trees and buildings). In [5], we proposed methods to improve the connectivity of a multi-hop wireless network in a heterogeneous environment, with the focus on ensuring that the network was k-connected. In reality, the existence of a link between two nodes does not ensure that its quality is consistent in both directions and that the link quality is often asymmetric (e.g., different achievable bit rates in each direction). Note that a common approach to connection routing in a multi-hop wireless network is to base route selection on a link quality [6-9] metric. For example, the well-known link quality-based routing protocol, optimized link state routing protocol (OLSR) utilizes the expected transmission count metric (ETX) [10].
A non-homogeneous wireless network environment makes the link quality unreliable, which results in connectivity change. We utilize the measured link quality and identify the corresponding connectivity change. Then, we identify nodes that need transmission power control to improve network performance (i.e., throughput). From the perspective of heterogeneity, we consider two factors, namely signal propagation and transmission power, to compare and evaluate network performance via a simulation study. Then, we propose cluster-based power control schemes that can improve network performance. OLSRETX has been widely used in many research studies. Gottron et al. [11] used OLSR-ETX for cluster-based architecture for a mobile peer-to-peer network. OLSR-ETX was also implemented in ultra-light intelligent flying robots in [12]. Its performance for different applications was studied in [13-15]. Several studies investigated the limitations of OLSR-ETX and proposed protocols or algorithms to overcome these shortcomings. Kulla et al. [16] proposed the BATMAN routing protocol for the synchronization problem. This protocol resolved the problem of topological message dissemination. Pinheiro et al. [17] modified ETX with queue availability by using fuzzy logic. In [18], the ETX value was modified on the basis of MAC layer congestion sensing from the queue length to optimize the routing protocol at the network layer and enhance video streaming in an 802.11 wireless mesh network. Somasundaram et al. [19] tried to solve the problem of the set cover method in that it tends to select the unstable short-distance path rather than the more stable long-distance path to the destination where the distance is measured by the number of hops. They proposed the stable path topology control that uses ETX to solve this problem. However, the connectivity change based on the link quality measure has not been studied to the best of our knowledge. In this paper, we present the connectivity change based on the measured link quality and the corresponding performance degradation. Then, we propose transmission power control schemes to improve performance.
The rest of this paper is organized as follows: we define the network models in Section II and propose two clusterbased techniques to improve the network in Section III. Simulation results illustrating the effectiveness and tradeoffs of the resilience schemes are given in Section IV and discussed in Section V. Lastly, we present our conclusions in Section VI.
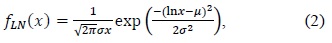
Connectivity between a pair of nodes is established if they are within the communication range of the wireless multi-hop network. More specifically, the communication range is determined by the receiving signal strength, which can be computed using the transmission power and the path loss. The common propagation models are free space, tworay ground, and shadow fading. The free-space model is considered when the network environment is assumed to be an open space with no objects such as trees and buildings and no excessive noise. The two-ray ground model includes the signal reflected by the ground, but the environment is still assumed to be open without any object. In these models, the path loss gradually decreases with an increase in distance, which implies that connectivity is deterministic and is determined by the distance between the two nodes. If two nodes are within a certain range in which the receiving signal is still sufficiently good to receive data, they can communicate. Therefore, the packet loss in these propagation models occurs more likely not by the connectivity but by the traffic load. The heavy traffic load on the link may drop the packets due to the queue size. The shadow fading model is considered when the network environment includes any object that causes the random attenuation that affects the signal propagation, called shadow fading X, in the path loss model, as shown in Eq. (1).

where

where

We remove the poor links; therefore, the inverse of the ETX value is smaller than the threshold (i.e., 0.01, 0.03, and 0.05). Then, we examine the network connectivity for the 50-node network topologies in both propagation models. We observe that all network topologies are at least 1-connected in the two-ray ground propagation model, while none of them is 1-connected in the shadow fading propagation model.
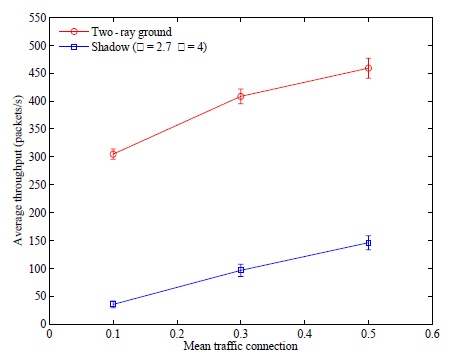
We also compare the performance test of both propagation models via a simulation study using NS-2. We use the same network parameters and network topologies and randomly generate a constant bit rate (CBR) traffic of 1000 bytes every 0.25 seconds by using the user datagram protocol (UDP). The number of traffic connections is randomly selected on the basis of the mean number of connections (MC), which is the average ratio of the number of connections to the number of total possible connections (i.e.,
In this study, we mainly focus on the shadow fading propagation model in homogeneous and heterogeneous wireless networks in order to improve the network performance by adjusting the transmission power. In a homogeneous wireless network, all nodes have identical transmission power, whereas a heterogeneous wireless network has non-identical transmission power. Further, in this paper, we define two network models that ensure homogeneous transmission power and heterogeneous transmission power in the shadow fading propagation model, respectively.
III. TRANSMISSION POWER CONTROL SCHEME AND IMPLEMENTATION
Consider an arbitrary multi-hop wireless network of
>
A. Cluster-Based Transmission Power Control Scheme
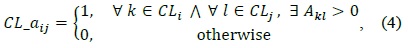
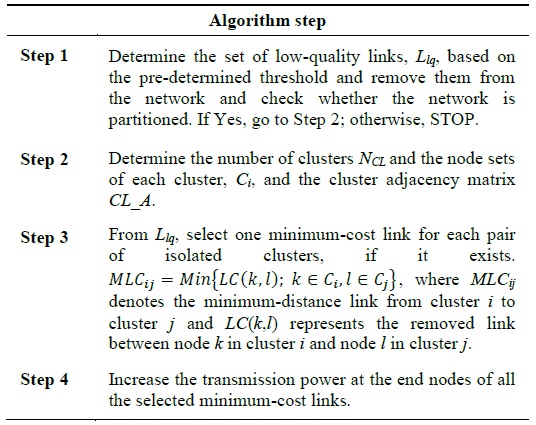
We propose cluster-based transmission power control schemes to improve network performance. These schemes find low-quality links and identify the set of nodes to increase the transmission power. The cluster and its set of associating nodes can be determined by the eigenvalue and the eigenvector of the Laplacian matrix [5]. Once the sets of member nodes in each isolated cluster are identified, a cluster adjacency matrix,

where
[Table 1.] Cluster merging with symmetric link quality

Cluster merging with symmetric link quality
CMALQ is similar but uses the forward and reverse delivery ratio instead of the inverse ETX. In general, these delivery ratios are not identical due to congestion, heterogeneity of node property, shadow fading effect, etc., which results in an asymmetric link quality matrix (i.e., LQ
In this section, we evaluate the improvement in network performance (i.e., throughput) brought about by the proposed cluster-based transmission power control schemes via a simulation study. We use an NS-2 simulator with at least 40 of the 1-connected 20-node network topologies where the nodes are uniformly distributed over an area of 680×680 m2 . All other simulation parameters, such as the transmission and receiving power threshold, MAC and routing protocols, frequency, path loss exponent, deviation, and traffic load, are the same as those discussed in Section II. The transmission power at each node is randomly selected in the range of [23 dBm, 25 dBm] to produce the heterogeneity of the transmission power. Once the proposed schemes identify the nodes to improve the link quality, the transmission power at the selected node increases to 33 dBm.
>
A. Performance Evaluation in the Case of Symmetric Links
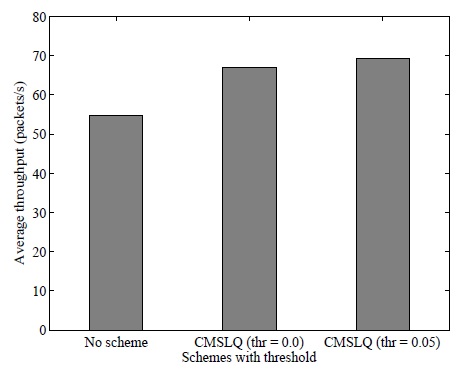
In this section, we implement the proposed CMSLQ scheme to evaluate network performance. In each network topology, this scheme runs for a certain amount of time (i.e., 40 seconds) and the inverse values of the ETX values at each symmetric link are obtained. Then, the symmetric link quality matrix, LQ, is produced and CMSLQ processes it to identify the set of nodes required to increase the transmission power. In this comparison, we select two threshold values (i.e., 0 and 0.05). None of the links are removed when the threshold value is set to 0 and CMSLQ is applied. When the threshold value is set to 0.05 (i.e., the approximate expected transmission count in each direction is 4.5), any link that has an inverse of an ETX value of less than 0.05 is removed and CMSLQ is applied.
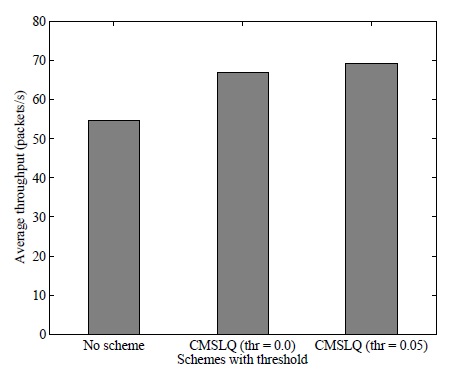
The average throughput results are compared in Figs. 2 and 3. Fig. 2 illustrates the average throughput comparison under a homogeneous transmission power condition and shows that CMSLQ improves the throughput for both threshold values. The average throughput is approximately 55 packets/s when CMSLQ is applied. When CMSLQ is applied in the case of threshold value=0, the throughput improves by about 27% (i.e., 70 packets/s). The higher the threshold, the greater is the improvement in the throughput; e.g., CMSLQ with a threshold value of 0.05 shows 36% improvement (i.e., 75 packets/s). Under the heterogeneous network condition, the proposed scheme improves the throughput, but the improvement is not as good as that under the homogeneous network condition, as shown in Fig. 3. CMSLQ with a threshold of 0 improves the throughput by about 23% (i.e., 68 packets/s), while CMSLQ with a threshold value of 0.05 does so by about 27% (i.e., 70 packets/s). We observe that in both cases, the throughput improves when CMSLQ is applied and an increase in the threshold value leads to greater performance improvement.
>
B. Performance Evaluation in the Case of Asymmetric Links
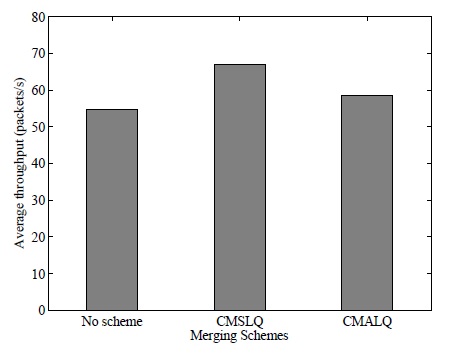
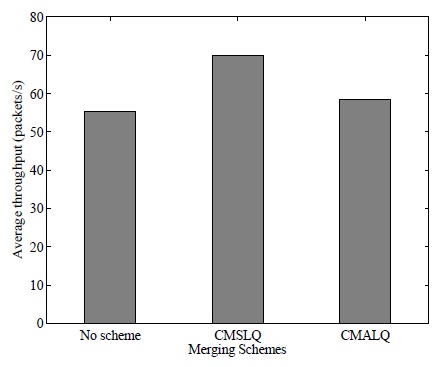
OLSR utilizes the link quality computed using Eq. (3), and the consequent represents the link quality with an absence of direction. In general, the link quality in one direction may not be the same as that in the other direction in a wireless network, particularly in a heterogeneous wireless network. Then, the link quality matrix, LQ, is not symmetrical anymore; it becomes asymmetrical. In this section, we discuss the application of the proposed schemes to a network with direct links by using an asymmetric link quality matrix measured at the MAC layer. We implement the HELLO packets in OLSR, which are sent periodically at each node. We count the number of received HELLO packets for a certain amount of time at each node in order to compute the link quality of the directed links. By using the obtained asymmetric link quality matrix (i.e., LQ), CMALQ finds the set of nodes required to control the transmission power by identifying the set of directed links to be improved where the threshold is set to 0. The results are compared with the zero threshold of CMSLQ in Figs. 4 and 5. Fig. 4 illustrates the average throughput in a homogeneous wireless network. Unlike CMSLQ, the average throughput improvement by CMALQ is not significant. The figure shows that the throughput improvement is about 7% (i.e., 59 packets/s) by CMALQ and 27% by CMSLQ. The results obtained when the heterogeneous transmission power is considered are shown in Fig. 5. While the average throughput improvement by CMSLQ slightly changes in a different network environment, that by CMALQ remains almost the same. The results of CMALQ under both network conditions show the least significant throughput improvement. However, CMALQ selects fewer nodes for transmission power control than CMSLQ does.
In this study, we evaluated the network performance in terms of throughput in the case of the shadow fading propagation model in two network environments by using a simulation study. The simulation results showed that the network performance degraded in the shadow fading propagation model. Both the proposed transmission power control schemes improved the network performance. CMSLQ improved the throughput significantly as the threshold value increased, but it might require higher computation time due to an increase in the number of isolated clusters.
CMALQ also improved the throughput but not as significantly as CMSLQ. However, relatively few nodes were used to increase the transmission power by CMALQ; therefore, it improved the throughput with minimal cost. In the case of CMALQ, the throughput might increase by the use of a relatively high threshold. CMSLQ was relatively easy to use with less computation time, while CMALQ required relatively large computation time.
Many 1-connected homogeneous wireless networks become disconnected probabilistically in the shadow fading propagation model; this degrades the network performance. In this paper, we proposed two transmission power control schemes to improve network connectivity in such a propagation model in the case of homogeneous and heterogeneous wireless networks. Our results revealed that both the proposed schemes improved the throughput; however, CMSLQ improved it more significantly than CMALQ. CMSLQ was also easier to implement with the drawback of a higher cost. Both schemes relieved the network degradation due to the shadow fading effect. However, CMALQ showed less improvement than CMSLQ. In the future, we intend to further investigate CMALQ by using a beam-forming or directional antenna for better linkquality improvement, which may, in turn, improve the network performance.