In solar cells, micro-crack is a genuine defect of photovoltaic (PV) modules [1-3]. It is difficult to prevent these cracks from developing in solar cells. Presently, it practically impossible to quantify their impact on the efficiency of the module as it adversely affects its lifetime. In particular, the presence of micro-cracks may have only a marginal effect on the power of a new PV module provided the different parts of the cell are electrically connected with each other. However, with the aging of the module, several kinds of thermal and mechanical stresses come into effect. As a result, the relative movement of the cracked cell parts may occur repeatedly, resulting in a complete electrical separation. Therefore, inactive cell parts are formed [4]. In an aging PV module, the efficiency is bound to decrease with the passage of time. Therefore, it is not merely sufficient to evaluate power drop in the cell.
Another significant research would have to be carried out in order to verify and analyze the normality status at a cell level. Thus, we need to evaluate the direct influence on the power drop of a solar cell in order to investigate ways of improving the efficiency of the solar cells that are presently available in the market. Researches have been focusing on evaluating the reliability of a PV module [5]. The long term life span and power drop must be achieved by establishing the method of reliable evaluation at a cell level, given that it is the most vulnerable part of a PV module.
In this research, we have measured the efficiency by carrying out the thermal test at the cell level of a solar cell. Thereafter, according to the value of efficiency, the direct cause of power drop has been analyzed using electroluminescence (EL) shooting and cross sectional observations.
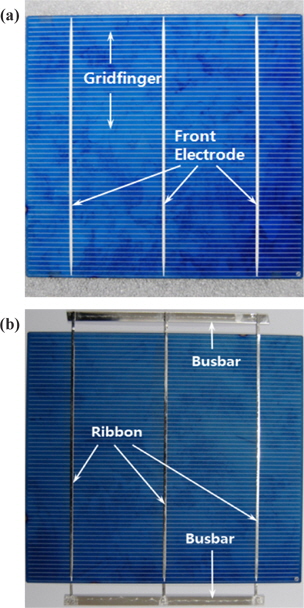
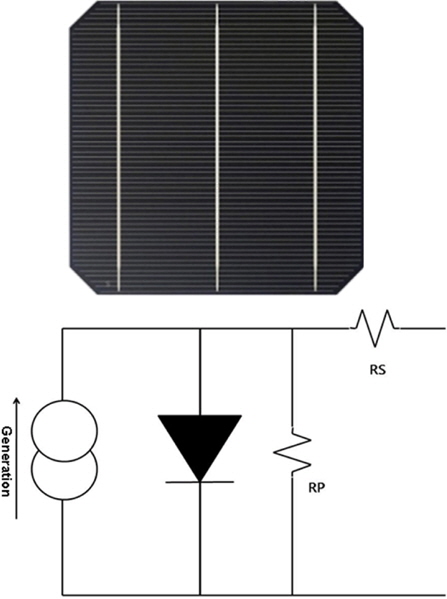
The image of the specimen for this experiment is shown in Fig. 1. We have used a polycrystalline silicon solar cell, with a width of 156 mm and a length of 156 mm. Under identical conditions, Fig. 1(a) displays a pure bare cell composed of a gridfinger and three front electrodes, while in Fig. 1(b), the cell has been tabbed with a ribbon on the gridfinger; it also has three electrodes in the frontal area. Moreover, it is a ribboned cell that forms two busbars at the front and rear sides, gathering electric current at the ribbon part of the front electrode. The thickness of the ribbon is 0.2 mm, while its breadth is 1.5 mm. Moreover, 0.4 mm is the thickness of the two busbars that connect with the front electrode’s ribbon parts; the breadth of these busbars is 6 mm. Before making a PV module, the specimens of this experiment were composed of ribboned cells in order to review the long term reliability at a cell level.
The power drop of a solar cell occurs in either external environmental conditions or through aging. This implies that with the passage of time, there is fall in efficiency of the cell owing to external environmental condition. Such a fall in efficiency of the cell is taken for granted.
Therefore, other than performing reliability evaluation of the module of a solar cell, we must also carry out a reliability evaluation at a cell level. This is because cell level is the basis of a solar cell, so it is also very important. Various techniques have been recommended for conducting reliability evaluation. These techniques have been developed by taking into account the long life cycle and environmental conditions affecting the cell level. Currently, only a thermal cycle test [6] is considered as a reliability evaluation method that determines the long term efficiency of a solar cell. Furthermore, the remaining reliability evaluation methods are not established at a cell level. So, they do not take into account the characteristics of a solar cell and environmental conditions. Thus, in this research, we performed a reliability test at a cell level to determine the long term efficiency of the cell. For this purpose, we performed a thermal shock cycle test, which is a highly accelerated environmental test method.
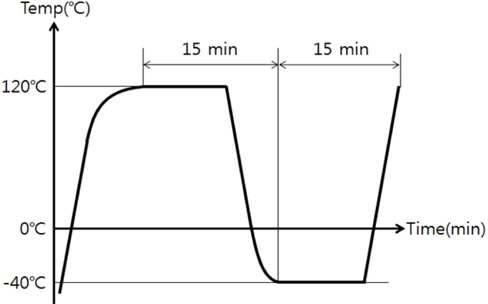
While conducting this experiment under extreme external environmental conditions, the specimens were maintained for 15 minutes at each of the temperatures in the low temperature region till −40℃ was attained. Thereafter, the temperature was maintained for 15 minutes at each point of the high temperature region till 120℃ temperature was attained. Thus, 500 cycles were performed and each cycle lasted for 30 minutes. Since the environmental test methods were intense in terms of highly accelerated temperature variations and speedy consecutive cycles, the test was performed by selecting the condition that mostly influenced the test results in various extreme conditions.
3.1 Power drop after thermal shock cycle test
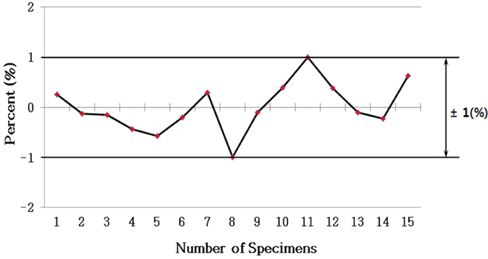
Figure 3 shows the result obtained by measuring ‘zero power’ in the presence of 1,000 W power per each m2 of the cell; this power density was applied in randomly selected 15 bare cells constituting a PV module previously. Thus, we determined the reproducibility and reliability of PV module by verifying the rate of failure involved in the manufacturing process of specimens. As shown in Fig. 3, the reproducibility and reliability in the manufacturing process of specimens must be established through an output value of ±1%, which is the ideal tolerance range.
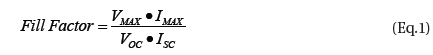
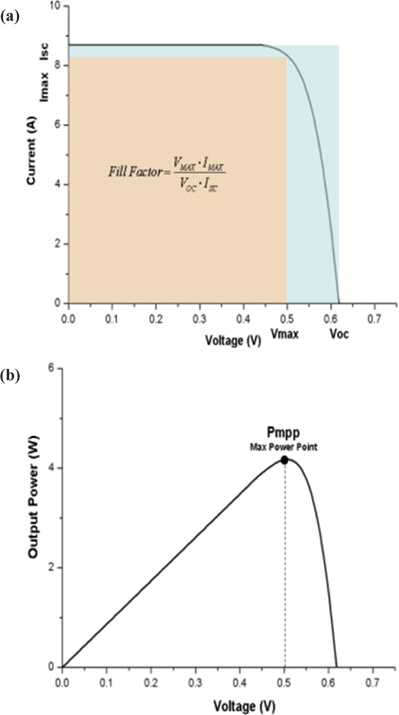
In order to analyze the characteristics of specimens, power drop and FF (Fill Factor) have been measured through I-V characteristics, both before and after conducting the thermal shock test. Before performing the thermal shock test, the power drop was determined by measuring the output value of a bare cell or a ribboned cell, which was considered as the reference value. After performing the thermal shock test, the output value was expressed as the rate of efficiency reduction (%). Furthermore, the FF value is the value defined as the ratio (%) of the actual output power relative to the theoretical power. The theoretical power can be obtained by multiplying ISC with VOC.

This implies that at the condition where there is no effect of leakage current on the diode characteristics, the electric current is inevitably obtained from the composition of the cell (P-N junction). Moreover, VOC is the initial open-circuit voltage, that is, the maximum voltage value of a cell. This is the voltage developed by the shunt resistance of a diode at the current flowing to the output, which is at ‘0’ status even when the current is being generated at the cell [7].
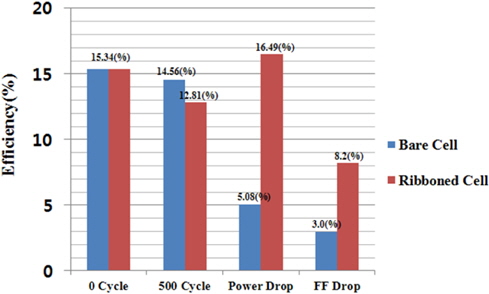
FF is defined as the ratio of the actual maximum output power obtained by IMAX, VMAX to the theoretical output power. IMAX and VMAX are the current and voltage values of the maximum power output of the solar cell, respectively. Thus, FF is a significant index for evaluating the performance of a solar cell, as it is an index that expressed the actual value relative to the theoretical value. As shown in Fig. 4, the power drop and FF value are through the output value in which a power of 1,000 W per each m2 cell is applied both before and after performing the thermal shock test.
Before performing the thermal shock test, the output value of the bare cell was 3.734 W, and the efficiency was 15.34% while estimating the output value with respect to the area of the specimen (243.36×10⁻⁴ m2). After performing the thermal shock test, the output value was 3.544 W while the efficiency was found to be 14.56%.
The power drop rate was a comparison between the power values before and after the thermal shock test; this rate was found to be 5.08%. In addition, the FF value before the thermal shock test was 66.9%, while the fallen FF value was found to be varying from 3.0% to 63.9% after the thermal shock test. At the bare cell, the identical power was imposed and measured upto the ribboned cell; the efficiency was estimated for the output value at the ribboned cell.
Before the thermal shock test, the output value was 3.740 W, with an efficiency of 15.34%. After the thermal shock test, the output value was 3.117 W, while the efficiency was verified to be 12.81%.
The power drop rate after the thermal shock test was compared to that before the test; this power drop rate was verified to be 16.49%. Furthermore, FF value was also decreased to a greater extent in the ribboned cell as compared to that in the bare cell. Relative to the initial stage, the FF value was verified to be 8.20% after the thermal shock test. In addition, the power drop rate in the ribboned cell was relative to that of the bare cell after the thermal shock test; it witnessed a drastic fall as its value was lowered by 11.41%.
3.2 Surface analysis through the EL Image before and after thermal shock test
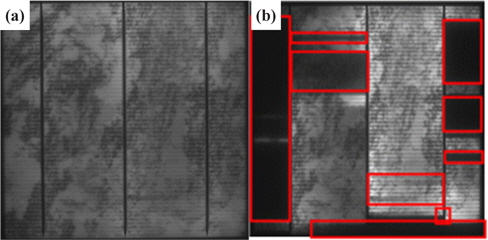
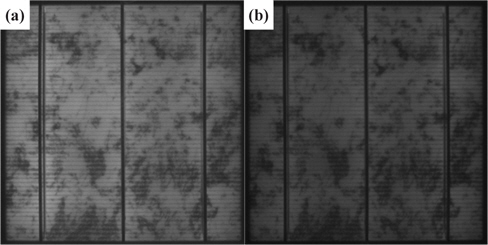
As shown in Fig. 6, EL shooting was used to take images, which were subsequently analyzed to determine the causes of power drop rate by external environmental factors at a bare cell following the thermal shock test. To analyze the surface of the bare cell before and after the thermal shock test, we had to verify that the overall color of the specimen became dark after the thermal shock test. Furthermore, we also had to ascertain that no other abnormality existed to influence the power drop. The color change of the specimen was associated with the degradation of self-illuminating brightness brought about by reversely imposed power. Such a color change resembled the aging of the ribboned cell after the thermal shock test.
However, while analyzing the surface after the thermal shock test, we found that it was short of the gridfinger, because connection failure occurred at the front electrode of the ribboned cell, and a crack developed at the cell surface. This seems to have been influenced by the fact that power drop at the ribboned cell was bigger than that at the bare cell. In particular, we concluded that it is an effect of the local weakened part, which was affected by the thermal shock test. Such a weakened local component corresponded with the environmental factors influencing the thermal stress triggered by CTE of dissimilar materials (Sn-Pb, Ag paste etc.) at the front electrode of the ribboned cell.
3.3 Cross-sectional analysis after thermal shock test
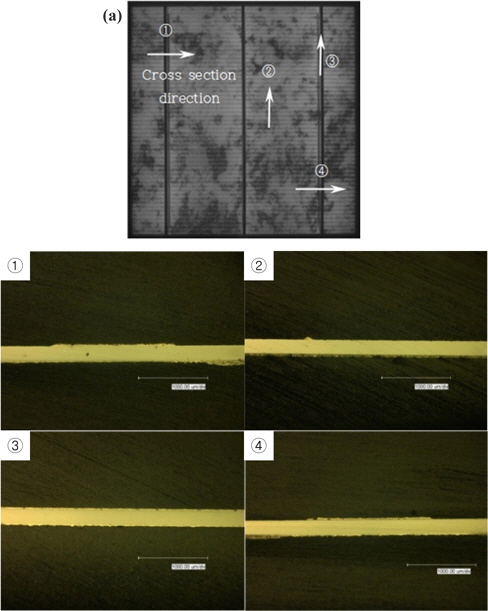
A cross section analysis has been performed on the specimens of those surfaces, which were analyzed by EL shooting after the thermal shock test.
The bare cells induced only change of color in the specimens; these bare cells were observed after the test was performed. Fig. 8 shows the cross section of the specimen after performing a thermal shock test on a bare cell. Fig. 8 shows the cross section of the bare cell that was analyzed. As shown in Fig. 8, no abnormality could be found in all the specimens, ①, ②, ③, ④, even inside the cells like the ones depicted in Fig. 6.
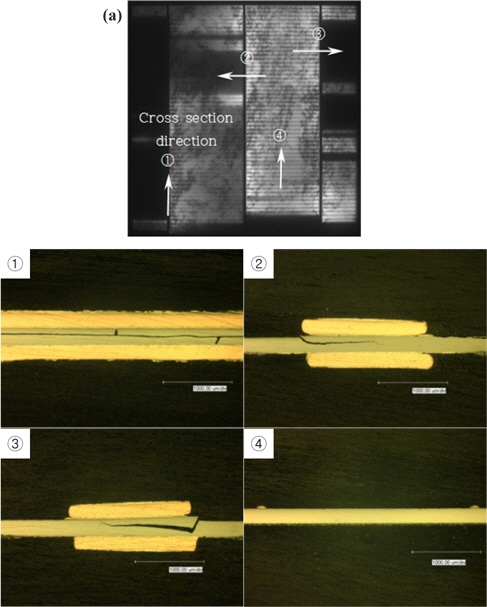
However, in the ribboned cell, the internal crack was not found by EL shooting(See Fig. 9). Nevertheless, a crack could be observed inside the cell through the cross section.
According to Rahul Khatri [8], micro-cracks are observed mainly during the thermal cycling test; these micro-cracks are critical in impacting the reliability of modules in the long-term. Therefore, they should be suppressed to the maximum possible limit. In addition, defects related to the gridfinger affect the FF value by increasing the series resistance of the cell.
In general, most connection failures occur at the ribbon part, as shown in specimen ① of Fig. 9. These connection failures can be attributed to the crack present inside the cell at the front electrode of the ribboned cell. Furthermore, this connection failure occurs because the current flow of the gridfinger influences the crack direction of the cell inside specimens, ② and ③.
While analyzing the results through the pictures of (a), ②, and ③ of Fig. 9, we verified that the self-illuminated brightness at the gridfinger differed, depending on the extended length of the crack. Moreover, the cross section of the short part of the gridfinger had the same result as that with the bare cell; the crack was also verified through ④ of Fig. 9, which was not a crack inside the cell.
3.4 Change of I-V characteristic curve by thermal shock test
A solar cell has the composition of a typical diode in which N is doped into the P-Substrate. The top part of the cell where N is doped can be expressed as the current source. In this case, an electric current originates from positive end of a photon. The ribbon functions as the electrode at the top and bottom sections of the cell that offers resistance. Based on this concept, we express resistance in series (Rs) and resistance in parallel (Rp) through an electrical equivalent model, which is depicted in Fig. 10.
After the thermal shock test, a cell is physically stressed. As a result, problems directly associated with the performance, such as cell cracks and GICS (Gridfinger Interruptions Caused by Soldering [9]) may take place in a ribboned cell, as shown in Fig. 7. Owing to a short circuit in gridfinger, the output falls. Consequently, the current generated by the photons can be passed onto the solar ribbon as the route gets disconnected. The mobile ability of the generated current is expressed as ‘mobility’. The mobility of a solar cell has a value that is very low as compared to that of a conductor. In case the mobility route of an electric current is disconnected due to short circuit at the gridfinger, the current flows through another gridfinger that is close; however, this electric current disappears by recombining with an N-Substrate. In EL analysis, the black part is associated with this phenomenon.
A similar situation can arise due to cracks inside the cell. Cell crack, as its literal meaning, is the phenomenon by which the cell is physically damaged (Fig. 9). In this state, the mobility of the generated current is impossible, because the portion associated with the crack is physically separated. After the thermal shock test, the resistance change inside the cell can be analyzed according to the changes in the resistance in series (Rs) and the resistance in parallel (Rp); such a change in resistance is expressed using the electrical equivalent model shown in Fig. 10.
Here, the resistance in series (Rs) implies the resistance generated by the external environment from the cell surface and the internal part of the cell, such as the ribbon connection part and GICS etc. The initial resistance is “0”. On the other hand, the parallel resistance is defined as the shunt resistance, which is influenced by the damage caused by P-N electrodes; the initial resistance is “∞” for an ideal cell. The effect of fall in efficiency of bare cells and ribboned cells has been analyzed in the I-V characteristics curves plotted after the thermal shock test.
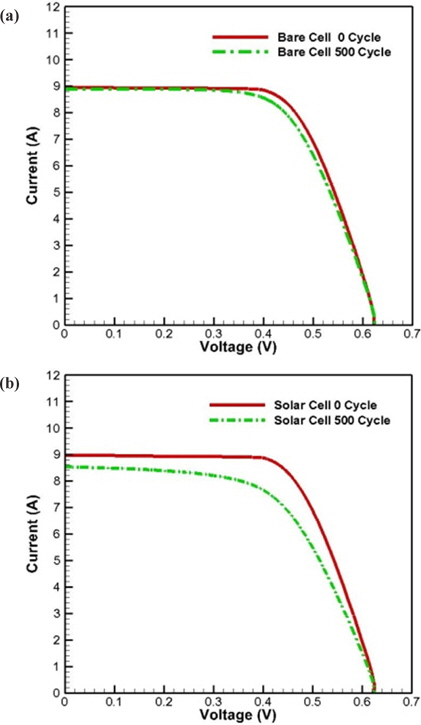
The characteristics of resistances in series and parallel show a rapid curvature change although there is no change of gradient for the current curve, with an increase of resistances in series [10,11]. In contrast, the gradient change of the current curve takes place from the initial stage, showing a tendency of rapid fall when there is a decrease of resistances in parallel.
By analyzing the I-V curve in Fig. 11(a), we infer the changes in curve are due to an increase of leakage current coupled with an increase of resistances in series after the thermal shock test. . The fine GICS after the thermal shock test has increased the leakage current, and the overall brightness has been influenced by this change. According to V. V. Voronkov [12], a reduction in the electronic lifetime is induced by excess electrons, a key effect in the degradation of solar cells based on boron-doped and oxygen-containing silicon. After the thermal shock test, an increase in oxygen content led to an increase of resistances in series. This has an effect on the bare cell’s efficiency fall.
The characteristic of the I-V curve is shown in Fig. 11(b). The resistances in parallel are reduced, while the resistances in series have increased according to this curve. The resistances in parallel have reduced due to damage caused to the P-N electrode by the internal crack of the cell, as shown in Fig. 9. According to T. L. Yang [13], the formation of Ag3Sn increases the series resistances of the cell modules because Ag3Sn had a higher electrical resistivity as compared to sintered Ag. Furthermore, the growth in IMC layer caused an increase of resistances in series. Because the GICS had partially taken place, the fall in efficiency of the ribboned cell was larger than the bare cell, as shown in Fig. 7(b).
In this research, direct causes of power drop have been defined by I-V measurements, EL shootings, and cross section observations conducted while performing the thermal shock tests on a solar cell.
(1) The power drop rates of a bare cell and a ribboned cell were verified to be 5.08% and 16.49%, and we also verified the fact that power drop rate of a ribboned cell drastically fell by 11.41% relative to a bare cell. (2) Owing to the EL shooting after the thermal shock test, mere color changes of the cell were found in the bare cell. In the ribboned cell, the gridfinger had a short circuit, resulting in connection failure at the front electrode of the ribbon part. Therefore, the cracks at the cell surface could be verified. (3) While analyzing the cross section after the thermal shock test, no abnormality was found inside the bare cell. However, in the ribboned cell, a crack was found inside the cell of the front electrode ribbon, which functioned as the connector. (4) While analyzing the I-V curve after the thermal shock test, there was an increase in series resistance of the bare cell. In the ribboned cell, there was a decrease of resistances in parallel but we also witnessed an increase of resistances in series. (5) In a bare cell, the power drop is the life cycle of the cell itself. In a ribboned cell, the crack inside the cell influenced the growth of IMC layer. (6) In order to suppress cell’s internal cracks and the proliferation of IMC layer that directly influences a power drop, future researches must investigate various factors, such as the ribbon tabbing process, the improvement of ribbon materials, and selection of the solder and front electrodes.