Since its discovery in transcription factor IIIA (TFIIIA) from
Mass spectrometry (MS) has been used widely to study metal ions interactions with oligonucleotides, peptides, and proteins.8-17 For zinc fingers, a variety of MS experiments have been used to study, for example, the stoichiometry for zinc ion transfer from metallothionein to zinc finger peptides, Zn2+ chelation by consensus zinc-finger arrays, the Zn2+ binding sites, and relative affinity for other transition metals.18-22
Recently, our group showed electrospray ionization-mass spectrometry (ESI-MS) can be used to study noncovalent complexes formed between a zinc-finger peptide and DNA double helix.23,24 In addition, it was found that the detected noncovalent complexes reflected the binding properties between these two interacting partners.
Because Zn2+ binding is crucially important to zinc fingers in inducing protein folding that ensures specific DNA base sequences are recognized, the Zn2+ binding (or dissociation) constants of zinc fingers are important information for studying zinc fingers. Zinc ion binding constants of zinc fingers are traditionally determined via UV spectroscopy. Despite UV method being widely used, it involves a back titration, which is time-consuming and requires significant sample amounts for analysis.
In contrast, ESI-MS, which is a fast analysis with low sample consumption, has been used extensively to determine the binding constants for various non-covalent complexes formed in solution.25-33 In this study, we proposed an ESI-MS based titration method for measuring the Zn2+ binding constants of various natural and artificial zinc finger proteins.
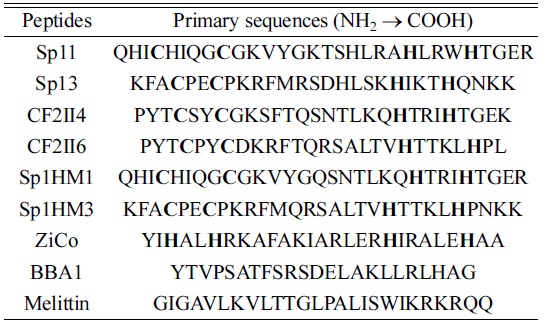
All of the peptides used in this study were custom synthesized via Fmoc-based solid-phase method (Peptron Inc., Daejeon, Korea) and purified using a Prominence LC-20AB RP-HPLC (Shimadzu, Kyoto, Japan). Table 1 shows the peptides and amino acid sequences being studied. These peptides are natural or designed with a C2H2 structure and generally contain a repeated amino acid sequence,
[Table 1.] Peptides and their primary sequences

Peptides and their primary sequences
ESI mass spectrometry was performed using an ion trap mass spectrometer (LCQ Deca, Thermo, San Jose, CA, USA). The mass spectrometry parameters were set as follows: positive mode, +3.5 kV needle voltage, 110 ℃ capillary temperature (note, a low temperature was used to avoid thermally denaturing the zinc finger peptides), +10 V capillary voltage, +20 V tube lens offset voltage, AGC off,
We used the following titration model based on basic thermodynamic equations to determine the peptide-Zn2+ binding/dissociation constants for zinc-binding peptides.

where P represents a peptide.
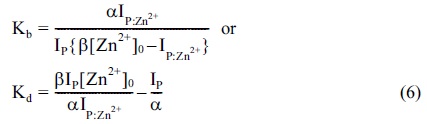
For the peptide-Zn2+ binding reaction 1, the binding/ dissociation constant (Kb or Kd) can be calculated from Equation 2.
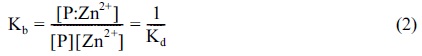
where [P] and [Zn2+] are the concentration of a free peptide and Zn2+, respectively, and [P:Zn2+] represents the Zn2+-bound peptide concentration. During the ESI-MS experiments, [P] and [P:Zn2+] were determined by measuring the ion intensities for the corresponding species. However, because the peptides and Zn2+-bound peptides exhibited different ionization efficiencies, the following equations were suggested.


where α and β are the ionization efficiency (response) parameters for peptide P and P:Zn2+ metal-bound complexes, respectively. The following mass balance equation was established for the Zn+ concentration.

Where [Zn2+]0 is the initial Zn2+ concentration. The above equations yield Equation 6.

Futher,

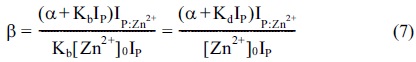
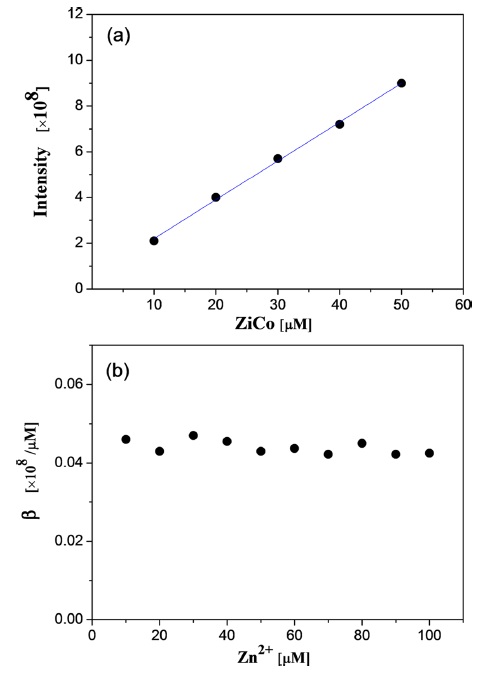
The response factor, α, can be estimated from independent calibration experiments by measuring the ion intensities of P as a function of the peptide concentration. Furthermore, once α is determined, Equation 7 yields the ionization response factor, β, for the Zn2+ -bound peptides,
>
Mass spectra of zinc-binding peptides
To determine the Kb or Kd values from the mass spectrometric results for zinc-binding peptides, the solvent pH and mass spectrometer cone voltage were optimized to favor folded ZFP conformations. For example, the ESI solution pH must be maintained at ~7.5, which is similar to the native environment.
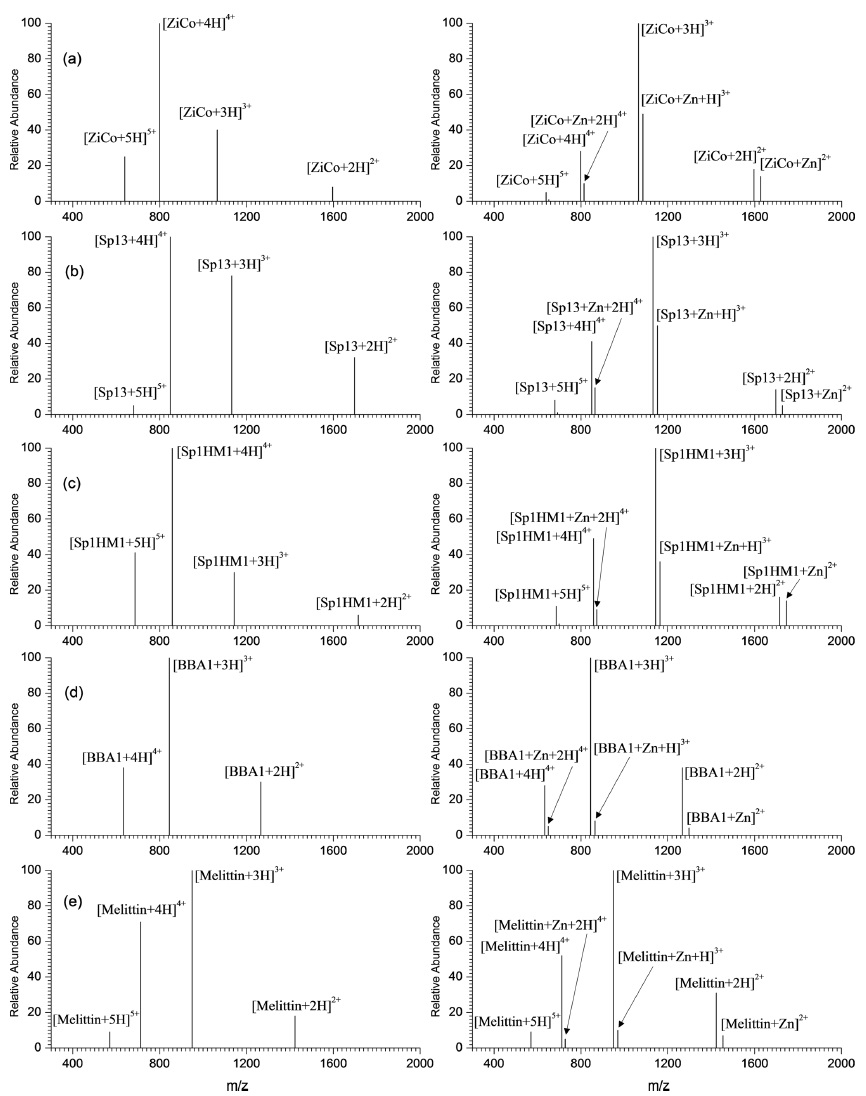
Figure 1 shows the ESI mass spectra obtained using 20 ìM ZFP peptides alone (left panel) and with an equimolar peptide and Zn2+ mixture (right panel). The charge-state envelope generally shifted to lower charge states, when the peptide:Zn2+ complexes formed via Zn2+ addition. For example, ZiCo peptide (Figure 1a) under zinc free conditions exhibited +2 to +5 charges with the +4 charge state being most abundant. Adding zinc ions in an equimolar ratio caused the noncovalent peptide:Zn2+ complexes to dominate with a +3 charge state, while the +5 charge state was negligible. Similar charge-state shifts were observed for other zinc specific binding peptides: Figure 1b, Sp13; Figure 1c, Sp1HM1 [also including Sp11, CF2II4, and CF2II6 (spectra not shown)]. The same experiments were performed using other non-zinc ion binding peptides such as BBA1 and melittin with similar molecular masses, ~3 kDa, to the other ZFPs as a control (see Figure 1d and e). The charge-state shift after Zn2+ binding did not occur for these peptides. Furthermore, Zn2+ binding did occur to any insignificant degree compared to the ZFP peptides.
The above charge-state shift can be understood as the peptide folding after binding to Zn2+. Without Zn2+, the ZFPs tend to exhibit unfolded conformations. However, taking Zn2+ into a Zn2+ binding site formed the ZFP’s specific folded ββα structure, which lowered the overall charge-state distribution.
>
The ratio of ionization response factors, α/β
Here, we used ZiCo, whose Zn2+ dissociation constant was reported as (4±1)×10-6 based on isothermal titration calorimetry (ITC)35, acted as a reference peptide for determining the response factor ratio,
[Table 2.] The response factors α and β [×108/μM]
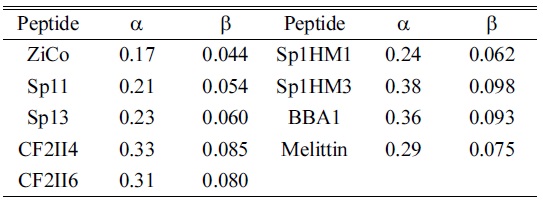
The response factors α and β [×108/μM]
Second, the zinc-free and zinc-binding ZiCo ion peak intensities were measured by adding Zn2+ at 10~100 µM to the 20 µM ZiCo solution. The zinc-free and zinc-binding ZiCo ion peak intensities from the ESI full mass spectrum for each initial Zn2+ concentration,
>
Zn2+ binding/dissociation constant determination
Based on the assumption that all ZFPs have the same α/β ratio, the response factors, β, for other ZFPs could be determined as shown in Table 2.
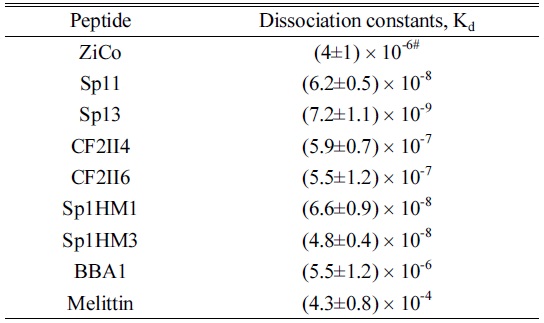
Furthermore, to determine the Zn2+ binding/dissociation constants, the full ESI mass spectra were obtained for 20 µM equimolar Zn2+ :peptide mixed solution of the other ZFP peptides. The β value and Equation 6 could be used to calculate the Zn2+ binding/dissociation constants for a variety of ZFPs (see Table 3). In general, ZFPs exhibited dissociation constants from 10-7 ~10-9. Specifically, Sp13 exhibited the lowest dissociation constant, 7.2×10⁻⁹, Sp1HM1/Sp1HM3 exhibited a moderate dissociation constant, ~10-8, and CF2II4/CF2II6 exhibited the highest dissociation constant, ~10-7. Non-specific peptides, such as BBA1 and melittin, exhibited large dissociation constants, 5.5×10⁻⁶ and 4.3×10⁻⁴, respectively, which is consistent with their Zn2+ non-specificity. Furthermore, the dissociation constant for Sp13 determined here is in the same order of magnitude of the literature value,
[Table 3.] The dissociation constants obtained in this study

The dissociation constants obtained in this study
We propose an ESI-MS based method to determine the Zn2+ binding/dissociation constants for zinc finger peptides, which have conserved amino acid sequences and C2H2 zinc finger motif structures. By determining the ion efficiency parameters for zinc free peptides (α) and Zn2+ -peptide complexes (β) for a reference ZFP,


![The response factors α and β [×108/μM]](http://oak.go.kr/repository/journal/17073/E1MPSV_2015_v6n1_7_t002.jpg)