In this paper, I describe the importance of matrix spraying conditions in imaging mass spectrometry (IMS) to obtain successful imaging results. My developed matrix application methodology, which is a “two-step matrix application” sequentially combined with matrix sublimation and spraying matrix solution can provide high reproducibility and high ion yield compared with a conventional direct spraying method. However, insufficient IMS results were obtained occasionally despite the two-step method. Therefore, I wanted to characterize the methodology to continuously provide high quality data. According to my results, the sublimation time was not a strict parameter, and the most important step was the first spraying condition. This means that the extraction conditions from the tissue section and co-crystallization of the matrix were the most important factors.
Matrix-assisted laser desorption/ionization (MALDI) imaging mass spectrometry (IMS) has recently been applied to the analysis of localized molecules, such as biomolecules and drugs on tissue surfaces. During drug development, evaluating the intra-tissue distribution of the drug in pre-clinical and clinical studies might be useful for assessing its characteristics. Though MALDI-IMS can provide visualization results immediately, there are many experimental steps that should be considered to obtain correct ion distribution information. For example, if the sample preparation is insufficient, the target ion signals are not detected or artifacts derived from matrix crystal aggregation are induced in the resulting images.
I have already published the experimental steps and potential parameters in a previous study.1 Among the steps involved, the matrix application process was crucial for successful imaging. Additionally, I reported a two-step matrix application procedure (hereafter “the two-step method) that combined the vacuum deposition of matrix crystals and the spraying of a matrix solution.2 In principle, the two-step method included
Formic acid, acetonitrile, isopropanol, and dimethyl sulfoxide (DMSO) were purchased from Wako Pure Chemical Industries Ltd. (Osaka, Japan). A 99% grade α-Cyano-4-hydroxycinnamic acid (α-CHCA) was purchased from Sigma-Aldrich (St. Louis, MO). Erlotinib hydrochloride was purchased from Toronto Research Chemicals Inc. (Toronto, Ontario, Canada).
The PC-14 cell line was implanted in BALB/C mice. Erlotinib was orally administered at a dose of 50 mg/kg/day for three days. The mice were sacrificed and dissected at 60 min and at 180 min after treatment on day three. Tissue samples of the dissected tumor were flash frozen in liquid nitrogen. All tissues were stored at -80 ℃ until use.
Frozen 8-µm sections were sliced at -20 ℃ with a cryomicrotome (Leica CM 1950, Leica Microsystems, GmbH, Nussloch, Germany). The frozen sections were thaw-mounted on an indium-tin-oxide coated glass slide (SI0100N, Matsunami, Osaka, Japan) and allowed to dehydrate in a 50-mL conical tube containing silica gel. The glass slides placed in the conical tube were stored at -20 ℃ until matrix application. For intra-tissue drug quantification, serial sections were prepared and placed on the membrane slides (PEN-membrane 2.0 µm, Leica Microsystems, GmbH, Nussloch, Germany).
The two-step matrix application is described in detail below. Tissue specimens in tubes containing silica gel were placed at room temperature for 10 min just before matrix deposition. A sample holder was installed in a vacuum deposition system (SVC-700TMSG, Sanyu Electron Co., Ltd., Tokyo, Japan). The sample holder and matrix holder were positioned 8 cm apart. The matrix holder was filled with approximately 40 mg of α-CHCA powder. The vacuum pressure in the chamber was 10-4 Pa during deposition. Subsequently, the α-CHCA was heated to 250 ℃, the boiling point of the matrix crystals, and the vapor deposition time settings were 5 min, 8 min, 16 min (8 min × 2) and 20 min (10 min × 2).
α-CHCA (10 mg/mL) was dissolved in acetonitrile, isopropanol and distilled water (all containing 0.1% formic acid; FA) at a ratio of 3:1:6. The matrix solution (100 µL) was sprayed using an artist’s airbrush (PS-270, GSI Creos, Tokyo, Japan). The inside of the airbrush was fluorinated (CYTOP CTL-107MK, AGC, Ibaraki, Japan) to minimize metal contamination from the airbrush. The distance between the tip of the airbrush and the tissue surface was 8 cm. For the first 3 cycles, matrix was sprayed for 2 sec at 60 sec intervals, and for the subsequent 7 cycles the matrix was sprayed for 1.0 sec at 30 sec intervals. These pulsed spraying and placement cycles resulted in the formation of a homogeneous matrix layer on the tissue surface using the air-brush. For the first spray characterization, the concentration and spraying time of α-CHCA were regarded as experimental parameters.
Mass spectrometry analysis was performed using a Mass Microscope (Shimadzu, Kyoto, Japan) specialized for IMS experiments.3 A laser diameter of 50 µm and a 60-µm data interval (spatial resolution) were used in this study. The laser irradiated the tissue surface with 150 shots (repetition rate; 1 kHz) for each pixel. All data were acquired in the positive-ion detection mode using an external calibration method. All IMS experiments were performed in MS/MS of
Image reconstruction and averaged peak intensity extraction were performed using the BioMap3.8 software package. The maximum value of gradation was 75-th percentile of the peak intensity distribution in the tumor region.
>
Erlotinib extraction from tissues
Erlotinib was extracted from dissected tissue (area: 0.5 mm2) fragments using the matrix solvent solution (3:1:6 = acetonitrile:isopropanol:distilled water). Extraction solvent (30 µL) was added to each collection tube and the sample homogenized for 1 min using a vortex mixer. The samples were centrifuged at 12000 g at 4 ℃ for 10 min, then 20 µL of supernatant, 20 µL of internal standard (100 ng/mL of d-erlotinib in 30% acetnitril, 10% isopropanol and 0.1% FA) and 500 µL of 2% phosphate buffer were mixed. The sample solution was subjected to SPE as follows (all centrifugations were performed at 4 ℃):
Total volume was 300 µL in 50% methanol/0.1% FA. For the LC-MS/MS analysis, 20 µL of diluted sample was injected.
Chromatographic separation was performed using a XBridge C18 3.5 µm 2.1 × 50 mm column (Waters Corporation) eluted with acetonitrile containing 0.1% formic acid as follows: 0.2 mL/min from 20% to 65% over 4 min, 65% to 90% over 0.1 min, 90% for 1 min, 90% to 20% over 0.1 min and 20% for 2.8 min. The washing buffer was 75% methanol.
>
Quantification of erlotinib using LC-MS/MS
A Prominence ultra fast liquid chromatography system (Shimadzu) with a triple quadrupole mass spectrometer (QTRAP 5500, AB Sciex, Foster City, CA) was used to quantify intra-tissue erlotinib concentration. Sample preparation and chromatographic separation conditions are described in detail in the supporting information. Purified erlotinib extract (10 µL) was injected into the LC-MS/MS system. Mass spectrometry was performed in positive-ion detection mode using the following conditions: multiplereaction monitoring transitions of
>
Thickness of sublimated matrix layer and morphological alteration of α-CHCA crystals
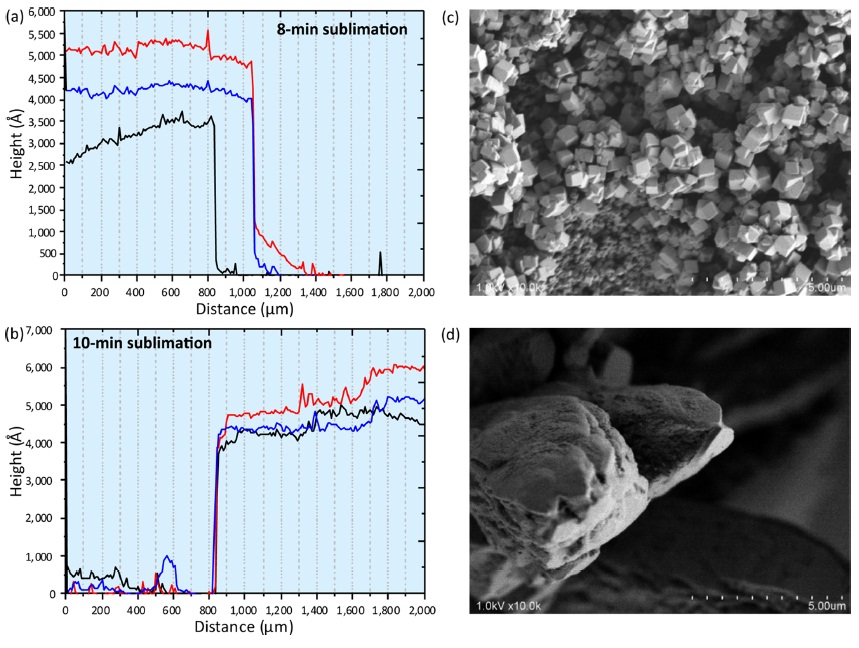
In my previous paper, the sublimation time was always eight min.2 First, the thickness of the sublimated matrix layer was measured using a Dektak3 Stylus Profiler (Bruker, Tucson, AZ). The sublimation time for the prepared glass slides were eight min and ten min (Fig. 1a and 1b). In each sample plate, three line scans were performed (red, blue and green in Fig. 1a and 1b) starting from the sublimated surface to the non-sublimated surface. The “Distance (µm)” in the horizontal axis corresponds to the scan distance in this experiment (0 µm; scan start point, 2000 µm; scan end point). Though the thickness was not homogeneous across different lines, it was approximately 450-500 nm.
Matrix solution spraying onto these matrix layers was performed as the second step. The most important feature in the two-step matrix application was prompt crystal formation on the tissue surface after providing the matrix solution.4 Upon visual inspection, the obtained sprayed layer comprised of tiny and homogeneous matrix crystals. To characterize the crystal morphology, the obtained crystals were observed using a scanning electron microscope. Crystal morphology was quite different between the two-step method (Fig. 1c) and conventional method of direct spraying (Fig. 1d) onto the tissue surface. In the two-step method, the cubic crystal was approximately sub-micrometer in size. These submicron crystals were formed by tiny crystal seeds provided previously in matrix sublimation. On the other hand, the size of the conventional crystal was a few tens of micrometers. According to the crystal observations, the spatial density of the crystal formed using the two-step method was much higher than the conventional crystal. The increased surface area in laser irradiation would assist the matrix desorption.5-7 Therefore I concluded that ion yield was improved using the two-step method.
>
Distribution alteration of different matrix application procedures
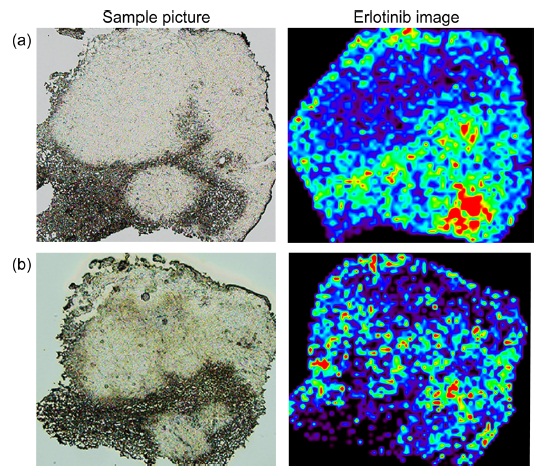
I hypothesized that matrix solution spraying after matrix sublimation was essential for highly sensitive IMS. However, dry coating, which was matrix sublimation only, was also used especially in phospholipid visualizations.8 I found that the product ion peak of erlotinib was detected using only sublimation. Therefore, the molecular distributions in sublimation and two-step method were compared. Surprisingly, the obtained distributions were quite different from each other (Fig. 2a and 2b).
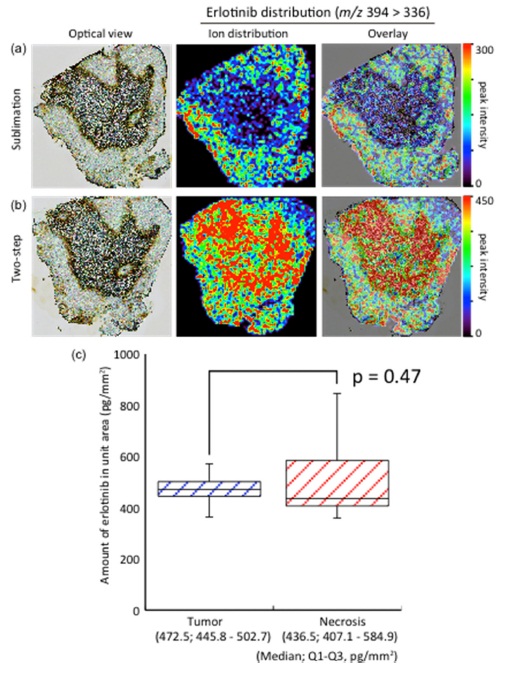
In the sublimated tissue section, erlotinib was selectively accumulated in tumor regions. On the other hand, erlotinib was accumulated in necrotic regions as well as in tumor regions in the two-step method.
To confirm the concentrations, LC-MS/MS quantification using laser microcapture dissected tissues was performed. The tissues from tumor regions and necrosis regions were dissected from serial tissue sections, and erlotinib was extracted from each tissue sample. The erlotinib quantification was performed using the extracted samples. According to the quantification results (Fig. 2c), no significant differences (p = 0.47) in the amounts of erlotinib (median; 25th-75th percentile) were found between tumor regions and necrotic regions. Therefore the correct intratissue concentration in the IMS result was obtained from the two-step method. I consider solvent extraction essential for IMS sample preparations to avoid artifacts.
>
Effect of experimental parameters in the two-step method
In the previous section, crystal refinement and molecular extraction were essential factors for high quality IMS results. I thought that the two-step method would provide highly reproducible sample preparation due to the use of crystal seeds before spraying. However, I occasionally found differences in the images of serial sections obtained by an expert and a non-expert (Fig. 3). In the non-expert’s results (Fig. 3b), the peak intensity was lower than in the expert’s results (Fig. 3a). This difference suggested the existence of other important parameters.
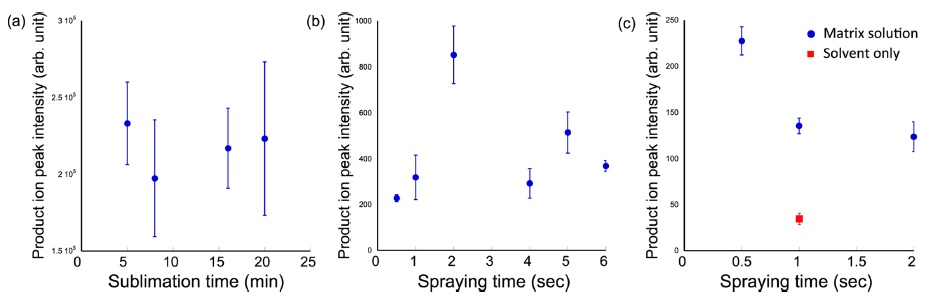
To evaluate the most important parameters in the twostep method, the relationships among ion intensity, sublimation time, the amount of matrix solution and solvent were investigated. First, the product ion intensity of erlotinib was plotted with different sublimation times (Fig. 4a). In subsequent experiments, serial tissue sections were used, with the matrix solution (10 mg/mL α-CHCA) spraying condition in the second step unchanged. IMS was performed in the area of 2.4 mm × 2.4 mm with 60-µm spatial resolution. The averaged product ion intensities of erlotinib were extracted in the tumor regions. As shown in Fig. 4a, significant differences were not observed. Therefore, the sublimation time was not a strict parameter for improvement of ion intensity.
Next, I investigated the effect of the total amount of the matrix solution (also used 10 mg/mL α-CHCA solution) after 8-min matrix sublimation. In this experiment, the initial spraying time was changed from 0.5 to 6 sec. After one-spraying (however, different spraying time), IMS was performed. The peak intensities were increased due to the drug extraction. The maximum peak intensity was observed at 2 sec, and the peak intensities were decreased (Fig. 4b). I hypothesized that ion supression and molecular migration might occur due to the excess matrix solution. Therefore, the optimal amount of initial spraying should be examined in each drug or tissue sample.
Finally, I investigated the effect of the amount of matrix solvent. In this experiment, a solvent composition of 30% acetonitril, 10% isopropanol and 0.1% formic acid was selected. I prepared three different concentrations of matrix solution, i.e., 2.5 mg/mL (two sec), 5 mg/mL (one sec) and 10 mg/mL (0.5 sec) to normalize the amount of α-CHCA after different spraying times. According to the obtained results (Fig. 4c), the peak intensisties were lower with longer spraying times. Additionally, I sprayed solvent onto the sublimated tissue surface. The peak intensity fell by 25% compared to one-sec spraying of 10 mg/mL α-CHCA solution. In this experiment, excess matrix solvent for drug extraction was expected to increase ion yield. However, I found that the ion intensity decreased. I attributed this result to the different co-crystallization conditions. To normalize the amount of matrix compound after spraying, lower concentration α-CHCA solutions were used. With the low concentration matrix solution, the co-crystallization efficiency decreased. The result of “solvent-only spraying would support this observation. Therefore, the concentration of matrix solution was also important to achieve sufficient cocrystallization for high ion yield. The results were completely different in phospholipid imaging.9
In this research, I characterized the two-step method. I demonstrated that the initial spraying conditions to extract drug from inside tissue and co-crystallization were the most important parameters. Insufficient extraction would induce artefacts in IMS results.