Recombinant erythropoietins (EPOs) are an important class of biotherapeutics that stimulate red blood cell production. The quality, safety, and potency of EPO variants are determined largely by their glycosylation, which makes up nearly half their mass. Thus, detailed glycomic analyses are important to assess biotherapeutic quality and establish the equivalency of biosimilar EPOs now coming to market. High-resolution mass spectrometry (MS) has recently emerged as the premier tool for glycan analysis in EPOs. Using the accurate mass measurements provided by high-resolution MS, the compositions of even large, complex glycans can easily be determined. When combined with a nano-LC separation, differentiation of structural isomers also becomes a possibility. These components, together, provide a comprehensive picture of biotherapeutic glycosylation. In this review, we provide an overview of MS-based analytical platform for glycomic characterization of EPO biotherapeutics and biosimilars.
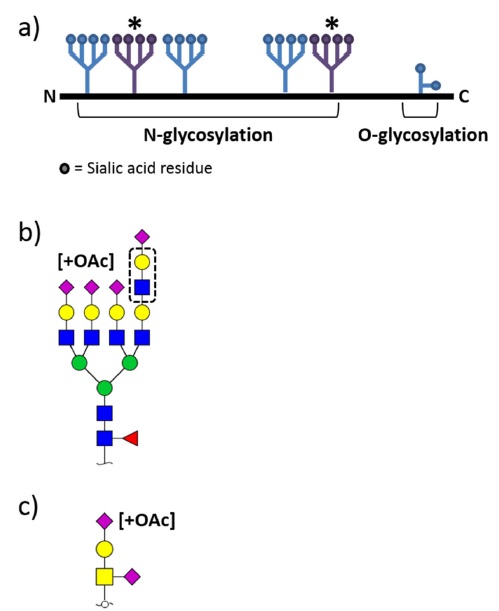
Erythropoietin (EPO) which stimulates the production of red blood cells belongs to cytokine family as a precursor of erythrocyte in the bone marrow.1 It has been mainly used as treatment agent for anemia with chronic renal failure1. Pharmacokinetic parameters of EPOs are known to be largely affected by their glycosylation including sialic acid and its O-acetylation.2,3 Therefore, in-depth characterization of glycosylation is critical step in development and manufacturing processes to ensure safety, efficacy and appropriate pharmacokinetic properties of EPOs. As shown in Figure 1, EPO is a heavily heterogeneous glycoprotein containing multiple N- and O-glycosylation sites with possible glycosyl modifications such as sialylation, phosphorylation, dehydration, O-acetylation on NeuAc, and polylactosaminylation.4
Basic methods of glycan analysis often include chemical derivatization of the glycan (such as addition of fluorescent labels), HPLC separation, and fluorescence detection.5,6 In the biopharmaceutical industry, these methods have often sufficed for past regulatory enquiries about the nature of their biological products. Therefore, there is a serious need for reliable methods that can accurately characterize and evaluate these biological products, particularly in terms of their glycosylation.
Recently, mass spectrometry (MS) has been emerged as premier tool for glycome analysis.5,7-9 It provides rapid and sensitive detection of sample components and can be used as a precise tool for structural elucidation. It should come as no surprise, therefore, that MS has contributed significantly to recent progress towards understanding the role of the glycome in biotherapeutic glycoproteins including mAbs, recombinant proteins (such as EPOs), therapeutic enzymes, and fusion proteins.4,10-16 This review will cover the current state of the arts in MS-based analytical platforms for comprehensive characterization of EPO glycosylation in respect of N- and O-glycome, and site-specific glycoform profiling.
>
MS Platform for EPO N-glycan analysis
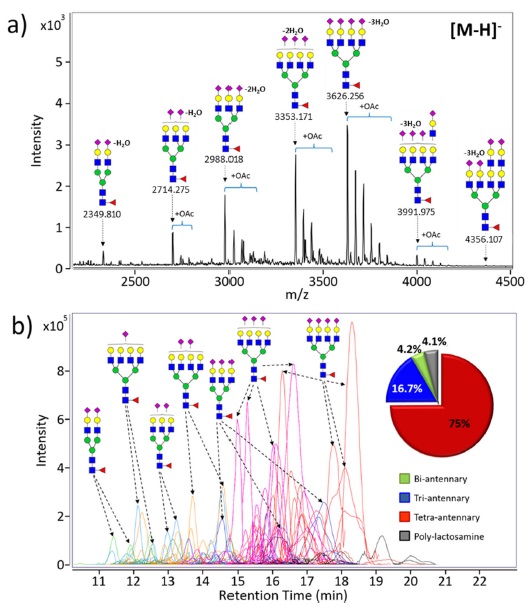
The distribution of EPO N-glycans ranging from bi-antennary to tetra-antennary structures with zero to four sialic acids, as well as polylactosaminylated structures is shown in Figure 1b. Chromatographic techniques such as high performance liquid chromatography (HPLC) and capillary electrophoresis (CE) have been traditionally used to separate and identify heterogeneous EPO N-glycans.17,18 LC-based analytical platform providing great reproducibility makes it possible to quantify EPO glycans by utilizing glycan standards such as a dextran ladder that allows structure assignment using retention times.19 However, this method can be applied to very typical N-glycans, which do not have any modifications such as O-acetylation, dehydration, and phosphorylation, i.e., standard glycans. Indeed, the inherent structural diversity of EPO N-glycans significantly hinders analysis. Recently, with the advent of MS providing higher sensitivity and resolution than LC, analytical platforms have already shifted from traditional chromatographic techniques towards increasing use of MS for glycomic characterization.
EPO N-glycans have been characterized by mainly two types of MS systems; MALDI-MS and LC/MS, respectively. Matrix-assisted laser desorption/ionization (MALDI) usually coupled to high resolution TOF analyzer is suitable ionization method for glycans and is more tolerance toward salts and buffers than electrospray ionization (ESI). Rapid glycan profiling is possible with few seconds of acquisition times in a high-throughput manner.4,5,20 Most of EPO N-glycans are multi-antennary glycans having high sialic acid residues, therefore, EPO N-glycans are analyzed in the negative ion detection mode to obtain overall profiling of N-glycan compositions during MALDI-MS. Figure 2a shows representative MALDI-TOF MS spectrum of native N-glycans released from the second generation EPO (NESP). High resolution TOF-MS provided accurate mass, simplifying identification of molecular ion, compositional assignment of each detected glycans. About 28 N-glycans decorated with a single fucose on the core and different degree of sialic acids (1-4) were identified. In addition, common modifications such as O-acetylation (+42.01 Da) and polylactosaminylation (+365.13 Da) in EPOs are monitored and profiled.
A large portion of glycan heterogeneity stems from glycan isomers. Unfortunately, MALDI-MS obviously cannot separate those with identical masses but different structures. Thus, ESI-MS coupled to chromatographic separation method such as liquid chromatography (LC) become another choice for analysis of glycome.21,22 LC/ MS based platform provides additional dimension of separation to mass spectrometry such as isomer separation, and greater sensitivity than MALDI-MS due to reduced ion suppression.23 The comprehensive analysis of EPO N-glycans have been recently performed using a combination of chromatographic separation by nanoLC with accurate mass MS and structure-specific MS/MS4. Figure 2b shows the PGC-nanoLC/MS analysis of N-glycans found on the second generation EPO (NESP). This platform enables complex and diverse EPO N-glycans to easily separate and detect with high reproducibility on the basis of the size and polarity of glycans. Bi-antennary sialylated glycans elutes at early time points in the chromatogram, and then tri- and tetra-antennary glycans with fully sialylation come out from the PGC-column. The PGC-nanoLC/MS allows the detection and identification of many compounds including anomers and other isomers.4,22 MS/MS of separated glycans and isomers provide detailed structural information (e.g., branching and/or localization of specific modification). In addition, chromatographic peak areas are used for overall glycan quantitation, which suggests that the tetra-antennary/ sialylated glycan is the most abundant of EPO N-glycans (see inset in Figure 2b). Analytical platform using MALDI-MS and LC/MS can provide a comprehensive view of EPO N-glycans.
>
MS Platform for EPO O-glycan analysis
EPO possesses both N- and O-glycans (Figure 1), however current studies on EPO glycan analysis are largely performed on N-glycans. This discrepancy may be stems from differences in N- and O-glycan release strategies. No enzymes are commercially available for intact O-glycan release whereas N-glycans are comprehensively released from available peptide N-glycosidase F (PNGase F), thus the biological roles and properties of N-glycosylation are extensively studied rather than O-glycosylation on EPOs. Instead current O-glycan analysis has been mainly focused on the development of sample preparation methods including selective enrichment for O-glycans from complex mixtures and O-glycans liberation with non-reductive β-elimination for chemical labeling.24-26
Mass spectrometry plays a pivotal roles in the analysis of O-glycans on EPOs. However, signal suppression of O-glycans and overlapping with matrix peaks cannot avoid during MALDI-MS analysis because EPO O-glycans consisting of mainly
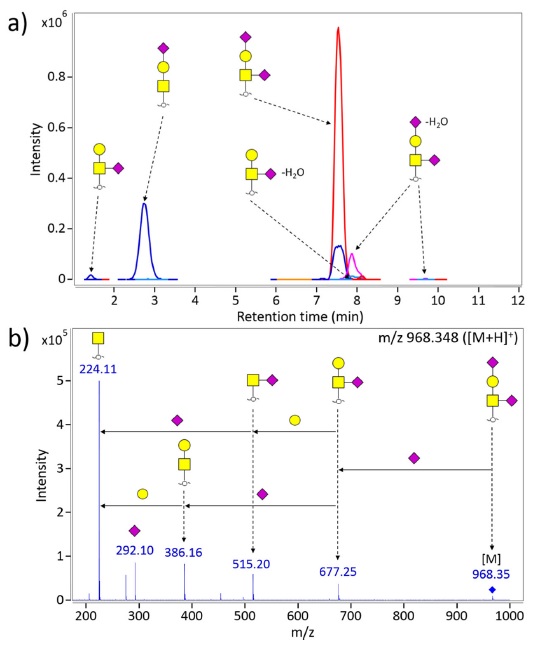
Figure 3a shows representative extracted compound chromatogram for O-glycans of the second generation EPO (NESP). O-glycans were directly liberated by β-elimination from EPO and then enriched by solid phase extraction using PGC cartridge. Separation and detection were performed on PGC-nanoLC/MS. Note that O-glycans are readily identified using LC/MS platform without further interruption and contaminants of N-glycans. Tandem mass spectrometry in the form of collision-induced dissociation (CID) was employed to confirm composition and to obtain structural information (Figure 3b). The most abundant O-glycan in NESP is di-sialylated T-antigen having
Comprehensive profiling of O-glycans is hardly achieved on traditional approaches using β-elimination because the basic condition of chemical releasing methods is highly destructive toward O-acetylation on NeuAc of EPOs. Alternative analytical methods have been continuously required as a result. Recent study showed that O-glycopeptides generated by proteolytic digestion were suitable to characterize sialic acid variants such as O-acetylated sialic acid29. Indeed, O-glycopeptide profiling may be a beneficial and informative tool for EPO O-glycan analysis.
>
MS Platform for Site-Specific Glycoform Profiling
Site-specific glycosylation analysis provides the information of glycosylation sites with associating specific glycans (glycan micro-heterogeneity).30 Production of correctly glycosylated biopharmaceuticals is a significant challenge for drug manufacturers. EPO glycoform depending on specific cell culture conditions is quite heterogeneous and varies significantly because of non-template-driven biosynthetic processes of glycosylation unlike gene and protein. Therefore, the exploration of individual glycoform at each glycosylation site is very important to determine the biosimilarity and comparability assessment of EPO biotherapeutics.31,32
Early studies for site-specific glycopeptide profiling of EPO were done using low-resolution mass analyzers (such as quadrupoles) to search for predicted EPO glycopeptide masses obtained from trypsin digestion.32-34 Recently, a few groups have utilized LC/MS-based platform to determine glycosylation sites with glycan micro-heterogeneity of the first generation EPO.13,35,36 However, site-specific glycosylation analysis is still in its infancy due to the absence of proper technologies and methods. No doubt site-specific profiling will be a powerful platform to provide all of the information available with the localization of glycosylation with glycan heterogeneity. But, in practice, the methods for proteolysis strategy to digest EPOs, glycopeptide enrichment and separation, glycopeptide detection and analysis by MS and MS/MS, and specialized algorithms of MS data interpretation should be developed together for comprehensive site-specific glycoform profiling.5,30
Recently, combination of more than one specific enzyme digestion strategies are used for producing glycopeptides for site-specific glycoform profiling of the first generation EPO.13,35 Unfortunately, the specific-protease based classical proteomic strategy cannot be applied to produce site-specific glycopeptides of the second generation EPO which has two additional N-glycosylation sites due to the limited accessibility and resistance of trypsin and trypsin-like proteases to EPO.37,38 One popular alternative to proteolysis is pronase, one of a large class of nonspecific or ‘multi-specific’ proteases.39-44 It is much easier to produce ‘fingerprint glycopeptide’ consisting of a glycan moiety with small peptide tag to identify glycosylation site with glycan heterogeneity.
MS is currently employed in the final detection step for the analysis of glycopeptides enriched and separated by electrophoresis or chromatography. Prior to MS analysis, enrichment and separation of glycopeptide are an essential prerequisite for comprehensive site-specific glycoform profiling. Recently, porous graphitized carbon (PGC) has gained more attention as a directive tool to enrich and separate glycopeptides selectively from peptide mixtures. Isomer-sensitive PGC nanoLC-MS and nanoLC-MS/MS are used to interrogate N- and O- glycopeptides mixtures digested in solution by various multi-specific proteases.44,45
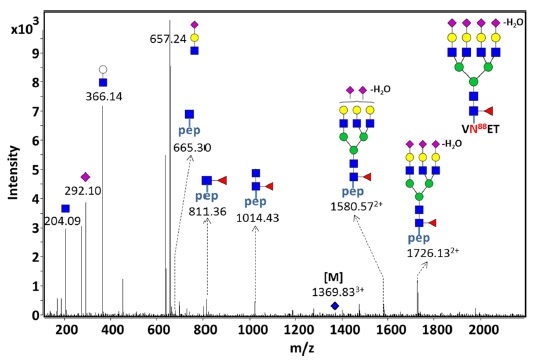
Together with accurate mass, tandem MS (MS/MS) is able to confidently assign the peptides sequence and N-glycan compositions. Especially, tandem MS provides the identities of site-specific EPO glycopeptides and structure information such as antennary (branch) and O-acetyl modification site.45 Figure 4 shows the LC-MS/MS spectrum of site-specific glycopeptide consisting of VNET peptide and mono-fucosylated tetra-sialylated/-antennary glycan moiety. Briefly, NESP having 5 N-glycosylation sites and 1 O-glycosylation site was digested by multi-specific protease to produce site-specific glycopeptides, followed by PGC-solid phase extraction (SPE) to selectively enrich glycopeptides. And then, glycopeptides were separated and analyzed by PGC nano-LC/Q-TOF MS and CID MS/MS. The LC-MS/MS data of the precursor ion
We introduced MS-based analytical platforms for EPO glycome characterization. Now the advancement of MS enables us to analyze glycome such as N- and O-glycan profiling, isomer separation, structure elucidation, and site-specific mapping for the determination of glycosylation site with glycan heterogeneity for biopharmaceutical glycosylation. No doubt, in the next few years, MS-based strategies will be applied to the EPOs as well as other glycoprotein biotherapeutics such as mAbs, fusion proteins, and therapeutic enzymes in industry and regulatory agencies, due to its inherent capabilities with high mass accuracy, high sensitivity, and speed. Meanwhile, standard operating procedures (SOPs) regarding glycome sample preparation prior to MS analysis should be developed and complemented to increase the utilization of MS platform for quality assurance and quality control of glycoprotein biotherapeutics in pharmaceutical industry. In addition, we could assure that glycome database and glyco-informatics tools for effective and reliable analysis in high-throughput manner are absolutely essential for next generation glycotechnology.
![CID Tandem MS spectrum of the ion at m/z 1369.83 ([M+3H]3+) consisting of the tetra-sialylated/-antennary glycan attached on peptide ‘VNET’.](http://oak.go.kr/repository/journal/16971/E1MPSV_2015_v6n3_53_f004.jpg)