This article reviews the fundamentals of sample preparation used in matrix-assisted laser desorption/ionization-mass spectrometry (MALDI-MS). MALDI is a soft ionization method used to generate analyte ions in their intact forms, which are then detected in MS analysis. MALDI-MS boasts fast analysis times and easy-to-use operation. The disadvantages of MALDI-MS include the occurrence of matrix-associated peaks and inhomogeneous distribution of analyte within the matrix. To overcome the disadvantages of MALDI-MS, various efforts have been directed such as using different matrices, novel matrix systems, various additives, and different sample preparation methods. These various efforts will be discussed in detail. This article will benefit those who would like to obtain basic knowledge of MALDI sample preparation and those who would like to use MALDI-MS in their chemical analyses.
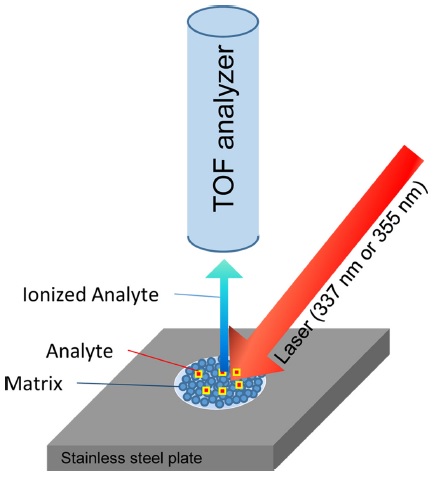
Matrix-assisted laser desorption/ionization (MALDI) is an ionization process that is capable of ionizing nonvolatile, high-molecular-weight compounds in their intact form for subsequent mass spectrometry (MS) analysis. MALDI-MS is a relatively easy method for determining the molecular weight of a compound. Due to its ease of operation, fast analysis times, high mass accuracy, and high mass resolution, MALDI-MS is commonly used for rapid analyses of proteins, peptides, synthetic polymers, glycans, and other macromolecules. In the MALDI process, a laser beam impinges a spot on a stainless steel plate where the sample has been dispersed in a large excess of matrix material. The sample is ionized by interactions with the excited matrix, is detached from the spot, and detected as an ion. Detailed ionization mechanisms are described in other review articles.1,2 Time-of-flight (TOF) analyzers are currently the most commonly used to analyze these ions generated from MALDI, where the time required for an ion to move from the ionization region to a detector region is used to determine its mass-to-charge (
The phase “matrix-assisted laser desorption” was first used publically in 1985 by Michael Karas, Doris Bachmann, and Franz Hillenkamp to describe the mass spectrum of alanine from a 1:1 mixture of alanine and tryptophan using a desorption laser at 266 nm.5 Tryptophan was regarded as an absorbing matrix that resulted in the ionization of nonabsorbing alanine. The “ultrafine metal plus liquid matrix method”, by Koichi Tanaka,6 used a 337-nm nitrogen laser to ionize large molecules such as proteins and synthetic polymers. His contribution to the first large-molecule analysis using laser desorption ionization won him the 2002 Nobel Prize in Chemistry, shared with John Bennett Fenn and Kurt Wüthrich.
This article overviews the sample preparation in MALDI-MS, covering common matrices, novel matrix systems, unique additives and different sample preparation methods.
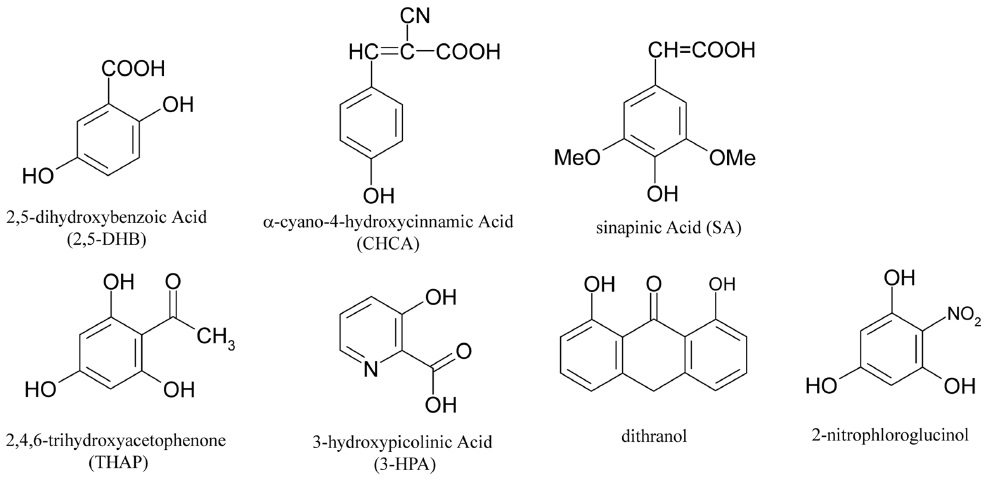
An optimum matrix is determined by the properties of the analyte. Currently, 2,5-dihydroxybenzoic acid (DHB), α-cyano-4-hydroxycinnamic acid (CHCA), and sinapic acid (SA) are the most commonly used matrix materials. Recently, many other organic materials have been evaluated, including 2,4,6-trihydroxyacetophenone (THAP), 3-hydroxypicolinic acid (3-HPA), and dithranol. The selection of an appropriate matrix for each sample is crucial in MALDI-MS analyses. For protein analyses, SA7,8 or DHB8 are effective, while peptide analyses commonly use CHCA8,9 or DHB.8 Carbohydrate analyses use DHB exclusively.8,10-12 Oligonucleotide analyses require either THAP13 or 3-HPA14 as the matrix. Lipids are analyzed using a DHB8,15 or dithranol16 matrix, while synthetic polymers are commonly analyzed using dithranol.17 Recently, 2-nitrophloroglucinol was introduced as a new matrix material that enhances multiply charged protein peaks in MALDI-MS analyses.18,19 Figure 2 shows the chemical structures of several MALDI matrix materials. If the identity of the sample is completely unknown, then DHB is a good starting matrix, since it suits a wide variety of samples as mentioned above.
There are two major drawbacks in MALDI-MS analyses using the above mentioned common matrices. First, there is always interference in the low
To mitigate the effects of sample spot inhomogeneity, binary matrices that include two matrix materials, such as CHCA/DHB,22,23 DHB/aminopyrazine,24 CHCA/3-HPA for phosphopeptides,25 and DHB/CHCA or DHB/SA for glycans and glycoproteins,26 have been developed. Recently, a combination of three materials (DHB, CHCA, and SA) in a single matrix was used to improve performance in analyses of polyethylene glycol (PEG) polymers.27
The combination of an organic acid matrix with a base often yields a viscous liquid known as an ionic liquid. Such materials have more homogeneous surfaces than the crystalline solid surface of an organic acid matrix. Ionic liquids have been used as alternative matrix materials.28,29 For example, an ionic liquid composed of DHB and aniline has been used in carbohydrate analyses30 and various ionic liquid matrices have been used to characterize bacteria.31 Recently, the combination of two matrix materials (DHB and CHCA) with a base (piperidine) and trifluoroacetic acid was found beneficial in phospholipid analyses in both positive and negative ion mode.32
Laser desorption/ionization in the absence of a matrix material has also been evaluated, using an etched porous silicon surface to trap the analyte. This method is called desorption ionization on silicon (DIOS).33 Other alternatives to conventional organic acid matrices include carbon nanotubes,34 graphite,35 pencil lead,36,37gold nanoparticles,38,39 graphene,40 graphene oxide,41 mildly oxidized graphene,42 and wood charcoal.43
A small amount of additive is often used to enhance MALDI signals. Examples include the addition of phosphoric acid to a DHB matrix to improve the intensity of phosphopeptide peaks44 or non-phosphopeptide peaks,45 the addition of serine to a CHCA matrix to eliminate alkali-metal ion adducts,46 the addition of a small amount of detergent (Tween 80) to a CHCA matrix to reduce surface tension and enhance the uniformity of protein analyte distribution,47 and the addition of nitrilotriacetic acid to a CHCA matrix to enhance peptide signals.48 In order to be protonated and detected in positive ion mode MS, samples that do not contain basic residues require a cation additive such as Na+, Cs+, or Ag+.49-51
Several different methods are used to load sample and matrix materials onto MALDI plates. The oldest and most commonly used method is the dried droplet method, in which small portions of the matrix and analyte solutions are mixed. The mixture is then deposited on the MALDI plate and dried.52 In the two-layer, or over-layer, method, a matrix solution is applied first to the MALDI plate, followed by the deposition of a mixture of matrix and analyte solutions.53 In the fast evaporation or thin-layer method, matrix and sample solutions are kept separate. A thin layer of matrix crystal is prepared on a MALDI spot. The analyte solution is then deposited on top of the matrix.54 The sample can also be sandwiched between two matrix layers. In this method, a sample droplet is applied on top of a fast-evaporated matrix spot followed by the deposition of a second layer of matrix material.55 Several research articles have compared the various means of preparing MALDI samples.54-56 Recently, an active drying technique was introduced wherein the final analyte/matrix drop on the MALDI plate is dried rapidly in a vacuum chamber or under an air flow in order to increase crystal homogeneity and sensitivity. Compared to passive drying, this active drying technique results in a uniform, disordered polymorph and can provide 5- to 10-fold greater sensitivity in MALDI-MS analyses of carbohydrates in a DHB matrix.57
It is important to identify a suitable matrix and sample preparation method for an investigation. Padliya and Wood56 compared different matrices and different sample preparation methods in MALDI-MS analyses of tryptically digested protein samples. They found that DHB generally provided higher sequence coverage than other matrices, while no single sample preparation method was exclusively better than the other methods. Kussmann
Due to their inherently easy operation, fast analysis times, high mass accuracy, and high mass resolution, MALDI-MS analyses are popular in various fields and expected to increase in popularity. To fulfill the demand, various efforts have been exerted in MALDI sample preparation using neat matrices, new combinations of matrices, and suitable additives. These efforts are expected to continue to improve MALDI signals and provide reproducible results. A great deal of effort must usually be expended to analyze an uncharacterized sample, since each analyte may require a different matrix or sample preparation method. Generation of a universal matrix system would greatly benefit the researchers in the field of MALDI-MS. MALDI imaging mass spectrometry (IMS) is also gaining popularity. In MALDI-IMS, the spatial distribution of molecules of interest can be visualized without labeling and can result in information comparable to that obtained from traditional histology.58 MALDI-MS spectra are known to be irreproducible. Recently, sample inhomogeneity and variation in MALDI plume temperatures were identified as two factors responsible for spectral irreproducibility.59 Reproducible quantitative mass spectra were obtained at a fixed initial plume temperature, achieved using a total ion current-control method.60 It is expected that much more effort will be focused on improving the reproducibility of MALDI-MS analyses and thereby providing reliable quantitative information.