In the field of finance, mean reversion properties of asset prices have been widely investigated to examine the validity of the contrarian investment strategy.1 Despite extensive studies, empirical evidence on mean reversion of stock prices is still mixed at best.2 A growing quantity of literature has also started investigating mean reversion among international stock price indices. Among others, Kasa (1992) reported cointegrating relations for the national stock indices of five developed countries, while Richards (1995) found no such relations when he used proper critical values.
More recently, Balvers
It should be noted, however, that their technique is subject to the following problems. First, their SUR estimation imposes a homogeneity assumption that assumes all countries share identical speeds of mean reversion. This is a very strong assumption and contradicts common wisdom. Second, their panel unit root testmay have a serious size distortion problem in the presence of cross-section dependence, which was pointed out by Phillips and Sul (2003).
We note that SUR/panel unit root tests are not the only way of improving the power of unit root tests, and take a different approach by implementing a nonlinear unit root test proposed by Kapetanios
Unlike the conventional linear unit root test, their tests allowsmooth transition between the stationary regime and the nonstationary regime around the long-run equilibrium value, which can be justified by nonlinear adjustments of financial market variables in the presence of fixed transaction costs.3 Using the Morgan Stanley Capital International (MSCI) stock index data for these countries, we find very strong evidence of nonlinear mean-reversion across these countries.We also find that only some, but not all, Emerging Asian countries possess nonlinear cointegrating relations with the US stock index as well as theWorld stock index, which provides less support for the homogeneity assumption of the SUR unit root test.
Similar work has been done by Lim and Liew (2007) and Hasanov (2007), who test the nonlinear mean reversion for individual Asian equity prices. It should be noted, however, that they test the unit root null hypothesis for the nominal equity prices without taking any economic fundamentals (e.g., price-earning ratio or dividend yield) into consideration.4 Our work is different from theirs, since we test the nonlinear mean reversion for the
To deal with the second issue, we implement an array of panel unit root tests, including a newly proposed nonlinear panel unit root test by Cerrato
The rest of the paper is organized as follows. Section 2 describes our baseline linear model of stock indices in two countries.We extend this model to a nonlinear adjustment model in Section 3 and to a nonlinear panel model in Section 4. Section 5 reports our main findings. Section 6 concludes.
1If asset prices are mean-reverting, short-selling assets with relatively better performance and buying assets with poor performance in the past may create excess returns. See DeBondt and Thaler (1985). 2For example, Fama and French (1988) and Poterba and Summers (1988) found evidence that favors mean-reversion in US stock prices.Yet, many others questioned the validity of mean-reversion on the robustness issue with regards to the choice of sample period (Kim et al., 1991), the distributional assumptions (Kim et al., 1991; McQueen, 1992), and small sample bias (Richardson and Stock, 1989; Richardson, 1993). 3For example, in the presence of market frictions or transaction costs, arbitrages occur only when the deviations from the fundamental values are big (see, among others; Dumas, 1992; Michael et al., 1997). In other words, when the deviations are relatively small, asset prices may exhibit local nonstationarity around the long-run equilibrium values in the absence of any arbitrage. When dealing with an aggregate price index, a smooth transition model would make more sense, since the transaction costs might be different across the products. 4One may test the unit root null for the nominal price deviations from a fundamental variable such as the dividend yield and the price-earning ratio. 5Kim (2009) finds similar results for stock price indices of 18 countries with well-developed capital markets.
2. The Linear Cointegration Model
We first consider a linear model for the stock markets in two countries,

and

be the log of the stock index and the log of its fundamental value for country

is mean-reverting around

its stochastic process can be represented as the following error correction model,

where −1 <

is an idiosyncratic mean-zero i.i.d. process. The time-varying fundamental term

a possible unit root process, is not directly observable but is assumed to obey the following stochastic process,

where

is the common component for

and


is an idiosyncratic zero-mean, possibly serially correlated stationary process.
Combining equations (1) and (2), we obtain

where
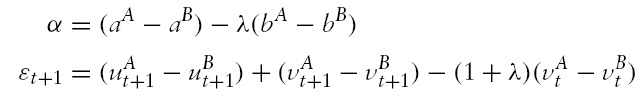
For notational simplicity, let rt denote the stock price deviations (or the relative stock price),

Lagging time subscript by one, we get
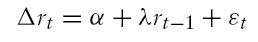
or equivalently,

where
Note that the error term

is an i.i.d. process. In order to control this serial correlation, we augment the equation (4) as follows:
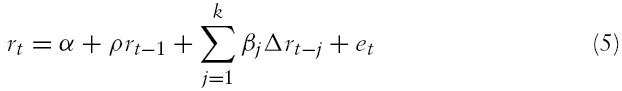
where
Note that the regression equation (5) is a conventional augmented Dickey-Fuller (ADF) regression equation with a known cointegrating vector [1 –1] for the integrated processes

and

When

and

share acommonunit root process

in equation (2), the stock price deviation
3. The Nonlinear Cointegration Model
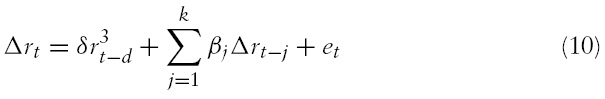
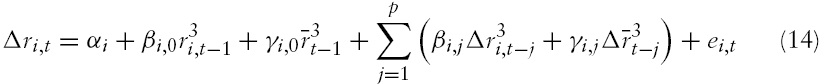
We extend the regression model (5) to a nonlinear cointegration model that allows nonlinear adjustments of the stock price deviation

where

and
Note that when

becomes about zero, and the equation (6) reduces to a stationary
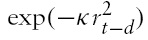
is about unity, which leads to a unit root process.
Since

By the Taylor approximation of equation (7), they obtained the following equation

They show that, under the unit root null, the least squares
has the following asymptotic distribution
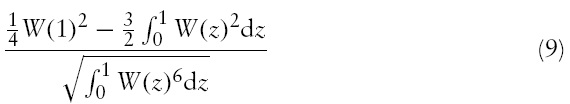
where
When error terms (
6This is the so-called Davies’ Problem.
4. The Nonlinear Panel Cointegration Model
Lastly, we consider a nonlinear panel cointegration test proposed by Cerrato
For this purpose, rewrite equation (7) as follows.

where
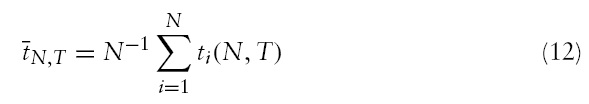
where

for the serially uncorrelated error case and for the serially correlated error case, respectively, and

is the cross-section average at time t,which proxies thecommon factor component for
Note that, in the absence of cross-section dependence,
7Recall, in Section 2, that we construct ri,t as a deviation of individual stock price from its fundamental value. Therefore, ft can be interpreted as any remaining common shock components that originate from the emerging Asian countries.
We use the monthly data obtained from the Morgan Stanley Capital International (MSCI) for stock market indices of nine Emerging Market (EM) Asian countries, the US stock index, and the World stock index as well as two local reference indices, the EM–Asia and the EM–Far East indices. The data cover the period fromDecember 1987 through December 2007 with the exceptions of China, India, and Pakistan.8 The observations are end-of-period value-weighted stock prices of many companies in each market. The indices include reinvested gross dividends and are transformed to the US dollar terms using end-of-period foreign exchange rates.
Table 1 presents descriptive statistics for the logarithm of the stock price indices for Emerging Asian countries and reference indices.
Following Balvers et al. (2000), we begin our analysis by implementing the ADF test for the stock price deviations of EM–Asia indices relative to the US stock index and the World stock index. We choose the number of lags (
[Table 1.] Descriptive statistics for the log stock price indices
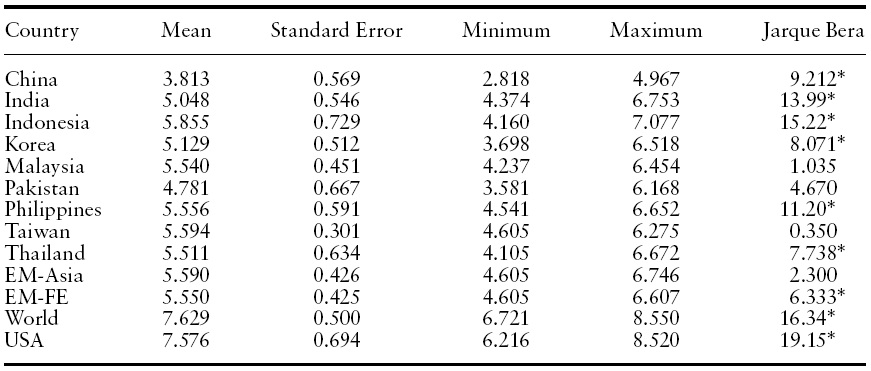
Descriptive statistics for the log stock price indices
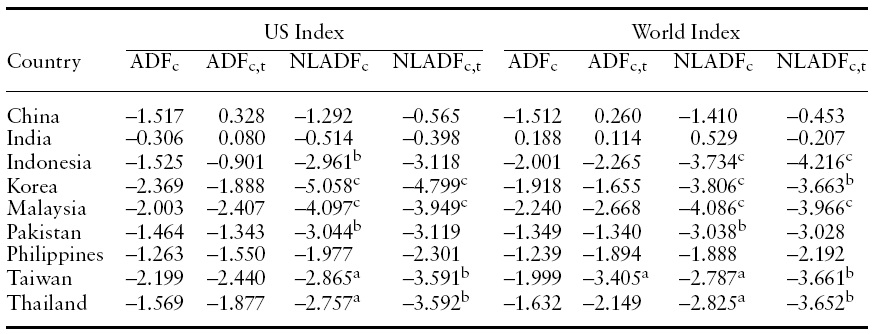
[Table 2.] Unit root test for the log stock price deviations relative to reference indices

Unit root test for the log stock price deviations relative to reference indices
In contrast to the results from the ADF test, our nonlinear unit root test rejects the null of unit root for four countries, Indonesia, Korea, Malaysia, and Pakistan, at the 5% significance level irrespective of the choice of the reference index. When we relax the significance level to 10%, the unit root null is rejected for two more countries, Taiwan and Thailand. Such findings imply that the stock price indices in many EM Asian markets exhibit so-called ‘coupling’ relations with these reference indices in the long-run. Our findings also suggest that there exist non-negligible sources of market frictions in EM-Asia markets. It is interesting to see that we find strong evidence of mean-reversion for a subset of these countries. This finding implies that the homogeneity assumption by Balvers
Next, we turn our attention to pairwise unit root tests across EM Asian countries (see Table 3). Again, the linear test hardly rejects the unit root null. The only exception is Korea, where the test rejects the null for a maximum of four out of eight local partners. Surprisingly, the nonlinear test with an intercept rejects the unit root null for 18 out of 36 pairs favoring nonlinear mean reversion (Table 4). By allowing trend stationarity, we obtain seven additional rejections totaling 25 rejections out of 36 pairs.
We also consider the cases when a local aggregate stock index such as the EM–Asia index or the EM–Far East index serves as a reference index. Again, we obtain very strong evidence of nonlinear mean reversion for the deviations of China, Indonesia, Korea, and Taiwan relative to these local reference indices. It is interesting to see that the stock indices of China and Taiwan exhibit very strong tendencies toward these local indices, whereas they have relatively weak long-run relations with the US stock index and theWorld stock index.We interpret this as the evidence of localized stock markets for those countries.
Lastly, we implement an array of panel unit root tests with four different reference indices, the US index, theWorld index, the EM–Asia index, and the EM–Far East index. Results are reported in Table 5.
We first test the null of a unit root with the linear stationarity alternative hypothesis using the IPS panel unit root test. The IPS test fails to reject the null hypothesis for all cases even at the 10% significance level. However, a nonlinear IPS-type panel unit root test, based on equations (13) or (14) with a restriction of
Next, we implement the cross-section augmented IPS-type (CIPS) test by Pesaran (2007) as well as the nonlinear CIPS (NCIPS) test by Cerrato
8For these countries, the observations span from December 1992 ending December 2007. 9Note that mean-reversion property is more closely related to the ADF test with an intercept only, since rejecting the unit root null from the ADF test with both intercept and time trend implies that the series is trend stationary. Therefore, the ADF test with both deterministic terms should be understood as a supplementary test when the test with an intercept only does not reject the unit root null. 10This casts doubt on the results of Balvers et al. (2000) and Chaudhuri and Wu (2004).
This paper investigates nonlinear mean reversion across international stock markets using Morgan Stanley Capital International monthly stock index data for nine Emerging Asian countries along with both the global and the local reference indices. As a preliminary analysis, we implement conventional linear unit root tests for the stock price deviations relative to reference indices. The linear test fails to reject the unit root null for most countries. Pairwise tests yield similar results.
[Table 3.] Linear unit root test for the log stock price deviations across EM-Asia countries
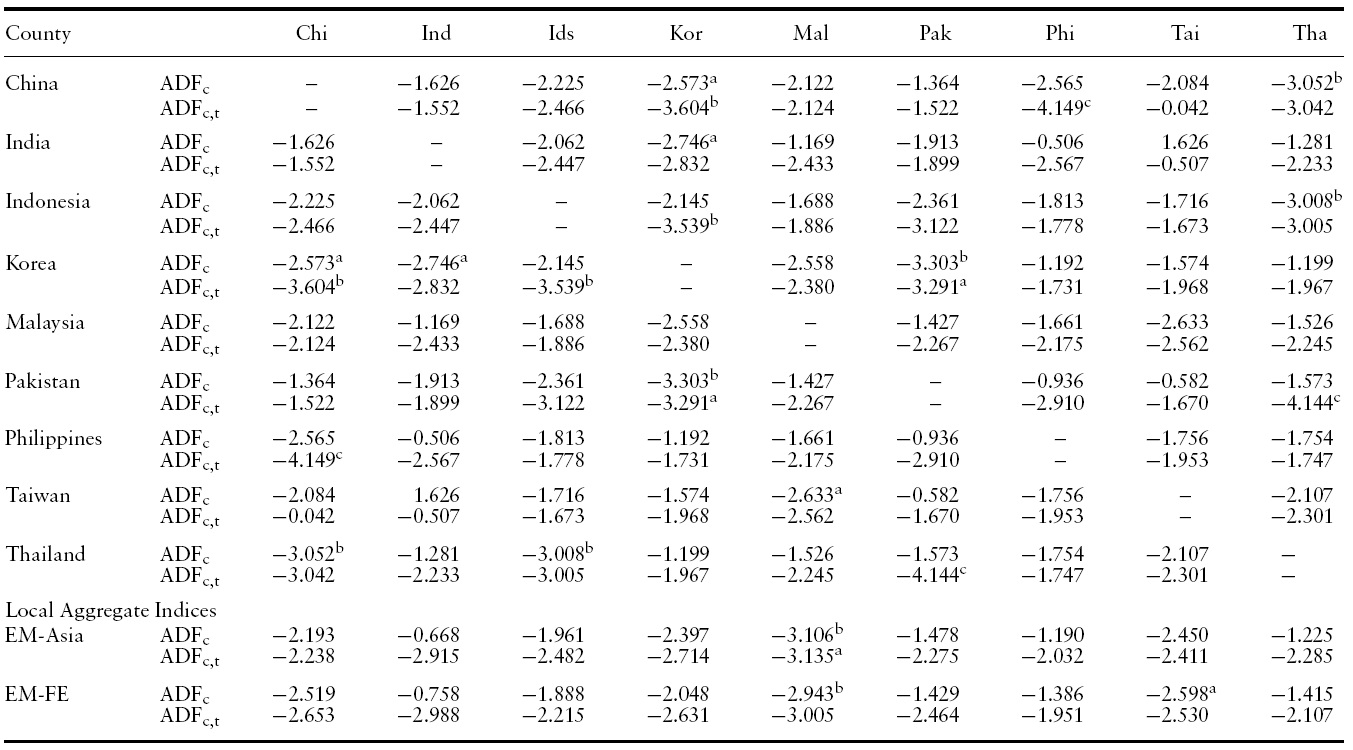
Linear unit root test for the log stock price deviations across EM-Asia countries
[Table 4.] Nonlinear unit root test for the log stock price deviations across EM-Asia countries
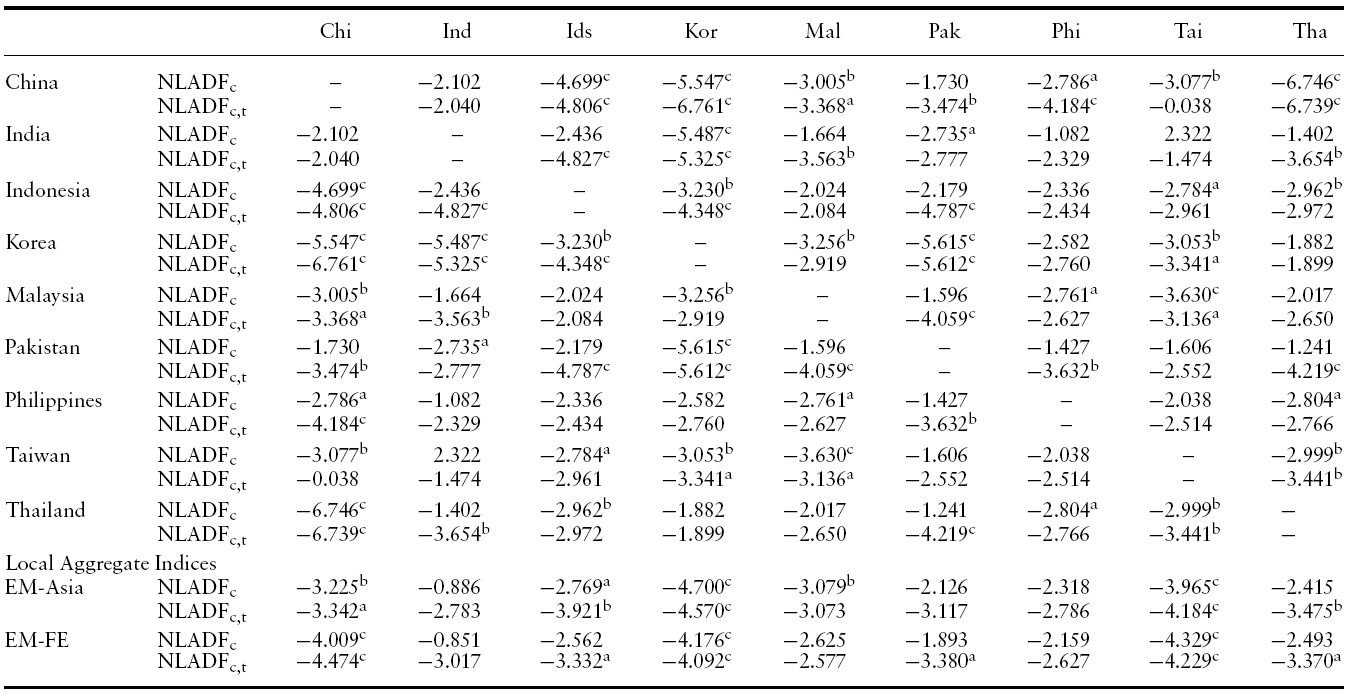
Nonlinear unit root test for the log stock price deviations across EM-Asia countries
[Table 5.] Panel unit root tests for EM-Asia countries
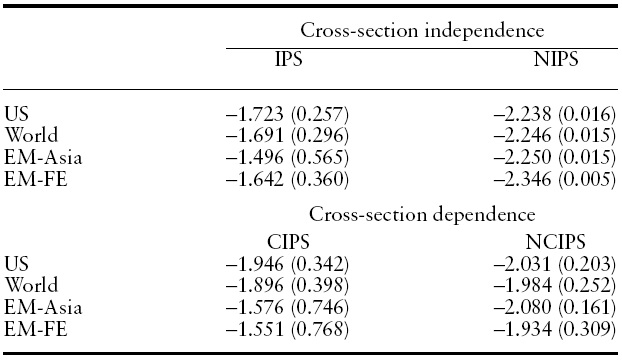
Panel unit root tests for EM-Asia countries
As Taylor