The Internet has become an essential component of communications and a growing body of literature has established the significance of its role in economic growth, productivity and competitiveness. A recent study by Gillett
In large part, comparisons of broadband infrastructure and adoption among more developed countries are based on the widely-reported figures regarding broadband adoption across member countries of the Organisation for Economic Co-Operation and Development (OECD). These statistics are frequently cited in US telecommunications policy debates, as many see the United States’ rank of 15 of 30 a consequence of too little or toomuch regulation (depending on which side of the policy debate you are on) (for example, Consumer Federation of America, 2007). The US has fallen from a rank of fourth in 2001 to its present position of 15th, which many interpret as a sign of policy failure.
These raw ‘broadband subscriptions per capita’ data and the rankings thereof are reported by the OECD on a biannual basis.1 To make the data more sensibly comparable across countries with widely disparate populations, the OECD normalizes (or conditions) the data on population, expressing subscription counts in per-capita terms. However, as the significant differences across OECD countries are not limited to population, citing to rawOECD data, without further analysis, may present a misleading picture of broadband adoption and may provide a poor basis upon which responsible public policy can be developed (Holahan, 2008). A more relevant comparison of broadband success takes into account a wide range of economic and demographic endowments, looking not to raw subscriptions as an efficiency measure but rather at a failure to perform up to expectations. Put simply, a poor country can be a more ‘efficient’ adopter of broadband than a rich country even if its raw, broadband subscriptions per capita rate is lower.
Using broadband subscriptions and country-specific data on income, income inequality, education attainment, age, and so forth, we apply two types of regression analysis – Least Squares and Stochastic Frontier Analysis – to assess the performance of OECD countries with respect to broadband Internet subscription. With Least Squares, we measure the performance of countries by comparing the actual and predicted subscription rates. This approach simply computes what we call the Broadband Performance Index by scaling the regression disturbance. With Stochastic Frontier Analysis, we also measure the relative performance with which endowments are converted into the broadband subscription, but unlike the Least Squares approach this methodology separates efficiency effects from the typical econometric disturbance.We call the technical efficiency parameter from frontier analysis the Broadband Efficiency Index.
Despite the theoretical and practical differences in computation, the two measures of performance yield very similar results. Greece, Ireland, Slovakia, the Czech Republic, and Luxembourg are all relatively poor performers. In contrast, Iceland and Belgium are exceptional performers, with broadband adoption rates well above expectations. Most other OECD countries are good performers, meaning that they are currently converting their demographic and economic endowments into subscriptions at a high rate of relative efficiency.
We believe that our findings are relevant to telecom policymakers worldwide. It is important for policymakers to understand the conditions that drive the rate of broadband adoption and the extent to which telecom policy may have a role. It is not uncommon for advocates to claim that a country is ‘behind’ a peer in ‘broadband subscriptions per capita’ to support a desired policy outcome, but our analysis demonstrates that such arguments are likely misguided. Raw subscription rates are exceedingly poor indicators of relative efficiency. While we believe that telecom policy can play an important role in the diffusion and adoption of broadband technology, its influence and motivation is complex.What we attempt to do in this paper is provide a basis for understanding the factors that drive broadband adoption and provide some methods for policymakers to examine targeted responses to the particular conditions that may be holding back the pace of broadband adoption in their country. For example, we show below that income inequality is a major factor that explains the rate of broadband adoption in the United States, so programs targeted at mitigating that effect (such as computer training and ownership programs) may be an effective means of driving up the overall rate of adoption.
This paper is not, of course, the last word on this important policy issue. New data come every six months and different specifications and estimation procedures may render slightly different outcomes. These differences across both time and method may be important for public policy. There are fundamental questions to be asked, such as: what are the demographic and economic conditions that are most important to condition the data on? What are the policy-relevant and what are the exogenous determinants of broadband subscription?There are many important and interesting questions, and we merely initiate the analysis, rather than end it, in this paper.
This paper is organized as follows. In section 2,we provide the basic theoretical underpinnings of the estimation approaches and calculations of the efficiency measures. In section 3, we summarize the details of the estimation. Results are summarized in section 4, with conclusions in section 5.
1The OECD broadband data is available at http://www.oecd.org/sti/ict/broadband. The OECD updates this data every six months.
Our statistical approach is straightforward. Using data on broadband subscription rates and demographics across the OECD, we use a regression analysis to quantify the relationship between economic and demographic endowments and subscription. In particular, we examine GDP per capita, income inequality, education, population age, population density, telephone subscription, and the price of broadband services. Throughout this paper we called these demographic and economic conditions ‘endowments’.
Using the results of the regressions, we then compare the actual and predicted subscription rates to see whether a country meets, exceeds, or falls below what would be reasonably expected given its demographic and economic endowments. We use two methods of making this comparison – the Broadband Performance Index (‘BPI’), derived from the difference in actual and predicted subscription from a Least Squares regression, and the Broadband Efficiency Index (‘BEI’), which is the technical efficiency parameter from Stochastic Frontier Analysis (‘SFA’). Stochastic Frontier Analysis (‘SFA’) is ideally suited to comparing the performance of OECD countries with regard to broadband subscription rate. In essence, SFA is a linear regression technique (estimated by maximum likelihood) with a disturbance that has two components – a standard two-sided disturbance and an additional strictly non-negative disturbance (Kumbhakar&Lovell, 2000; Coelli
While the frontier approach seems suited to this challenge, it is not without its problems. Least squares estimation is exceedingly robust, but frontier models are estimated by maximum likelihood and convergence can be fickle to model specification. In some cases, the efficiency measure cannot be adequately estimated and the frontier approach devolves into least squares. In other cases, convergence is not achieved. Fortunately, we are able to get sensible results for both LS and SFA specifications. Notably, the two approaches provides similar, but not exact, predictions regarding efficiency.The strongest evidence of good and bad performance is generally consistent across both procedures. Consequently, in future applications, if the SFA fails to converge or poorly estimates the efficiency measures, the LS remains a viable option.
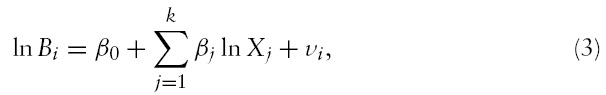
A formal description of our econometric approach is as follows. Let the relationship between (per capita) broadband subscription and a country’s endowments be

Given the standard disturbance term of least squares regression, we have

If there are

which can be estimated by least squares. Using the estimates from equation (3), we then compute the Broadband Performance Index as

where the BPI is scaled so that it lies between −1 and 1, with larger (more positive) values indicating better performance than endowments would suggest (and negative values poor performance). A value near zero indicates performance is consistent with the country’s demographic and economic endowments.
A problem with this approach is that the disturbance
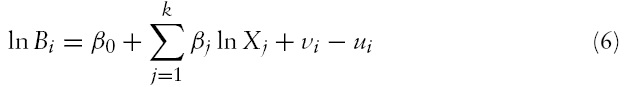
To incorporate efficiency into the estimation process itself, let

where

where
Practically, the term
From equation (6), the Broadband Efficiency Index is computed using

where the BEI is simply the ‘technical efficiency’ parameter
The BPI and BEI are of different scales with the former bound on the (−1, 1) interval and the latter on the unit interval.While we could rescale the BPI on the unit interval as well this likely creates more confusion than it resolves. The BPI is derived froma two-sided disturbance with a normal distribution,whereas the BEI is based on a one sided disturbance (in this case with an exponential distribution). So, even if both are defined on the unit interval, the two are largely incomparable from the standpoint of their actual values.
For estimating equations (3) and (6), we use the broadband subscription data published every six months by the OECD. The last three periods of available data are used to create a pooled dataset. Given the short period covered (18 months), we assume the estimated parameters are constant. The impact of time is handled using period dummy variables (Holzer
While there are data on broadband subscriptions per capita dating back to 2001, we do not employ the full complement of data for a few reasons. First, the diffusion process of broadband subscription diffusion is highly non-linear, and the econometric model would need to incorporate this non-linearity for reliable parameter estimation. SFAis unlikely to be a feasible estimation approach under such conditions. Second, some of the regressors are not updated regularly, implying they will be constant over the sample period. As such, fixed effects estimation techniques are not possible given the colinearity of the fixed effect with the covariates. Third, fixed or random effects estimates will capture, in part, the idiosyncratic policy influences in each individual country, thereby limiting the interpretability of the efficiency parameter as a measure of policy impact. Finally and practically, public policy is inherently interested in the present and not the past. As such, focusing on the latest available data provides more policy-relevant findings.While we focus on the most current subscription information, we regard an expanded analysis using the full set of time series data as a sensible extension of this research.
3.1 Regressors and Expectations
Our empirical model is formulated to be consistent with prior research including Aron and Burnstein (2003), Chinn and Fairlie (2004), Gruber and Denni (2005), Horrigan (2004), Lee and Marcu (2007), Prieger (2003), and others. Broadband is a service and we expect price to be relevant. While we expect the coefficient on
Income inequality is expected to reduce broadband subscription and we measure inequality using the Gini Index (
The bulk of the data is provided by the OECD
Price data are provided by an
Since the subscription rate is akin to a penetration rate, we estimate Equation (3) by Weighted Least Squares (WLS) to account for the non-constant variance of the dependent variable (Maddala, 1983, p. 29). In the natural log form, the variance of
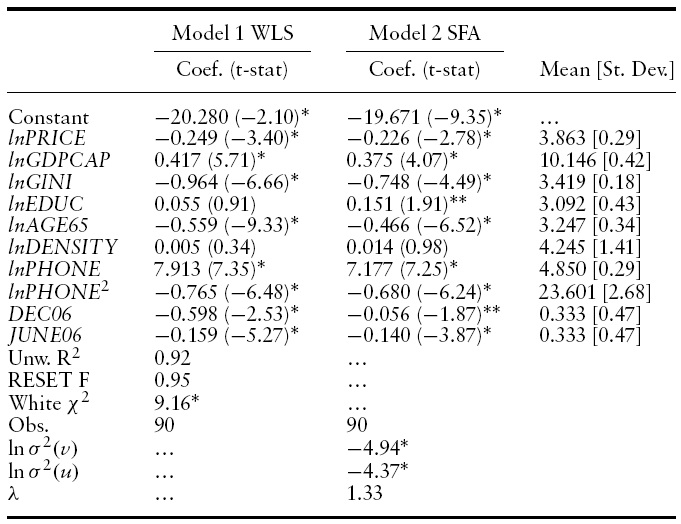
The econometric results and descriptive statistics are summarized in Table 1. Model 1 is estimated by WLS and Model 2 by SFA. The coefficient estimates across techniques are similar. Table 2 provides the BPI and BEI estimates for each country, and the countries are sorted by relative efficiency scores. Each country’s ranking for the latest available broadband raw subscription data is also provided in the table.
Both models exhibit good statistical significance, with most regressors significant at the 5% level or better. In Model 1, neither
[Table 1.] Summary of econometric results

Summary of econometric results
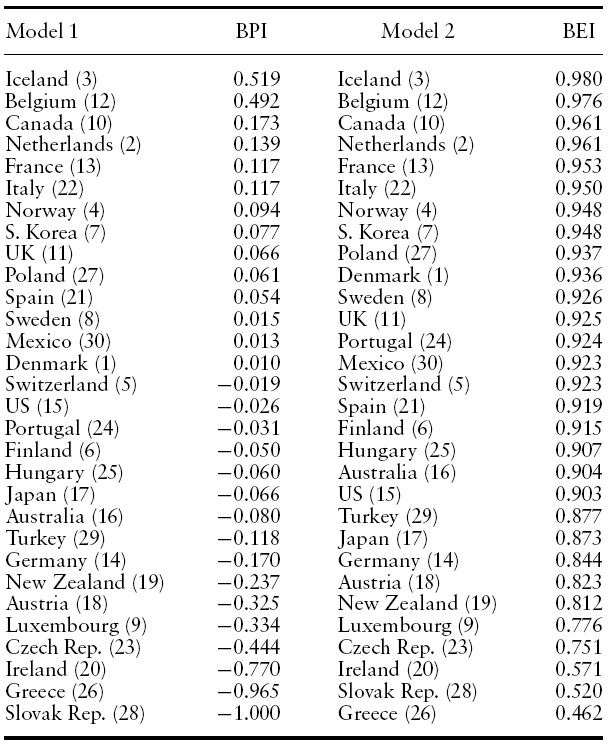
Broadband performance index and broadband efficiency index. (Rank of Raw subscription rate for December 2007 data in parenthesis)
4.1 Marginal Effects and Influence
Marginal effects for Model 1 are interpreted as those from an
For Model 1, the marginal effects are as follows. Excluding the time dummy variables, the largest effect is
Our measures of performance, the BPI and BEI, are provided in Table 2. The efficiency measures are averaged over the three periods of data for presentation, and the countries are sorted by relative performance. Despite the differences in the two measures and the estimation techniques used to create them, the outcomes are very similar. Iceland, Belgium, Canada, the Netherlands, and Italy are all placed high in the efficiency scores. Greece, the Slovak Republic, Ireland, the Czech Republic, and Luxembourg are found to be the least efficient.
For about two-thirds of the OECD countries, the BEI is 0.90 or better, indicating that most countries are performing reasonably well in terms of converting endowments into broadband subscription. As already mentioned, the endowments explain almost all of the variation in subscription (85%), so there is little room for inefficiency explanations.
Having a high ranking by the OECD in raw subscription does not mean that a country is doing a particularly good job. For example, Luxembourg is a veryweak performer on our efficiency index (BEI 0.776) given its subscription rank (9th).The poorest performers are unquestionably Greece (BEI 0.462), the Slovak Republic (BEI 0.520), Ireland (BEI 0.571), the CzechRepublic (BEI 0.751), and Luxembourg (BEI 0.776). This same set of countries is also labeled poor performers by the BPI. It seems these countries have the most to be concerned about regarding broadband subscription.
Note that efficiency is not always implied by a high rank. Surprises among the top performers are Belgium, France, Italy, Poland, and Portugal, since these countries are not the highest ranked in the OECD. Poland, ranked 27th in raw subscription, has an efficiency score of 0.937. Portugal, also arguably a poor performer with a raw subscription rank of 23rd, has an efficiency score of 0.924. Belgium is ranked 12th in the raw OECD data, but its efficiency score is 0.976, the second highest.
It is also interesting to observe that Japan (BEI 0.873), sometimes touted as a broadband policy ‘miracle’, is a middle-of-the-pack performer in the OECD according to both the BPI and BEI (Ebihara, 2007; Larson, 2006; Tuomi, 2004). South Korea (BEI 0.948), also described as a ‘miracle’, is a good performer. The US has a BEI of 0.903, so the country is not a broadband laggard as it is often described. In addition, the BEI reveals a significant difference betweenEUmember states, with some ranking near the top and others near the bottom. This indicates that while there is a common legal framework for telecoms policy in the EU, to date there is nothing close to common results. High-level policy (such as EU or US federal policy) may not be a key driver in broadband subscription.
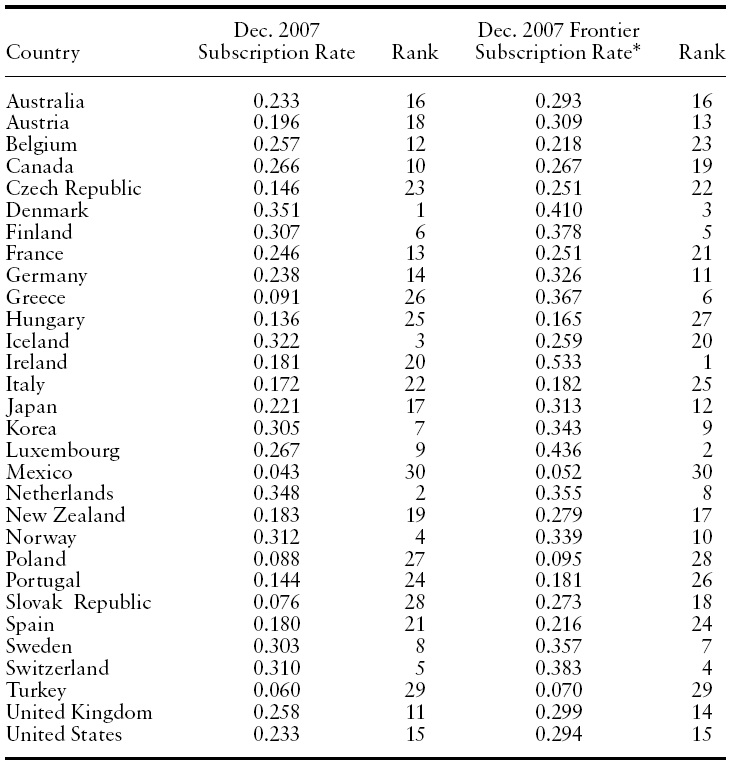
In Table 3, we provide the December 2007 subscription rates for the OECD countries in two forms. In the first column, the actual subscription rate as published by the OECD is provided, and the second column ranks these rates. These are the data commonly cited in discussions of relative performance across OECD countries with respect to broadband subscription.
In the third column of the table, the frontier subscription rate is listed. The frontier is computed by setting the measure of technical efficiency (the BEI) for all countries equal to 1.0 (i.e. adding the predicted value of the regression and the efficiency term). Remaining differences between the actual and frontier subscription rates are accounted for now only by the statistical noise normally included in the random disturbance term of a regression. Note that if the two-sided error term
[Table 3.] Actual and frontier subscription rates and ranks (December 2007)

Actual and frontier subscription rates and ranks (December 2007)
Table 3 demonstrates that the broadband ‘rankings’ of the frontier subscription rates are often not much different than those released by the OECD. The larger differences come primarily from the countries performing the worst, but even in those cases some of the ranks do not differ much (but some do). This means that even if all OECD countries were perfectly and equally efficient in converting endowments to broadband penetration there is very little effect on the ‘rankings’ for most countries.
The diffusion of broadband technology is perhaps the most significant telecoms policy challenge of the last 30 years. Policymakers need to have useful tools that help them formulate policies for broadband Internet services. Unfortunately, while countries are routinely ‘ranked’ by organizations such as the OECD on their broadband subscription rates, those postings and surrounding rhetoric have very little analytical foundation for showing that there are policy-relevant differences between countries that explain those rankings. Our analysis suggests that broadband adoption is intimately tied to demand-side factors, such as income inequality and education, and policies directed at those factors may be more cost effective than supply-side subsidies and regulation.While not particularly useful rhetorically, the fact is that demographics affect the rate of broadband adoption and those conditions cannot necessarily be affected directly or indirectly by communications policy.
The controlling roles of demographic and economic conditions need not imply that policymakers should be content with the current level of subscription or that broadband policy is irrelevant. Indeed, our results should encourage policymakers to focus their attention on policies that will cultivate or enhance the endowments that increase broadband adoption or that will counterbalance the adverse effects of endowments that suppress broadband adoption. For example, programs focused on overcoming the effect of income and income inequality might significantly spur broadband adoption. A public–private partnership in Kentucky – ConnectKentucky’s ‘No Child Left Offline’ program – is an example of such a program (Marshall, 2007).
As always, this analysis should be considered one part of the portfolio of evidence needed to drive public policy. Further research is warranted and encouraged.