Using a growth model of productivity catch-up estimated fromthe 1990 German reunification,we study the economic impacts of a hypothetical economic integration between South Korea and North Korea on macro aggregates. By considering a range of scenarios, we analyze the impacts of labor migration and capital transfer policies.
It is not much of a stretch to say that reunification of South Korea and North Korea is a remote possibility. Since the demise of the ‘Dear Leader’ Kim Jong-il, however, speculation about reunification has been reignited. Indeed, reunification between South Korea and North Korea could save millions of North Koreans from poverty. The projected GDP of a unified Korea could exceed those of France, Germany and possibly Japan in 30–40 years (see, for example, Kwon, 2009, for a related discussion). At the same time, it seems inevitable that reunification would slow the growth rate of South Korea for a decade or more. Numerous authors have estimated a number of projected costs for reunification (see, for example, Bae, 1996; Piazolo, 1997; Kwon, 2000; Noland
Unlike the previous literature, we take a novel approach, which is compatible with the applied general equilibrium tradition of macroeconomics. That is, we calibrate a growth model and systematically document possible economic impacts of an economic integration between South Korea and North Korea. In this paper, the term ‘economic integration’ implies a German-style reunification, but other types of integrations can also be studied with our model as long as they allow labor migration, capital transfers, or productivity catch-up between South Korea and North Korea.
We take, as a reasonable starting point, ideas of catch-up growth due to technology spillovers across countries (see, for example, Parente&Prescott, 1994; Lucas, 2009; Stokey, 2010) The basic tenet of catch-up growth is that a general study of growth must consider the cross-country flows of production-related knowledge from higher-productivity economies to lower-productivity ones. Although the flows of capital and labor still play a role, productivity catch-up can be a main factor for the convergence of incomes.
We provide a description of how North Korea’s TFP (total factor productivity) can catch up to South Korea’s TFP. The German reunification acts as a reference point to estimate the extent of the catch-up due to a rapid German-style reunification. Estimated measures of the convergence between Western Germany and Eastern Germany derived from Choi
For North Korea, labor migration and capital transfers can account for some of its increase in per-capita GDP following an economic integration, but the largest benefits result from the catch-up growth in its level of TFP. We also find that the largest loss to South Korea is likely to result from its productivity slowdown as experienced in Germany. Following reunification, Western Germany’s TFP appears to have shifted below its pre-reunification growth path, with the 2008 level of Western Germany’s TFP 15% below its predicted trend under the no integration scenario (Choi
We do not argue that Korea would experience the same path of economic integration as Germany did. First, the North Korean population is about half of South Korea’s while Eastern Germany’s was only a quarter ofWestern Germany’s. Second, North Korea’s initial underdevelopment is more severe than that of Eastern Germany. In 1990, per-capita GDP in Western Germany was $26,263 while the Eastern German per-capita GDPwas $7167 in 1990 price level, according to Maddison (2008); a ratio of 3.7 to 1. In 2008, the most recent year of data, the South Korean per-capita GDP was $27,565 while the North Korean per-capita GDP was $1576; a ratio of over 17 to 1. Likewise, infrastructure – including railways, roads, and waterways – might be relatively more underdeveloped in North Korea than they were in Eastern Germany.
Hence, we also develop a range of optimistic and pessimistic scenarios relative to the baseline scenario (i.e. the German-style reunification) by conducting sensitivity analysis. In the optimistic (pessimistic) scenario, the economic integration occurs with relatively large (small) gains for North Korea’s per-capita GDP and small (large) losses for South Korea’s per-capita GDP. To be specific, our findings include the following. First, both South Korea and North Korea benefit from a policy that can minimize the TFP slowdown in South Korea. Second, the combined GDP after economic integration is likely to exceed the sum of the South Korean and North Korean GDPs under the no-integration case for a broad range of parameter assumptions; although the evolution of combined GDP depends on those assumptions. Third, the South Korean per-capita GDP improves as the migration rate from North Korea to South Korea slows while the combined GDP of South Korea and North Korea decreases. Similarly, the South Korean per-capita GDP improves as the capital transfer from South Korea to North Korea slows while it is not clearly conclusive to see whether the combined GDP increases or decreases.
This paper is organized as follows. Section 2 describes the framework. Section 3 provides the main analysis. Section 4 concludes.
The framework that we use in this paper is identical to Choi,
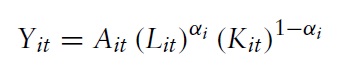
for all
where
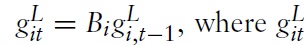
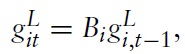
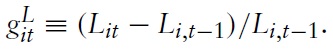
Population growth is exogenous. In particular,

where

is the year-

and

where 0 <
The dataset is the same as in Choi

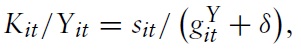
which is obtained assuming a balanced growth path, where
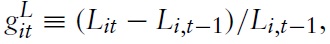
Based on the dataset for population,we obtain the ‘natural’ population growth by

where

is the year-
The South Korean population following the economic integration is calculated as its natural rate plus migrating workers from North Korea. The North Korean population following the integration is calculated as its natural rate minus those that left in search of higher wages (or different living standards).
Observations on TFP are obtained as:
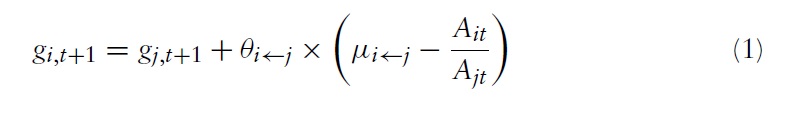
The calibration of catch-up growth from the German reunification provides
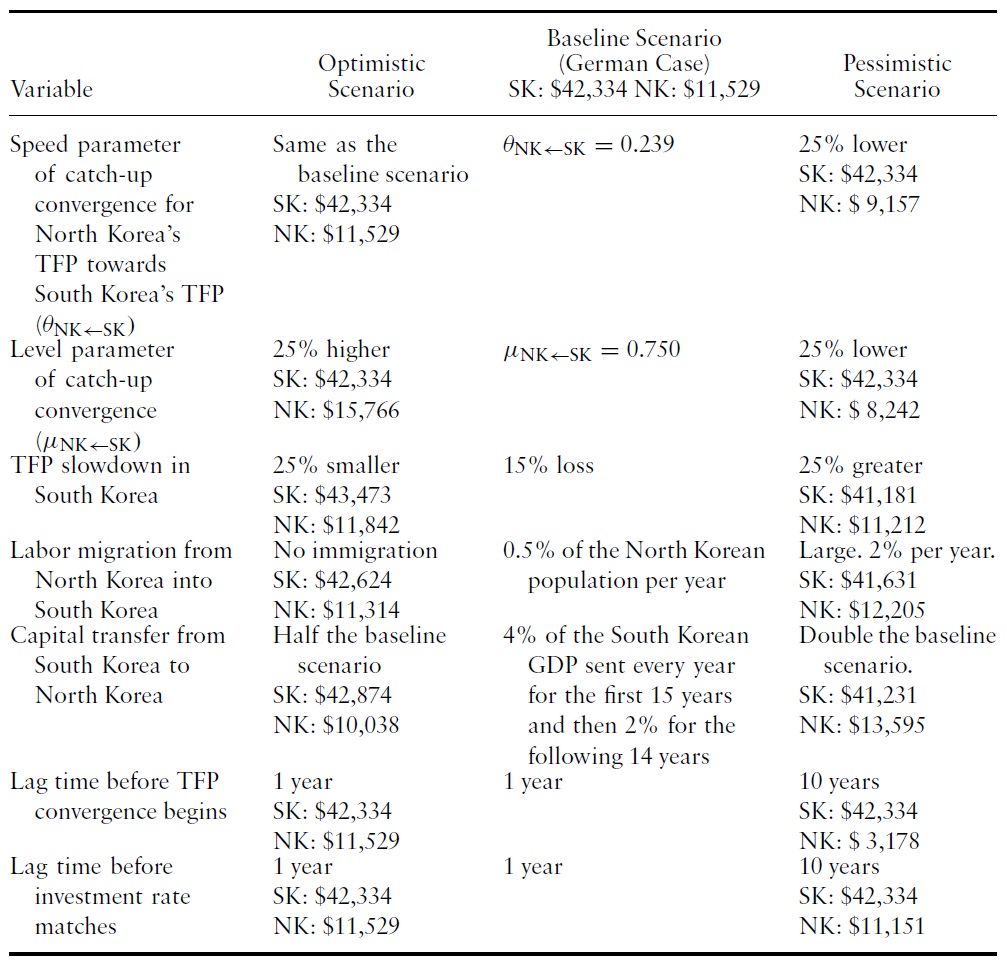
Labor migration from North Korea to South Korea is 0.5% of the North Korean population per year until wage rates in South Korea and North Korea are equated. The GDP transfers from South Korea to North Korea are 4% of the South Korean GDP for the first 15 years and 2% for the following 14 years. The reunification in Germany implies that North Korea’s TFP catch-up towards South Korean TFP is required to start immediately after the economic integration.The German-style integration also requires that North Korea’s investment rate should synchronize with South Korea’s investment rate immediately after the integration. We choose 2015 as the year of economic integration. Table 1 summarizes the sources of our assumptions.
[Table 1.] Baseline parameter assumptions
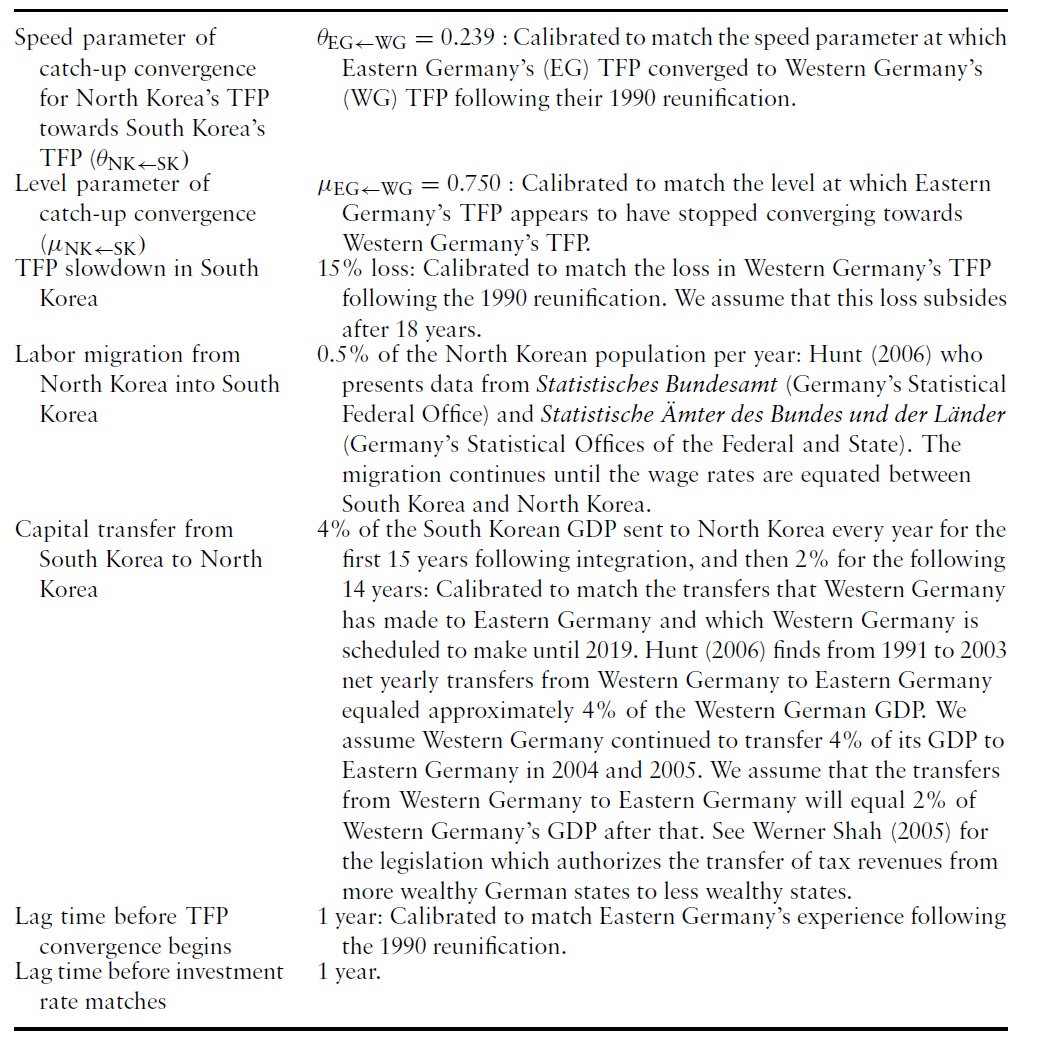
Baseline parameter assumptions
3. Impacts of the Economic Integration
Table 2 presents the forecasts of a hypothetical 2015 economic integration on the per-capita GDPs of South Korea and North Korea. Under the baseline parameterization, mimicking Germany’s reunification experience, the North Korean per-capita GDP after 10 years (in year 2025) would amount to $11,529, while the no-integration case would end up with $1295. This result indicates that the hypothetical economic integration provides an eight-fold increase in the North Korean per capita GDP in 10 years. For South Korea, per-capita GDP is projected to be $42,334, which falls short of its no-integration counterpart of $48,801.
[Table 2.] Projected impacts of a 2015 economic integration on per-capita GDPs in 2025 (in 2008$)

Projected impacts of a 2015 economic integration on per-capita GDPs in 2025 (in 2008$)
Qualitatively, the South Korean per-capita GDP tends to increase as (i) the TFP slowdown in South Korea is smaller; (ii) labor migrations from North Korea to South Korea are smaller; and (iii) capital transfers from South Korea to North Korea are smaller. If any policy objective is solely to minimize the negative impact of the economic integration on the South Korean per-capita GDP, these three dimensions should be a priority. Furthermore, the North Korean per-capita GDP tends to increase as (i)
The first row of Table 2 analyzes the sensitivity along the dimension of the speed parameter of catch-up growth,
The assumptions on the rates of labor migration and capital transfer affect the per-capita GDPs of South Korea and North Korea, but the results are similar to the baseline scenario. As labor migration varies from none (optimistic) to 2% of the North Korean population per year (pessimistic), the South Korean percapita GDP varies from $42,624 (optimistic) to $41,631 (pessimistic). In addition, as yearly capital transfers change from 2% (optimistic) to 8% (pessimistic) of the South Korean GDP, the South Korean per-capita GDP ranges from $42,874 (optimistic) to $41,231 (pessimistic). The North Korean per-capita GDP is also slightly affected.
The lag times before the TFP convergence starts and before investment rates match affect the North Korean per-capita GDP. As the lag time increases to 10 years, the North Korean per-capita GDP falls from $11,529 (baseline) to as low as $3171.This reflects that if it takes time for North Korea to develop the prerequisite infrastructure before it can start adopting useful ideas from South Korea, an economic integration will be a less immediate success for North Korea.
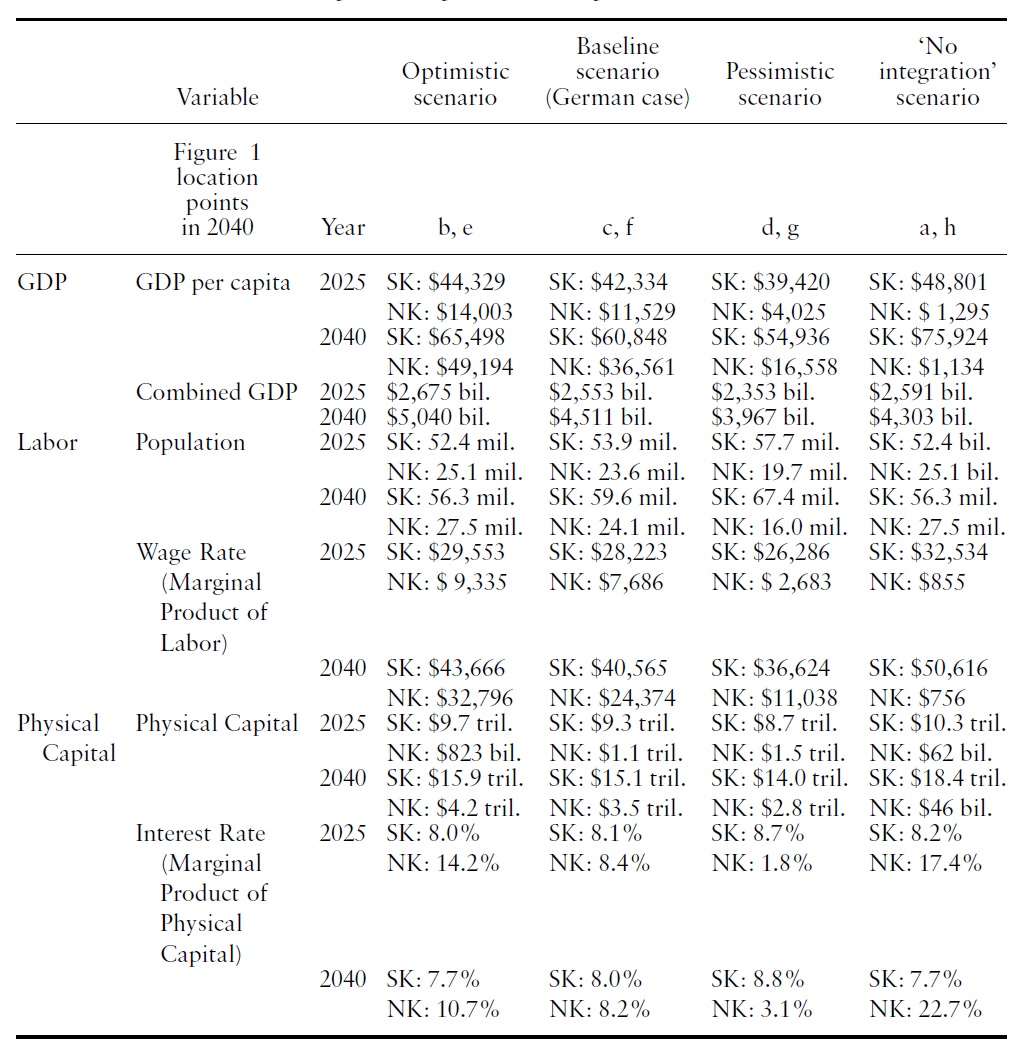
Table 3 presents the results on GDP, TFPs, wage rates, and interest rates under three scenarios, which are the baseline case, the optimistic scenario and the pessimistic scenario. The optimistic [pessimistic] scenario here is a combination of all optimistic [pessimistic] cases for all assumptions in Table 2. In the optimistic scenario, the 2025 North Korean per-capita GDP increases to $14,003 compared with $1295 in the no-integration case. In the pessimistic scenario, the North Korean per capita GDP is projected to be $4025 in 2025. In addition, the South Korean per capita GDP in 2025 falls to about 19% below its no-integration level of $48,801.
[Table 3.] Combined impacts of ‘optimistic’ and ‘pessimistic’ scenarios in Table 2

Combined impacts of ‘optimistic’ and ‘pessimistic’ scenarios in Table 2
By 2040, both the baseline case and the optimistic scenario predict that the combined GDP will be projected to exceed the sum of South Korean and North Korean GDPs under the no-integration scenario. However, the combined GDP falls short of its no-integration counterpart by over $200 million under pessimistic parameters, although the former will eventually exceed the latter in a later year.
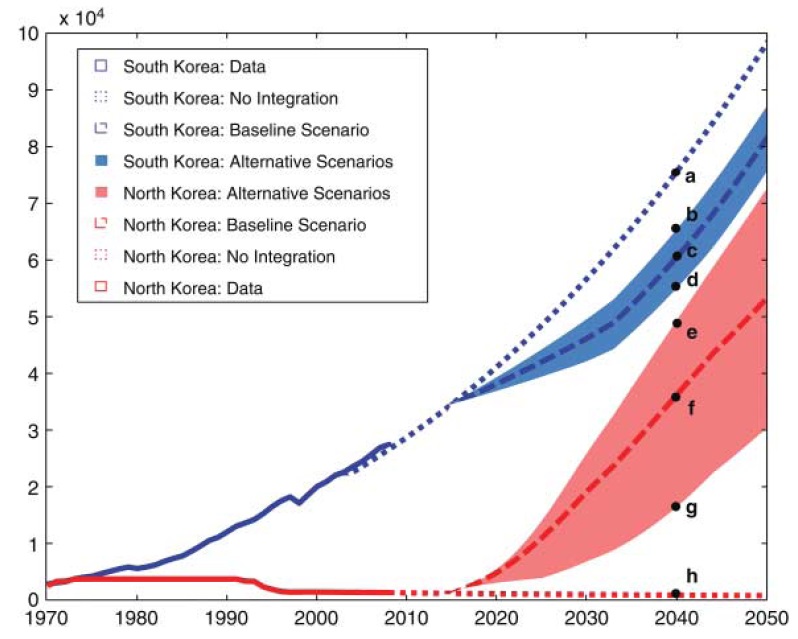
Figure 1 illustrates Table 3’s findings on per-capita GDPs. Points a through h are matched with the results as indicated in the second row of Table 3.
3.1 Combined GDP of South Korea and North Korea
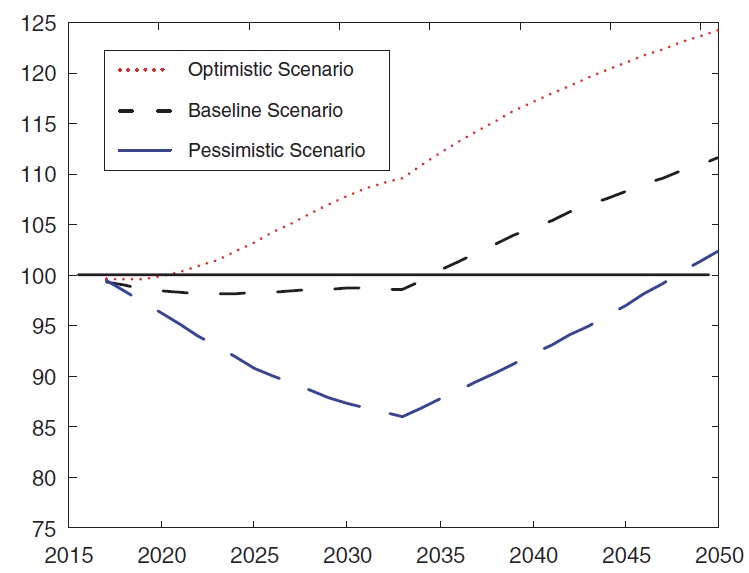
An important question is, when do the gains to North Korea outweigh the losses to South Korea? We consider the combined GDP of South Korea and North Korea. In Figure 2, the ‘No Integration’ case is normalized to 100 in each year. For the baseline case, the combined GDP would exceed the sum of the no integration scenario GDPs of South Korea and North Korea in 20 years after the integration. In the optimistic scenario, the combined GDP would exceed the no integration case in six years. The combined GDP in the pessimistic scenario would exceed the sum of the GDPs in the no-integration scenario in 2048. These results imply that although the combined GDP will eventually exceed the sum of the South Korean and North Korean GDPs under the no-integration case, the evolution of GDP depends heavily on the assumptions about the economic integration.
3.2 ‘Hong Kong?China’ Style Integration: Restrictions on Immigration
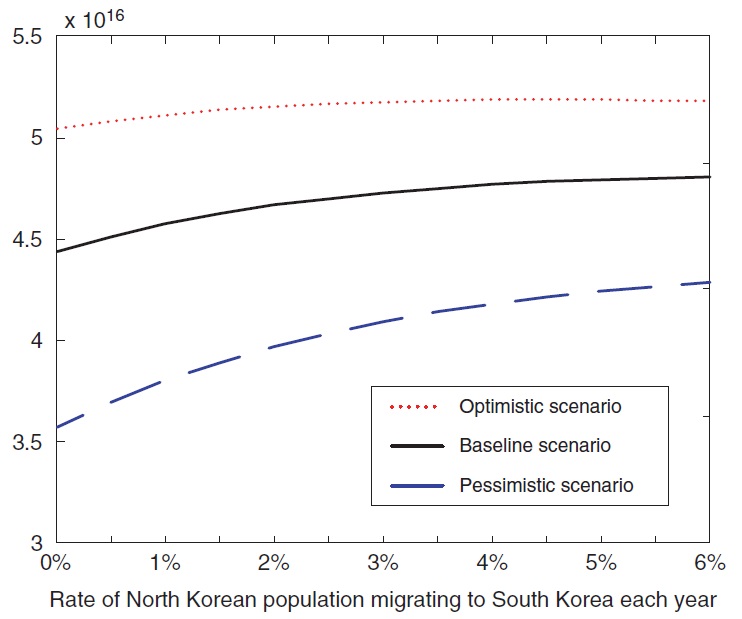
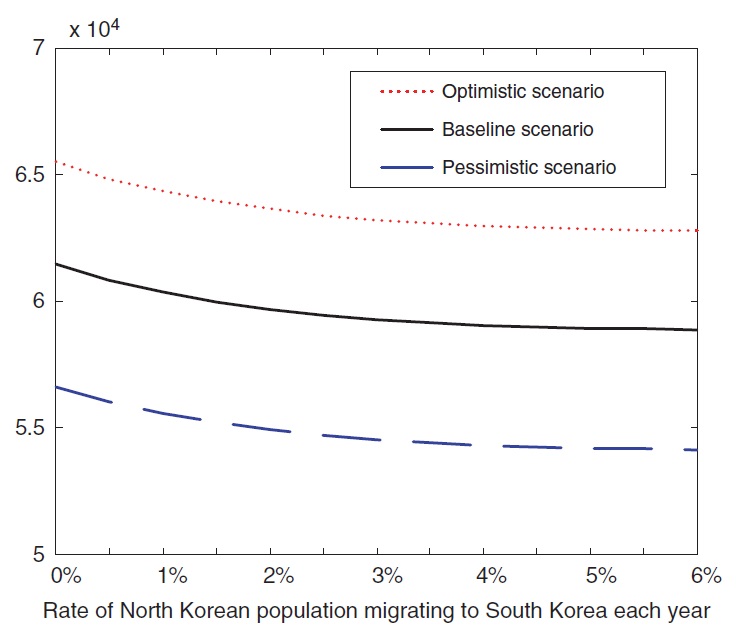
In the baseline scenario, 0.5% of North Korean citizens are assumed to migrate southward each year.
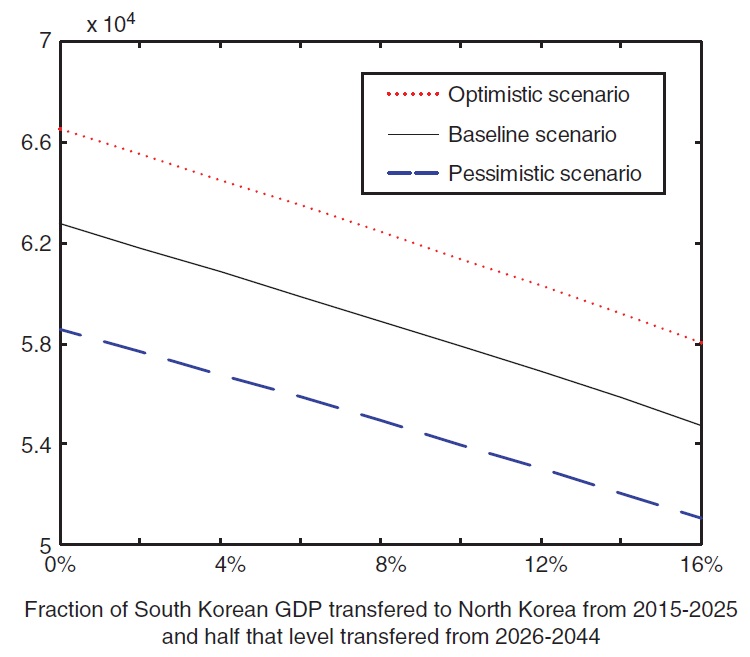
Figures 3 and 4 illustrate how the rate of migration can affect the South Korean per-capita GDP and the combined GDP in 2040. In Figure 3, the South Korean per-capita GDP improves as the migration slows. In Figure 4, the combined GDP decreases as the migration slows. Hence, the policy regarding labor migration affects the income level of South Korea and the size of the combined economies differently.
We study how sensitive the forecasts are to the parameter of South Korea’s capital transfers to North Korea. This question can be relevant to policy makers, in particular, because a large portion of the capital transfers would be supported from public sources.
Table 4 displays per-capita GDP forecasts for various assumptions on capital transfers from South Korea to North Korea. In the baseline scenario, transfers to GDP ratios are now equal to 4% for the years from 2026–44, instead of 2%. The higher transfers-to-GDP ratios cause the South Korean per-capita GDP to decrease from $60,848 to 60,107 in 2040, resulting in slightly more than a 1% decrease. In contrast, the per-capita GDP in North Korea would increase from $36,561 to $38,325, accounting for a 5% increase.
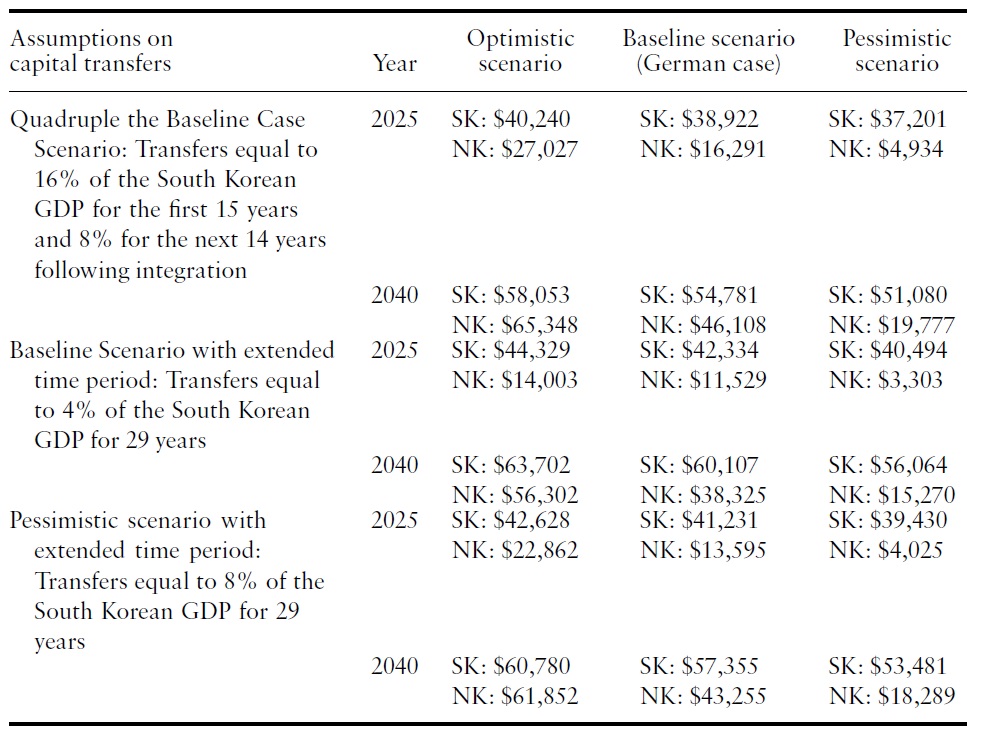
Per-capita GDPs in 2025 and 2040 based on additional scenarios of capital transfers from South Korea to North Korea
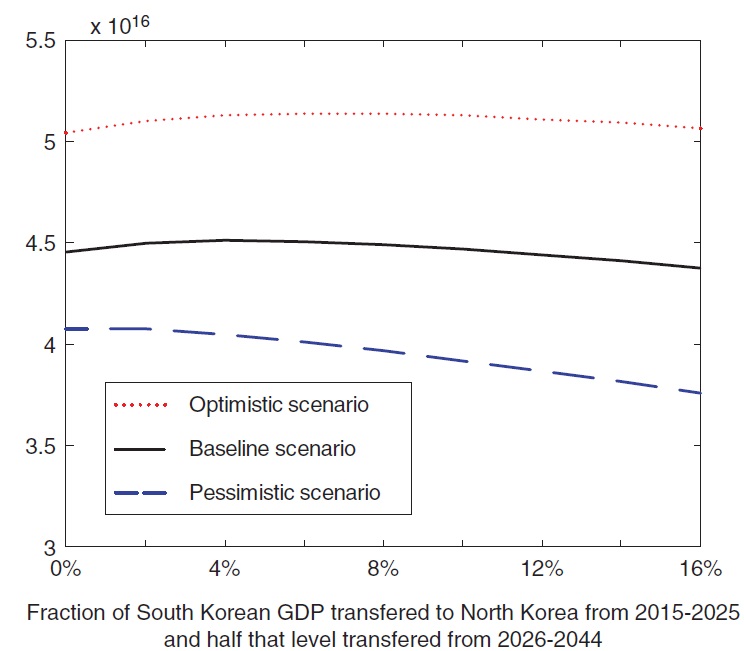
Figures 5 and 6 illustrate how the transfers-to-GDP ratio can affect the South Korean per-capita GDP and combined GDP in 2040. Figure 5 suggests that the South Korean per-capita GDP improves as the capital transfer slows. On the other hand, Figure 6 suggests that it is not clearly conclusive to see whether the combined GDP increases or decreases.
A large capital transfer to North Korea can be further financed by an increase in the investment rate in South Korea. In addition, private investments from South Korea to North Korea can be encouraged if North Korean institutions on private properties, banking and financial systems become fully established. The studies onwhy physical capital does not flowfromhigh-income to low-income economies in general, as in Lucas (1990), can be further applied to understand how physical capital would flow after the economic integration.
We used a macroeconomic model of catch-up growth to measure model-implied estimates of economic impacts of the German reunification in 1990. By applying those estimates to a possible economic integration between South Korea and North Korea, we provided potential economic impacts in terms of macro aggregates such as GDPs, productivities, labor and capital stocks, andwage and interest rates in both South Korea and North Korea.We further evaluated the risks regarding the economic integration that critically hinge upon policy options for labor migration and capital transfers.
The economic impacts of the economic integration consist of three components. First, while North Korea is likely to gain due to its productivity catch-up to South Korea, South Korea’s per-capita GDP is likely to suffer from an immediate loss in TFP as Western Germany experienced. As discussed, this arises due to fewer resources left for South Korea during the transition period, uncertainties immediately after the economic integration, potential changes to the average human capital stock in South Korea, and higher levels of taxation and potential accompanying inefficiencies. We documented that a policy that can minimize the TFP slowdown in South Korea is beneficial to both South Korea and North Korea. A future study about why Western Germany experienced a TFP slowdown is important. Second, labor will migrate from North Korea to South Korea. Our result implies that a restriction in the immigration, such as China–Hong Kong style integration, may increase the South Korean per-capita GDP but decrease the combined GDP of South Korea and North Korea. Third, capital will flow from South Korea to North Korea. A policy that increases the investment rate in general can help both South Korea and North Korea to facilitate the economic integration. An establishment of North Korean institutions on private properties, banking and financial systems is important to encourage South Korean investment in North Korea. More limited capital transfers can be considered if the policy goal is to lessen the South Korean burden, although it is not clearly conclusive to see whether the combined GDP of South Korea and North Korea will increase or decrease.
This paper assumes that the production function is identical across economies. While our interpretation that North Korea may lack the accumulated capital is still reasonable, it would be interesting to consider the relationship between factor income shares and outputs. Cociuba (2012) can be a starting point for this study.