The disintegration of the USSR brought with it a turbulent period of transition for the newly emerged independent states. This initiated a process of economic decentralisation and a re-allocation of resources. Various regional formations aiming to create a single market or even a common currency area have been proposed amongst the former Soviet states. Despite this, very little in terms of economic integration has been achieved so far. Economies within the CIS are divergent in terms of size and economic structure, with external shocks being more prominent for regional countries. The empirical analysis provided here examines the sustainability of optimum currency area arrangements within the CIS.The results present weak evidence to support monetary arrangements in the region, nonetheless some evidence was found for Russia-Belarus and to some extent Russia-Kazakhstan. Russia remains the dominant, most diversified and advanced economy in the region. In the case of a monetary union with regional countries, the union is likely to happen by absorption. External shocks have divergent effects on regional countries; the differences to a large extent are attributed to the magnitude of responses, further weakening the argument in favour of the OCA in the region.
Following the collapse of the Soviet Union and the dissolution of theWarsawPact, much effort has been invested into the issue of how to fill the gap emerging from the collapse of inter-republic economic ties and the failure of the Soviet payment system (Schoors, 2003). The Commonwealth of Independent States (CIS) was formed to serve as a means of ‘. . . civilised divorce’1 and cannot be perceived as either a substitute or a foundation for any quasi-union between the former Soviet republics. With the exception of the three Baltic States – Latvia, Lithuania and Estonia (who joined the EU in 2004) – the CIS includes all the former republics of the Soviet Union2 that agreed to join the organisation on 21 December 1991. For the newly independent states, political independence brought with it new challenges in economic areas. Countries were left with a legacy of the Soviet economic structure where member republics’ economies were linked with each other through complementarity relationships. The latter made them more dependent on each other and at the same time less diversified in terms of industrial production and trade. Decades of common economic structure created a system where peripheral economies were heavily dependent on Russia. For all newly independent states, as highlighted later in this paper, Russia still remains a major trading partner. It is therefore uneasy to neglect the legacy inherited from the past, and the building of regional economic arrangements seems to be the way forward. In addition, the 2008 meltdown of the world financial system has revived the debate about regional monetary arrangements.3
The purpose of this paper is thus to analyse the conditions for the possible formation of a monetary union in the post-Soviet economies. This work contributes to, and expands on, previous studies dealing with inter-regional and inter-republic integration in Russia and the former Soviet States (e.g. Chaplygin
Despite a significant body of research on issues such as trade integration within the CIS (Bludova, 2005; Freinkman
Recent attempts of economic integration between various CIS countries have, however, remained out of the scope of academic research. In instances where studies have, contributed to the literature on integration in the CIS, the Eurasian Economic Community (EEC), the Common Economic Space (CES), the union of Russia and Belarus and former Soviet republics in general, the focus has concerned itself with a qualitative comparison between the major macroeconomic indicators and trade flows within the region (Klotsvog, 1998; Gulde
The remainder of the paper is organised as follows: section 2 provides an overviewof the CIS economies and it summarises the current integration arrangements within the region. Section 3 briefly summarises the methodology of structural VAR employed in this paper to extract structural shocks. Section 4 presents the empirical results and proposes an analysis. Section 5 concludes.
1As stated by the Russian President during the CIS meeting in Kazan (Russia) on 26 August 2005. 2With the exception of Georgia, who joined the organisation in 1993. Turkmenistan has ceased its permanent membership within the CIS and became an associated member of the organisation during the Kazan Summit in August 2005. As of January 2008, the CIS comprises 12 countries, as shown in Table 2 (except for Estonia, Latvia and Lithuania). 3In particular, the post 1997 idea of an Asian Monetary Fund is currently being reconsidered. 4By utilising the structuralVARmethodology, developed by Blanchard and Quah (1989) and further accommodated to the cases of OCAs by Bayoumi and Eichengreen (1994).
2. CIS: Empirical Application of the OCA criteria: The Case of the CIS
Following the dissolution of the USSR, a number of collaborative initiatives (besides the CIS) aimed at increasing regional cooperation came to fruition. A summary of these is provided in Table 1.
As presented in Table 1, the major platform for the former USSR republics to continue their dialogue with their partners has been the Commonwealth of Independent States. This forum, however, has been rather futile in pursuing further economic and/or political integration within the member states. For example, the creation of a free trade area within the CIS, initially thought to be a contributory factor towards deeper integration between the former Soviet States, has remained ineffective. In fact, the CIS FreeTrade Agreement of 1994 has not been fully implemented by all members and it is seen as a loose agreement. Gleason (2001) argued that the CIS had only a modest success in promoting and strengthening cooperation among the former Soviet republics. More specifically, he outlined that the main contribution of the CIS was the creation of a platform where bilateral and regional arrangements could be negotiated.
[Table 1.] Regional cooperation initiatives in CIS
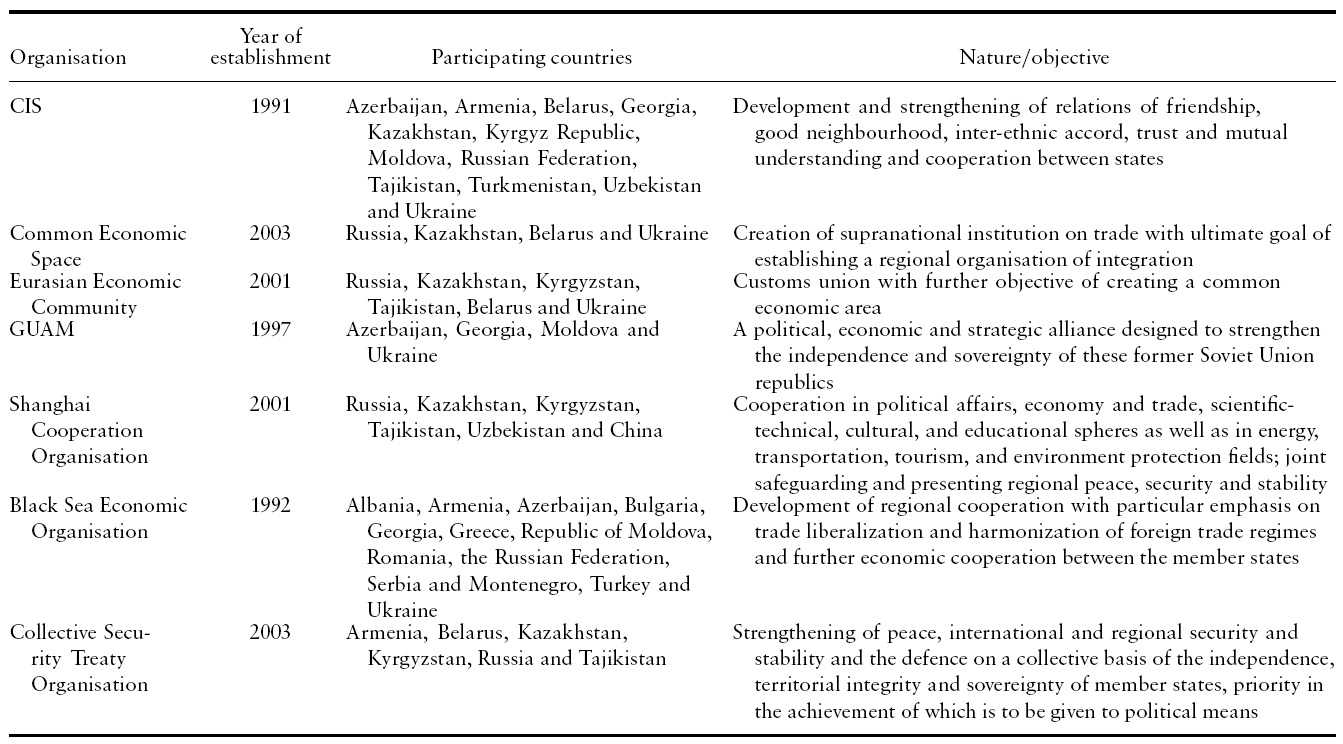
Regional cooperation initiatives in CIS
With little progress towards further economic integration, some of the countries have initiated a number of separate formations involving groups of countries with similar interests (Table 1). The Eurasian Economic Community and Common Economic Space are the two examples of economic integration arrangements backed by Russia. It should be acknowledged however that some of the objectives of the two agreements seem to overlap (e.g. the creation of a tariff-free common economic area). At this stage it is unclear as to how the possible conflict of interests for the countries participating in both arrangements is going to be resolved (Tumbarello, 2005).
According to the data on FTAs in the CIS obtained from Freinkman
Although, as argued by Freinkman
In light of the information presented in Table 1, it is important to evaluate the economic aspects of further economic integration amongst former Soviet States. In this sense, the OCA theory presents a suitable framework for the analysis. The theory of OCA has been empirically tested on various geographical areas. For example, Ling (2001) applied the structural VAR approach to test for shock correlation in 12 East Asian countries during the period of 1967–1997, and found that (based on shock symmetry and geographic proximity) three sub-groupings in East Asia can be considered for potential monetary integration. A structural VAR methodology, covering the period of 1963–1997, was also applied by Fielding and Shields (2001) to the CFAzone to model macroeconomic shocks in the Franc zone. In Europe, Kempa (2002) employed a structural VAR approach (SVAR) to test for demand, supply and monetary shocks and found significant evidence to support convergence within Europe as an optimum currency area. Kempa’s findings were based on results obtained from two time periods 1976Q1–1986Q4 and 1987Q1–1997Q4. Frankel and Rose (2002) quantified the effect of currency unions in terms of their effect on trade and income by estimating a gravity model incorporating 200 countries. The results obtained from their study indicate a significant positive effect of currency unions on trade intensity. Similar to the results obtained by Rose (2001), Frankel and Rose (2002) found that the currency union triples the trade between the union partners.
On the other hand, a relative void is evident in the literature when it comes to dealing with the issue of integration in the post-Soviet republics. Hamilton (2005), for example, dealt with the issue ofRussia and EU integration but fromthe perspective of the enlargement effect of the EU on trade with Russia and Russia’s eventual WTO accession. The issue of trade intensity under the umbrella of WTO for Russia is also analysed by Kukharchuk and Maurel (2004) who employed a gravity equation to test for the trade potential between the CIS and the EU. Their results indicate significant benefits for Russia resulting from a potential increase in trade due to the adoption of WTO standards.
The current paper significantly differs from previous works in this area in the following key ways. First, our work incorporates the fact that since the CIS economies differ in terms of size and specialisation, we consider the notion of an external shock and its impact on the domestic economy. For example, the impact of an external shock (e.g. due to rising oil prices) would have a varying effects across the CIS countries. Russia and Kazakhstan, for example, are major commodity exporters, whereas Ukraine is an economy with a heavy industrial and agrarian sector. In the Chaplygin
Prior to formulating our OCA model and examining the outcome, we present below a short overview of the domestic economies. We briefly discuss the economic structure of the regional countries through qualitative assessments. This is then followed by an empirical analysis of the OCA in the region.
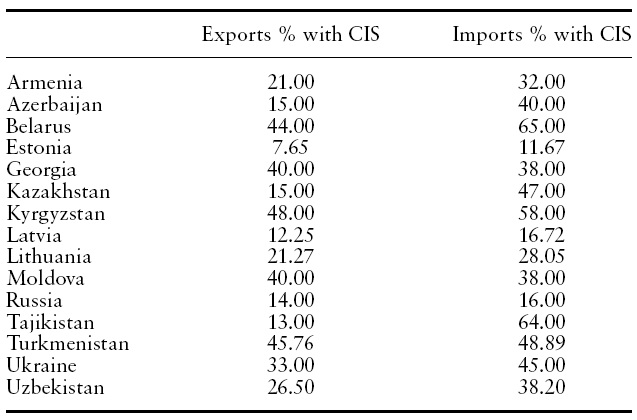
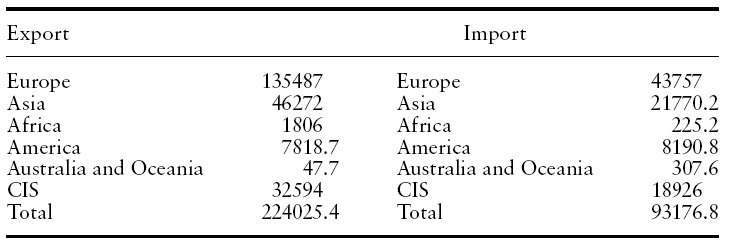
Tables 2(a) and 2(b) provide an overall portrait on the importance of trade links within the CIS region. According to the data portrayed in Table 2(a), intra CIS trade constitutes more than 40% of the total exports from Belarus, Georgia and Moldova, with the largest portion of exports coming from these three countries directed to Russia. On the other hand, Russia’s exports to the former USSR countries are negligible (accounting for less than 14% in 2004). According to Table 2(b), Russia’s share of intra-CIS exports in 2005 was small, with exports to Europe accounting for more than half of the total exports of the country.
[Table 2.] (a) Trade data for the CIS and Baltic States, 2004

(a) Trade data for the CIS and Baltic States, 2004
[Table 2.] (b) Trade statistics of the Russian Federation (2005, mln USD)

(b) Trade statistics of the Russian Federation (2005, mln USD)
Russia’s major export is natural gas and crude oil, with proven reserves of 60 billion barrels and 1680 trillion cubic feet respectively.5 Within this group, Russia is the most diversified and developed economy and hence naturally would represent the core of any OCA arrangements in the region.
Onthecumulative import side, intra-CIS imports are particularly important for Belarus,Kyrgyzstan,Tajikistan and Ukraine as more than 50% of these countries’ total imports come from the CIS area.
Table 3 presents essential macroeconomic statistics for the CIS and Baltic countries including openness indicators and per capita trade. The information in Table 3 should provide some information on the similarity/difference of the regional economies. Regional countries visibly differ in terms of main economic indicators such as GDP growth, inflation and per capita income. The Baltic States and Russia significantly outweigh the rest of the countries (e.g. Central Asian republics) on these parameters. There is also a substantial disparity in terms of economic freedom indicators compiled by the Heritage Foundation. On the openness side, Belarus occupies the top position among the other CIS countries. Similar results for Belarus were obtained in Bogdanovich (2005), where the openness of CIS economies was calculated as a ratio of total exports to GDP. On the other hand, the largest economy in the region – Russia – is placed as the least open economy, a result that is in line with the results of other large countries (Alesina & Wacziarg, 1998). In order to account for the impact of country size, we estimate a trade per capita indicator for the countries under investigation. Based on this indicator, the Baltic States occupied the top three positions, followed by Belarus (in terms of being the most export-oriented domestic economy).6
This overview of macroeconomic fundamentals and trade flows underscores the divergent nature of the regional economies. In summary, we find that Russia is the largest and most diversified economy,whereas the economies of the remaining countries are much smaller in size, with core specialisation in selected industrial or agrarian sectors. Based on this initial starting point, any OCA arrangements are likely to have a more profound cost impact on smaller regional economies than on Russia.
[Table 3.] Macroeconomic statistics for the CIS and Baltic countries
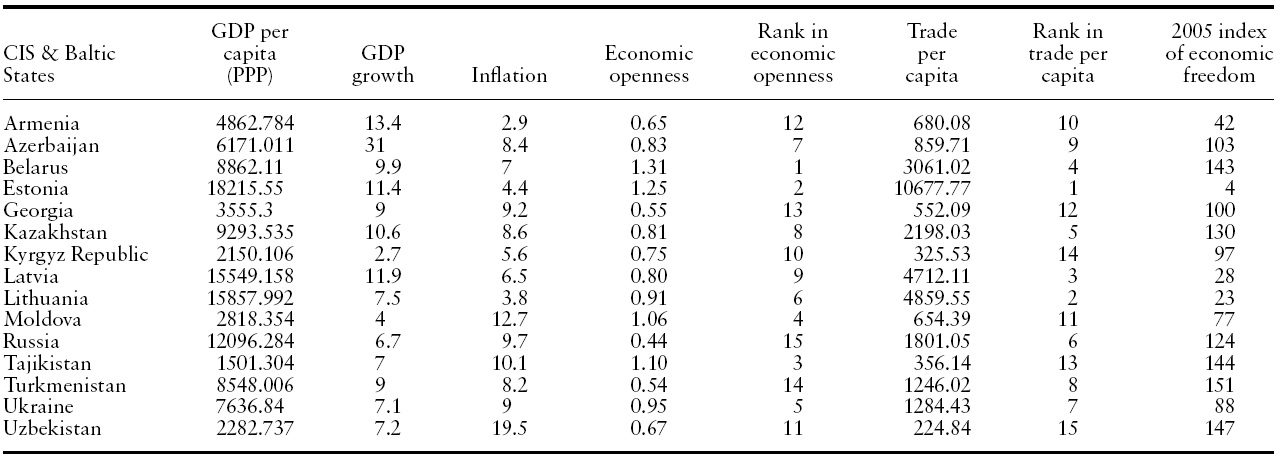
Macroeconomic statistics for the CIS and Baltic countries
5Energy Information Administration (2005). According to the Federal State Statistics Service in August 2005, Russia was producing approximately 9,398,000 of barrels per day. For comparison purposes, it is interesting to note that Saudi Arabia (the world’s largest oil producer) was producing 9,520,000 barrels per day over the same time period. The World Bank Report on the Russian economy has suggested that export revenues from oil account for nearly 20% of the country’s GDP (World Bank, 2005). In addition, the official energy statistics of the US government have indicated that in the case of Russia, a $1 per barrel change in price of crude oil causes approximately a $1.4 billion increase in Russia’s revenues (Energy Information Administration, 2005). 6According to the data provided in Bogdanovich (2005), the major exports of Belarus are agricultural machinery and potassium fertilizers. Itwas also estimated that, as of 2003, the Belarus Metallurgical Plant held 7% of the world production in metal cord (Bogdanovich, 2005).
3. Methodology, Data and Study Limitations
The methodology used in this paper to recover demand and supply shocks by using the structural VAR is borrowed from Blanchard and Quah (1989), which was further extended by Bayoumi and Eichengreen (1994). The bivariate SVAR methodology which is used to extract structural shocks (demand and supply) is extended further in our work so as to incorporate an external (global) shock. The notion of external shock is used to examine the effect ofmovements in global business cycles, which are assumed to be exogenous to the domestic economies of the CIS.The model specified in the current paper bears some similarity to theworks of Ng(2002) onASEAN, Diboglu and Horvath (2001) on Europe and Chowand Kim (2003) on East Asia. However, the model specified here provides an alternative to traditional bivariate SVARs and multivariate models that were estimated in other studies (e.g. Chaplygin
3.1 Application of SVAR to the Case of an OCA
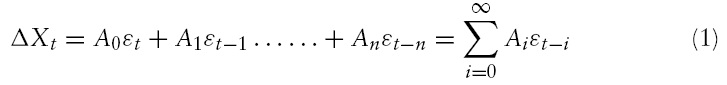
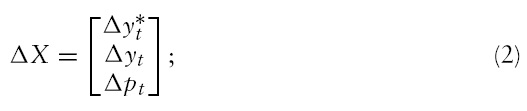
Our study is based on quarterly seasonally adjusted data and covers the time period of 1995Q1–2005Q4. The data were obtained from DataStream, the IMF World Economic Indicators Database and domestic statistical offices where necessary. The estimated econometric model is presented as follows:

where,
and,
The three variables in
By first expressing equation (1) in matrix form and by transforming it into a compact form yields:

This can be further expressed as an infinite moving average with contemporaneously correlated error terms

Assuming that the relationship between

Equation (6) with

where, A(1) in equation (7) denotes lower triangular Choleski decomposition of
The vector
The final restriction imposed on the model assumes that a domestic supply shock has no long run impact on global output
The restrictions are in line with the theory, where the long-run supply curve is a vertical line. They lend support to previous empirical evidence (Ng, 2002) and are sufficient to recover the estimates of
In the long run, however, the aggregate supply curve is vertical as it is assumed that the long run supply function is determined by factors other than price, such as labour, land, capital and technological advance. Thus, as an increase in the price level would not have an effect on supply in the long run, real production would remain unchanged (constant) at a full employment level. Based on this theoretical framework, a positive demand shock leads to an increase in the price level and output, leaving no permanent effect on the output. In the short run, a one unit demand shock shifts the aggregate demand curve to the right, which leads to a rise in inflation and output. However, the effect of the demand shock dissipates over time as wages gradually adjust to this increase, which in turn causes a shift in the short term supply curve to the left, resulting in a new equilibrium position where the output level reverts back to its original position.
[Table 4.] ADF unit root test results

ADF unit root test results
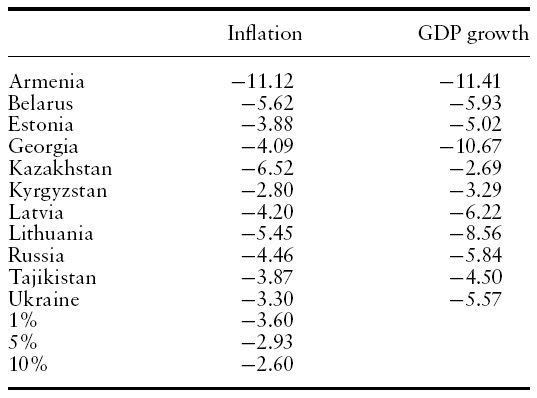
[Table 5.] Panel unit root test results

Panel unit root test results
The causality effect of a supply shock can similarly be explained by movements in the demand and supply curves. Thus, a positive supply shock shifts the short run supply curve to the right, which causes a drop in price levels and an increase in output. In the long run, following the adjustment in wages to the initial supply shock, the overall effect of the supply shock leaves a permanent positive and negative effect on the output and price level respectively.
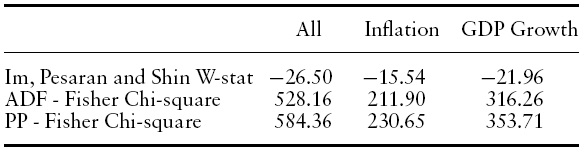
The VAR models were estimated with a lag of two, which was based on AIC/SBC.7 The null hypothesis of stationarity under the ADF specification was rejected for all cases at the 5% level (Table 4). However, in some cases, the results obtained from the ADF rejected the null of non-stationarity at the 10% level. In order to substantiate our results with regard to stationarity, we employed a number of panel unit root tests, which were used in order to increase the test power in short samples (Maddala&Kim, 2003). In this paper, we considered panel unit root tests with H0:I(1) and the null hypothesis of non-stationarity was rejected at the 1% level for all groups – Inflation, GDP Growth and all samples (Table 5).
7The test with the lag of one was found to have no significant impact on the results.
Before examining the correlation of demand and supply shocks in the newly independent CIS, we first consider the correlation of both GDP growth and inflation in the CIS countries.
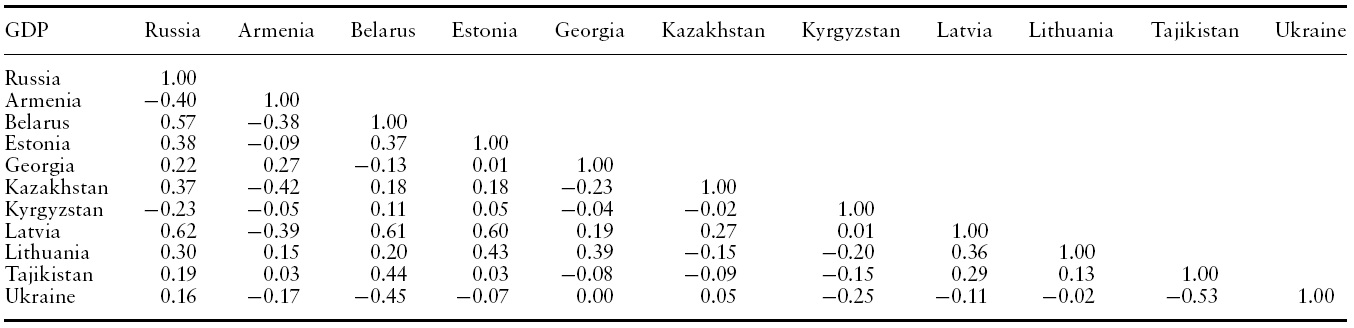
As highlighted in Table 6, the correlation coefficients of output growth for the Eurasian Economic Community are positive and high in the case of all member countries. While the output growth correlation between Russia and Belarus, as well as that between Russia and Latvia, is strong and positive, the correlation of the real GDP growth rates between most of the other CIS countries is weak or negative. The Baltic States experience positive correlation in output growth rates between each other. This is also the case for the output growths in the Baltic States.
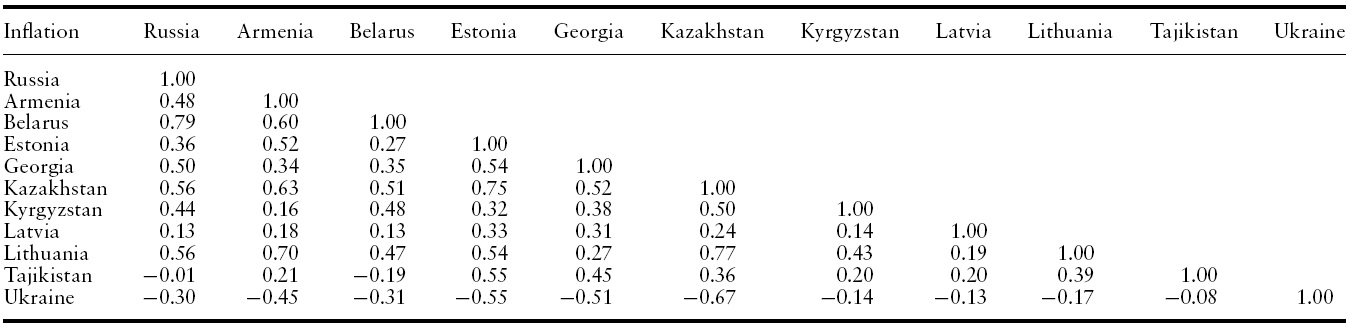
On the other hand (Table 7), the correlation in inflation rates provides significant evidence to suggest the presence of a substantial positive co-movement within the CIS and, in particular, the Eurasian EconomicCommunity or the Common Economic Space.Apositive and high correlation in inflation rates is observed in the case of Russia and Belarus (0.79). This result could partially be explained by the two countries’ efforts to create a union state with a single monetary policy. Such symmetry might also indicate that selected CIS countries have been following similar monetary policies. A similar situation prevails for the Baltic countries.8
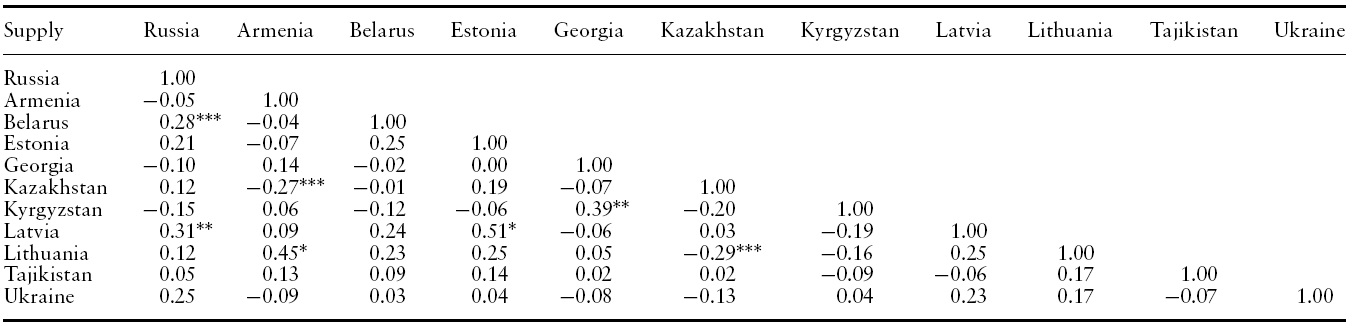
The analysis of correlation in supply shocks (Table 8) indicates the presence of symmetry in the shocks in the two Baltic states, namely Estonia and Latvia (with a high (0.51) and statistically significant coefficient). Neither of the Baltic States experiences any significant symmetry in the supply shocks with their eastern neighbours Belarus or Ukraine, with the exception of a positive supply shock correlation between Latvia and Russia (0.31). The results for Russia also indicate a co-movement in supply shocks only with Belarus (0.28).The correlation of supply shocks between Russia and Kazakhstan and Ukraine is positive although not statistically significant. Thus, the obtained empirical evidence on the supply shock correlation between the countries provides little support that can be credited in favour of the recent initiation of Russia, Belarus, Kazakhstan and Ukraine aiming towards the creation of the Common Economic Space. In addition, Kazakhstan’s supply shocks experience asymmetry with Ukraine (−0.13), while the latter country shows no sign of co-movement in supply shock correlation whether with Belarus (0.03) or Russia (0.25).
The overall results for supply shock correlation suggest that over the past ten years the former Soviet republics have recorded divergent patterns of business cycles. The sustainability of economic integration between these countries, with the exception of the Baltic States, and to some extent Russia-Belarus, would have to face significant challenges and substantial adjustment costs. Of key concern is that the formation of the Union State between Russia and Belarus includes the adoption of the Russian rouble in Belarus.9 In June 2002, the two countries concluded a Joint Action Plan that outlined 40 tasks (including a set of fiscal, monetary, foreign exchange policies etc.) to be implemented before the introduction of a single currency (Gulde
[Table 6.] Correlation of GDP growth in CIS

Correlation of GDP growth in CIS
[Table 7.] Correlation of inflation in CIS
Correlation of inflation in CIS
[Table 8.] Correlation of supply shocks in the former Soviet republics

Correlation of supply shocks in the former Soviet republics
No indications of symmetry in supply shocks are observed in the Central Asian republics either. For instance, the results present dissimilarity in shocks for Kazakhstan-Kyrgyzstan (−0.20) and Tajikistan-Kyrgyzstan (−0.09).
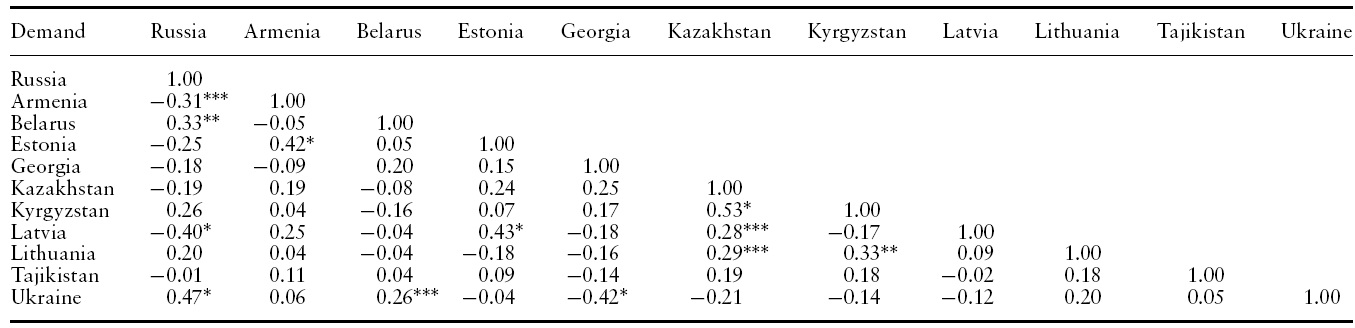
The results obtained for a demand shock correlation are comparable to the evidence obtained earlier for supply shocks. In Table 9, we observe signs of co-movement for the Estonian and Latvian pair (0.43) only, while the correlation coefficients for the other combinations within the Baltic States remain statistically insignificant. The results for the rest of the former Soviet republics indicate that the effects of demand shocks cause a significant degree of asymmetry for most of the countries. As was the case with the supply correlation, a significantly positive symmetry in demand shocks is observed between Russia and Belarus (0.33). A statistically significant and high positive correlation is also recorded between Russia and Ukraine (0.47) as well as between Ukraine and Belarus (0.26).
The obtained evidence for Russia and Belarus is particularly informative given the trade links existing between the two countries.
In the qualitative review of the Belarus and Russia currency arrangement, conducted by Gulde
No evidence of co-movement is observed between Kazakhstan and the rest of the members of the Common Economic Space. Similar to the results for a supply shock correlation for Ukraine–Kazakhstan, a demand shock correlation indicates a statistically insignificant presence of asymmetry between the two countries. In the case of the Central Asian republics, no evidence of a positive and statistically positive correlation was found, with the exception of Kazakhstan–Kyrgyzstan (0.53), contrary to the supply shock correlation results obtained in Table 8. In addition, a positive demand shock correlation was recorded for ‘unexpected’ combinations such asArmenia–Estonia (0.42), and Lithuania–Kazakhstan (0.29). This finding is particularly puzzling as there is very little evidence, if any, to suggest the presence of significant trade or economic links between the Baltic States and the Caucasian and Central Asian republics.
[Table 9.] Correlation of demand shocks in the former Soviet republics

Correlation of demand shocks in the former Soviet republics
The mixed results for the demand shock correlation (Table 9), can be attributed to the fact that demand shocks are prone to the effects of macroeconomic policies and therefore it is assumed by the OCA literature that supply side shocks provide more information on the symmetry of shocks (Zhang
4.3 Impulse Response and Variance Decomposition Results
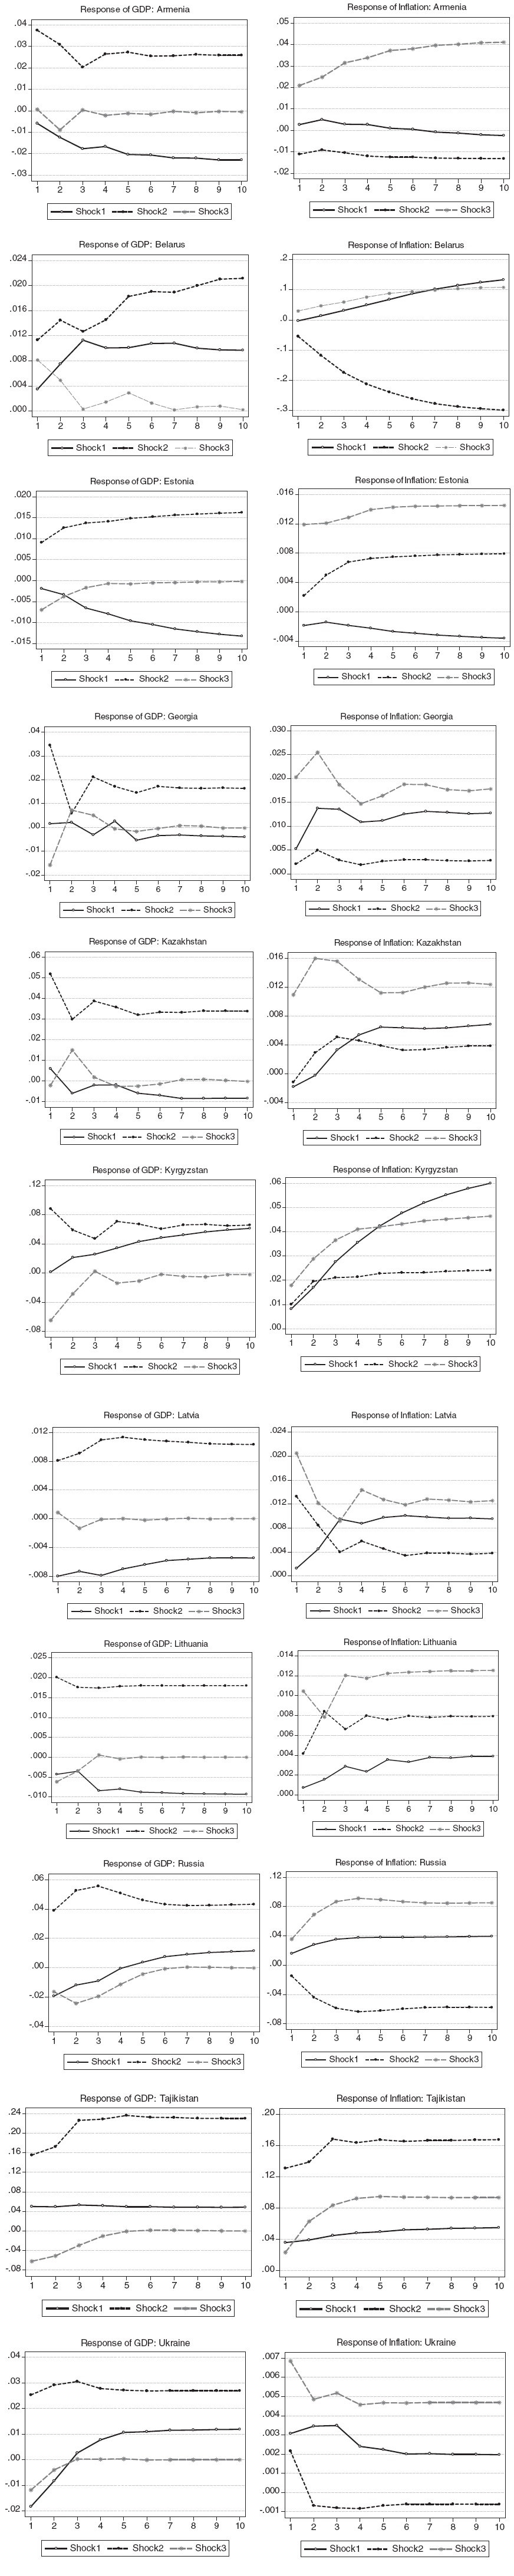
We present additional evidence on the relationship between structural shocks and their accumulated effect on output and price level. As illustrated in Figure 1, shock 1, shock 2 and shock 3 correspond to external (global), supply and demand shocks respectively.
As expected, a supply shock has a positive long-run impact on output, while the effect of a demand shock on output is transitionary only due to the underlying restriction. Despite the overall positive effect of a supply shock on output (Figure 1), the CIS and Baltic countries significantly differ in terms of the magnitude and duration of the response. Thus, comparing the output response between Russia and Belarus, for example, we can observe that in the case of Russia the output reaches its peak after approximately three quarters before converging to permanency, while in the case of Belarus, the convergence does not occur even after ten quarters.The two countries experience a somewhat comparable response to the external global shocks. The latter could be used as additional supporting evidence towards a common monetary area arrangement between Russia and Belarus. Similarly, for the three Baltic States, an external shock negatively affects domestic output and is lower in magnitude when compared to the other countries analysed in this paper (Figure 1). Overall, however, the effects of an external shock on output across the regional countries is visibly divergent with sizeable variations from country to country.
The impulse response results estimated for the price level present even more heterogeneous evidence on the dissimilarity of responses in inflation to structural shocks. Thus, the supply shock causes ‘a predicted’ effect of a fall in price level only in Armenia, Belarus, Ukraine and Russia. In all other countries, the supply shock actually leads to a permanent increase in the price level. This evidence could potentially suggest that the wage adjustment mechanism is not yet fully developed in most of the CIS and Baltic countries.
As for the impulse response results on the external shock, the shock causes a permanent increase in price levels in most cases. Significant heterogeneity is observed in terms of overall magnitude of the effect and its duration, with the smallest accumulated effect for Estonia and Lithuania, while the largest impact is most significantly pronounced in Belarus.
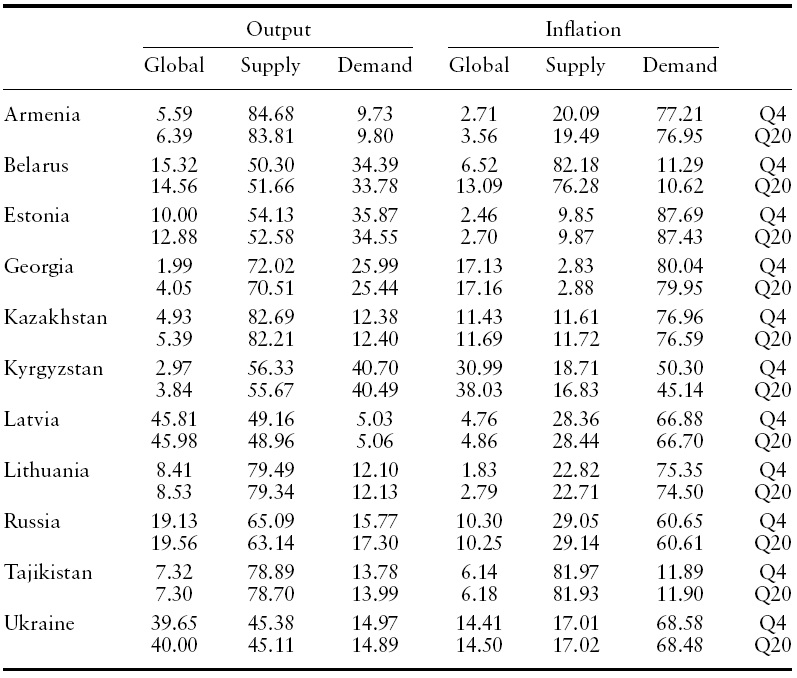
In order to underscore the role of the external shock and its impact on output and inflation,Table 10 presents variance decomposition results.The forecast error decomposition was performed for a four- and 20-quarter horizon.
The forecast error decomposition results are comparable for short horizons across regional countries, while differences become visible in the case of longer periods. The global shock plays generally a relatively negligible role in explaining the variation in output or inflation for the CIS and Baltic States. For example, in the case of Russia, 19.13% of output variation is explained by the global shock at quarter four and 19.56% at quarter 20. On the other hand, the supply shock explains more that 60% of the output variation in the case of Russia. Ukraine and Latvia constitute an exception to the pattern, where the global shock explains approximately half of the variation in output at both time horizons (45% for Latvia and approximately 40% for Ukraine). The variance decomposition results for the remaining two Baltic countries – Estonia and Lithuania, indicate the importance of domestic shocks in output variations.
With respect to price level variations, with the exception of Kyrgyzstan where global shocks account for more than 30% of variation in inflation, both CIS and Baltic countries record the importance of domestic shocks. For example, in Russia, demand shocks explain more than 60% of the price level variations.
Overall the primary implication of these variance decomposition results points towards the conclusion that common monetary arrangements within CIS or other regional sub-groupings such as EEC or CES would likely be costly to create and sustain. As pointed out by Chow and Kim (2003) idiosyncratic domestic shocks usually involve changes in relative prices among the countries. In this sense, where price adjustments are inelastic and with the inability to resort to nominal exchange rate adjustments, the recovery from shocks could potentially be tedious and lengthy (Chow & Kim, 2003).
[Table 10.] Variance decomposition results
Variance decomposition results
8The statistical significance of Pearson’s correlation coefficients is provided at the statistical significance levels of 1%, 5% and 10%. 9Russia is still the largest trading partner of Belarus with over 50% of Belarus’ exports and 70% of imports linked to Russia (CISSTAT; Starr, 2005), a pattern of trade inherited from the USSR period (Bogdanovich, 2005). 10Director, European II Department, IMF. Speech in Minsk, Belarus, 2 September 2003.
The feasibility of economic integration arrangements within the former Soviet republics, with a specific emphasis on a macroeconomic analysis of demand and supply shocks of the regional economies was examined. We present here an alternative approach to the theme of integration in the CIS republics, by providing an innovative empirical component that allowed us to measure the (dis)similarities in business cycles by estimating the degree of correlation in idiosyncratic shocks, which stem from the disparities in economic structures of the CIS economies discussed in previous work.
In addition to assessing the differences in economic structures of the former Soviet republics, we employ a structural VAR approach in order to test the symmetry of macroeconomic shocks in these economies. On the shock correlation side, we found only minor evidence to support the formation of deeper economic integration, which might lead to currency arrangements. This is merely a first step, dealing with the empirical evidence of a possible monetary integration in the CIS. The traditional bivariate SVAR approach of supply-demand shocks was enhanced to account for external shocks. Similar studies were previously conducted on Europe (e.g. Dedola & Lippi, 2005; Diboglu & Horvath, 1997).
Our results do not suggest the presence of strong empirical evidence to support the argument of monetary integration among Russia, Ukraine, Belarus and Kazakhstan, (i.e. the members of the Common Economic Space). Additionally, no specific evidence suggesting symmetry in shocks between the other members of the Eurasian Economic Community was found and even less indication was gathered for OCA arrangements for the rest of the CIS. On the other hand, we found some evidence to support the unification of Russia and Belarus either in terms of supply shock or demand shock correlation. The evidence for demand shock correlation for the post Soviet republics has led to mixed results. The empirical study on idiosyncratic demand shocks in the CIS area indicate that despite continuous efforts towards further economic integration for most member countries of the EEC and CES, the creation of a monetary union withRussia is likely to undermine the credibility of such an arrangement in some cases. Therefore, since member countries of the EEC or CES experience considerable asymmetries in their business cycles and also in terms of their reaction to external shocks, this would suggest that they would be better off retaining their monetary independence.
The results obtained from impulse response and variance decomposition methodology present very limited evidence to substantiate the claims on the feasibility of monetary union within the CIS. Although the impulse response results for domestic output are somewhat comparable across some countries, very limited similarity in the case of impulse response results for the domestic price level was found. The latter finding in particular, raises important questions as to the rationale and feasibility of having in place a common economic area within the CIS or a sub-grouping (in light of the visible idiosyncratic nature of the responses).
From the variance decomposition results, we can conclude that in most of the cases, global shocks play a relatively limited role in explaining the variation in either the domestic output or price level and, hence, domestic shocks remain dominant. This evidence could potentially suggest the low degree of economic integration and substantial future costs for the CIS countries if they move to form one common entity. This evidence could also be supported by the correlation of shocks reported here which revealed the significant idiosyncratic nature of the business cycles for most of the countries.
Finally, in order to overcome the difficulties associated with the asymmetries, regional countries should opt for more flexibility in labour markets (Mundell, 1961). The importance of the labour market is particularly significant for the former Soviet States due to strong historical ties and the absence of a language barrier. Other mechanisms, such as wage flexibility or fiscal transfers are likely to have minimal effect due to the divergent economic structures of those economies coupled with a lack of a coordinated mechanism dealing with these issues (Gulde