This paper analyses the role of the macroeconomic structure in the response of industrial output to an oil price shock in six OECD countries. The modelling of the macroeconomic structure is important in examining the effect of an oil price shock on the industry-level output, since the analysis of the transmission mechanisms helps us to better understand the response of industrial output to such a shock. Thus, cross-country differences found in the responses of industrial output to oil price shocks within the European Monetary Union can be partially explained by differences in the transmission mechanisms of such shocks.
Oil price shocks present policy-makers with difficult choices as they simultaneously pose upside risks to inflation and downside risks to growth. In responding to oil price shocks, it is essential to understand that policy-makers cannot offset the real effects of oil price increases. An oil price increase triggers a loss in the economy’s terms-of-trade and implies a transfer of wealth from oil-importing countries to oil exporters. This change in the terms-of-trade (in relative prices) requires an adjustment of the real economy andmust be absorbed by markets. The policy-makers’ aim should be to facilitate this adjustment by minimising inflationary pressures and aggregate output losses. In reacting to oil price shocks, it is, therefore, important that policy-makers do not repeat the mistakes of the past by attempting to stabilise output growth at unrealistic levels. (Speech by Lucas Papademos, Vice-President of the European Central Bank, delivered at the Nomura Annual Euro Conference ‘A challenging future for Europe’, Tokyo, 11 November 2004)
The study of the impact of oil price shocks at the aggregate level has attracted considerable interest in the literature over the past three decades. This literature reports a lower output growth and a higher inflation after an oil price increase in oil importing countries.1 In sharp contrast to the volume ofwork investigating the effects of oil price shocks on output at the aggregate level, there has been relatively little work done on studying such effects at the industrial level (see Lee & Ni, 2002, for the US; Jiménez-Rodríguez, 2008, for economies other than the US).2,3 On one hand, Lee and Ni (2002) showed, by using an identified multivariate VAR model, that oil price shocks have a variety of negative effects upon US industries, with oil shocks mostly reducing the supply of oil-intensive industries and the demand of many other industries.On the other hand, Jiménez-Rodríguez (2008), using a recursively identified bivariate VAR model, reported the existence of homogeneity of industrial output responses across industries in Italy and the Anglo-Saxon countries (the UK and the US), as well as the existence of crossindustry heterogeneity in three of the four European Monetary Union (EMU) countries considered (France, Germany, and Spain).The latter author also showed evidence of heterogeneity of output responses across the four EMU economies (France, Germany, Italy, and Spain) and evidence of homogeneity in the Anglo-Saxon countries. In addition, this author also investigated possible explanations for these cross-country differences, and found that such differences did not seem to be due to either oil consumption or product/labour market rigidity, although they could be partially explained by differences in the industrial structure. Another possible explanation (not explored up to now) that may help to better understand the cross-country differences is the role that the macroeconomic structure may play in the response of industry-level output to oil price shocks.
This paper extends the previous literature on oil price impacts by assessing the role of the macroeconomic block of the economy in the response of industrial output to an oil price shock for six OECD countries (France, Germany, Italy, Spain, the UK, and the US). To do so, we first estimate an identified multivariate VAR model (which includes the macroeconomic structure of the economy) for each country and each industry studied, and we then compare such results with those obtained from a recursively identified bivariate VAR model with oil prices and specific industrial output as variables (as in Jiménez-Rodríguez, 2008). Thus, if the results from the bivariate model do not statistically differ from those resulting from our multivariate model, the transmission mechanisms related to the macroeconomic structure do not act as a limitation on the consequences of an oil price shock at the industrial level. This does not mean that the transmission mechanisms do not exist, but that they may work in such a way that they effectively cancel each other out. However, if the results do differ, a likely reason (apart fromsampling errors) may be that the transmission channels related to the macroeconomic block either help to significantly limit the impact of an oil price shock or contribute to a significantly increased negative impact at the industrial level.
The conclusion obtained from this analysis is important for policy-makers given that the macroeconomic policy implemented may (not) help to smooth the effects of oil price shocks on industrial output.
The rest of the paper is organized as follows. Section 2 describes the methodology. Section 3 presents the empirical results. Section 4 concludes.
1See Hamilton (1983, 1996, 2003), Gisser and Goodwin (1986), Mork (1989), and Hooker (1996), among others, for the US; and Burbidge and Harrison (1984), Mork et al. (1994), Jiménez-Rodríguez and Sánchez (2005, 2009), and Kilian (2008) for countries different from the US. 2We find other authors who analysed the US industry-level effects of oil price shocks on other research topics (creation and destruction of manufacturing job, Davis and Haltiwager, 2001; inventory-sales, Herrera, 2007; and stock returns, Kilian and Park, 2009). 3Bohi (1989) compared the industrial impact of oil prices in Japan, Germany, the UK, and the US, although his comparisons were informal.
2. Econometric Specification and Identification
We consider a
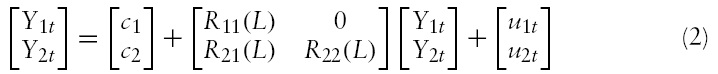
The reduced-form VAR model is the following

where
We impose, as Lee and Ni (2002) did,9 that macroeconomic variables affect industrial variables, but the latter variables do not affect the former variables.10 The economic interpretation behind this assumption is that changes in a specific industrial output are not individually able to affect the macroeconomy. However, this assumption is not incompatible with the fact that changes in output of several industriesmay involve macroeconomic consequences.
where
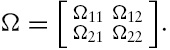
The structural VAR approach assumes that the disturbances

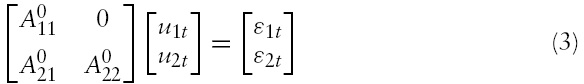
Thus, the structural VAR is described by:

where
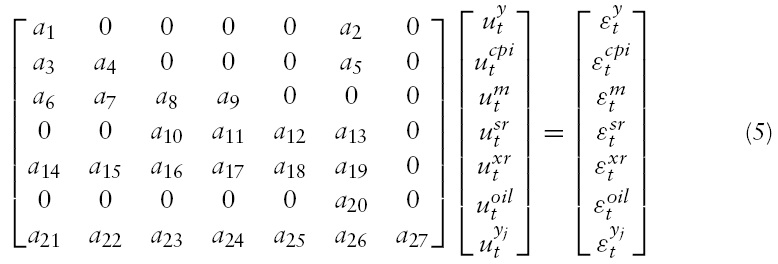
Before we explain the details of our identifying restrictions, it is worth noting that the following relations are contemporaneous restrictions on the structural parameters of
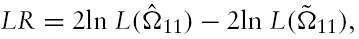
As a result of the zero-restrictions imposed to identify our structural VAR,13 the sub-system referred to the macroeconomic variables is overidentified with one overidentifying restriction. While imposing an overidentifying restriction in the macroblock allows us to check the validity of the set of the full identifying restrictions, this checking cannot be performed when the sub-system is just identified. Thus, we test the restricted model against the reduced-form model by employing a likelihood ratio test:

which is

distributed under
and

are the concentrated log-likelihood functions for the reduced and structural forms, respectively (see Hamilton, 1994; Amisano & Giannini, 1997). The set of restrictions we select gives a

We estimate the structural VAR model by maximum likelihood, with the optimal lag length chosen on the basis of the Akaike Information Criterion.We obtain the impulse responses to an oil price shock (a unit shock) and their corresponding 90% confidence bands calculated through a bootstrapping procedure with 1000 draws (see Berkowitz & Kilian, 2000).
We apply this methodology to the same countries and the same industry database as Jiménez-Rodríguez (2008) in order to assess the relevance and the role of the macroeconomic block on the industrial responses to oil price shocks. Specifically, we consider four EMU countries (France, Germany, Italy, and Spain), the UK, and the US, and the industrial data refer to aggregate manufacturing industry and eight individual manufacturing industries grouped according to the two-digit International Standardized Industrial Classification (see the Data Appendix for further details). The sample runs from 1975:1 to 1998:1214 for all countries but France and Spain15 where data start in 1980:1. Despite the fact that our database ends in 1998:12, due to data availability, and does not allow us to analyze what has happened in the last decade, the analysis reported in the present paper provides valuable lessons of experience. Although the global and country-specific macroeconomic and geopolitical conditions change over time, this study may help us to gauge the vulnerability of the countries studied to possible forthcoming oil supply shocks.16
44Total industrial production is used as a proxy of economic activity. It is worth stressing that this variable and GDP are highly correlated and that the latter is only available at quarterly frequency. 5Real effective exchange rate is defined such that an increase means a real appreciation of the currency considered. An appreciation of the real exchange rate is expected to hurt the country’s external competitiveness. 6The use of non-linear transformations of oil price to analyse the impact of oil price shocks on aggregate output has been theoretically justified by the inter-sectoral adjustments with which they are involved (see Jiménez-Rodríguez & Sánchez, 2005, and references therein). Thus, we do not apply such transformations in our study, given that our main goal is to analyse the impact at the industrial level, and their use may give rise to biased results. 7The macroeconomic block includes, apart from total industrial production and real oil prices, other variables to capture some of the most important transmission channels through which oil prices may affect real economic activity indirectly, in part by inducing changes in economic policies. These channels include the effects of oil prices on inflation and exchange rates, which then induce changes in real economic activity. Our macroeconomic block also incorporates a monetary sector that can react to inflationary pressures. 8In this paper we do not perform an explicit analysis of the long-run behaviour of the economy. By doing the analysis in levels we allow for implicit cointegrating relationships in the data, and still have consistent estimates of the parameters. For further discussion in this issue, see, for example, Sims et al. (1990), Hamilton (1994), and Ramaswamy and Sløk (1998). 9Davis and Haltiwanger (2001) also did the same assumption in their study about the effects of oil price changes and other shocks on the creation and destruction of US manufacturing jobs. 10The likelihood ratio tests (based on the so-called block-exogeneity test) indicate that the blockrecursive restrictions (i.e. R12(L) = 0) cannot be rejected for most industries and most countries. Even in the cases of rejection, the estimate of the variance-covariance matrix of the macroblock, Ω11, is not significantly altered by the presence of the specific industrial output. Thus, we estimate under the restriction that macroeconomic variables are not affected by the specific industrial output. 11It is worth noting that the non-recursive structure (contrary to the recursive one) allows us here to consider the contemporaneous interactions between the interest rate and the exchange rate, and the non-reaction of the interest rate contemporaneously to changes in output and inflation (see Sims & Zha, 1998), as well as the contemporaneous interactions between the interest rate and money stock (see Kim & Roubini, 2000). 12Our baseline results are robust to other identifying schemes. An Appendix with these results is available from the author upon request. 13Notice that A21 and Ω21 contain the same numbers of elements, and so we do not impose restrictions. The same situation happens with A22 and Ω22. 14The OECD database ‘Indicators for Industry and Services’ is available from 1975:1 to 1998:12 based on International Standardized Industrial Classification (ISIC) Revision 2 and from 1990:1 to 2001:9 based on ISIC Revision 3.We use data from ISIC Revision 2 and do not extend up to 2001:9 given that OECD advises that the two classification systems (ISIC Revision 2 and ISIC Revision 3) are not fully compatible and, thus, comparisons have to be made with caution. 15As in Jiménez-Rodríguez (2008), we start the Spanish sample in 1980:1, given that the Spanish policy of subsidizing oil prices (implemented up to the end of the 1970s) may have distorted the effects of oil price shocks on the Spanish industries. 16Notice that the growth tendency of real oil prices from 2002 onwards differs from previous oil price shocks, which were mainly caused by sizeable disruptions to the supply of oil. The factors driving the oil price increases over the last few years were basically caused by demand factors. See Kilian (2009) for further discussion.
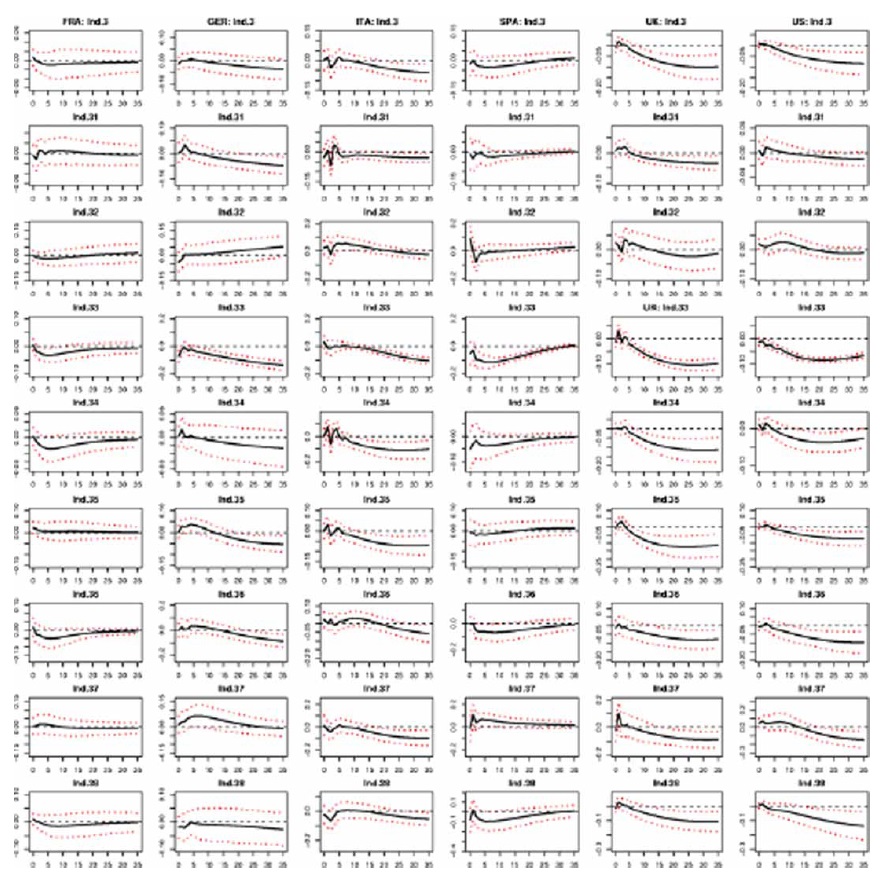
The results from the above-mentioned multivariate VAR model indicate that higher oil prices reduce the level of aggregate manufacturing output in all countries under consideration, although the pattern of responses differs somewhat across countries (see Figure 1, first row of charts). The Anglo-Saxon countries and two EMU countries (Germany and Italy) show a similar response of aggregate manufacturing output to an oil price shock, with the negative effect being permanent.17 In France and Spain, the negative effect becomes almost zero three years after the shock. Therefore, the response of aggregate manufacturing output to changes in oil prices is markedly different across the EMU countries under study, but similar in the UK and the US. Moreover, the magnitude of response is different across countries, with the Anglo-Saxon countries showing the largest negative impact.
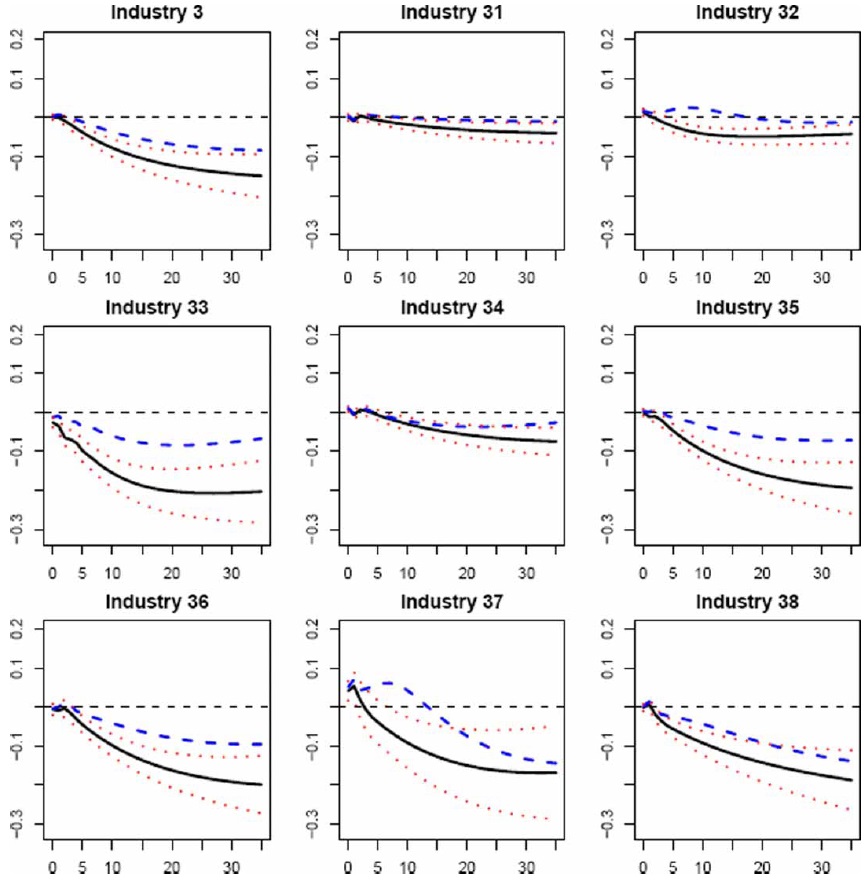
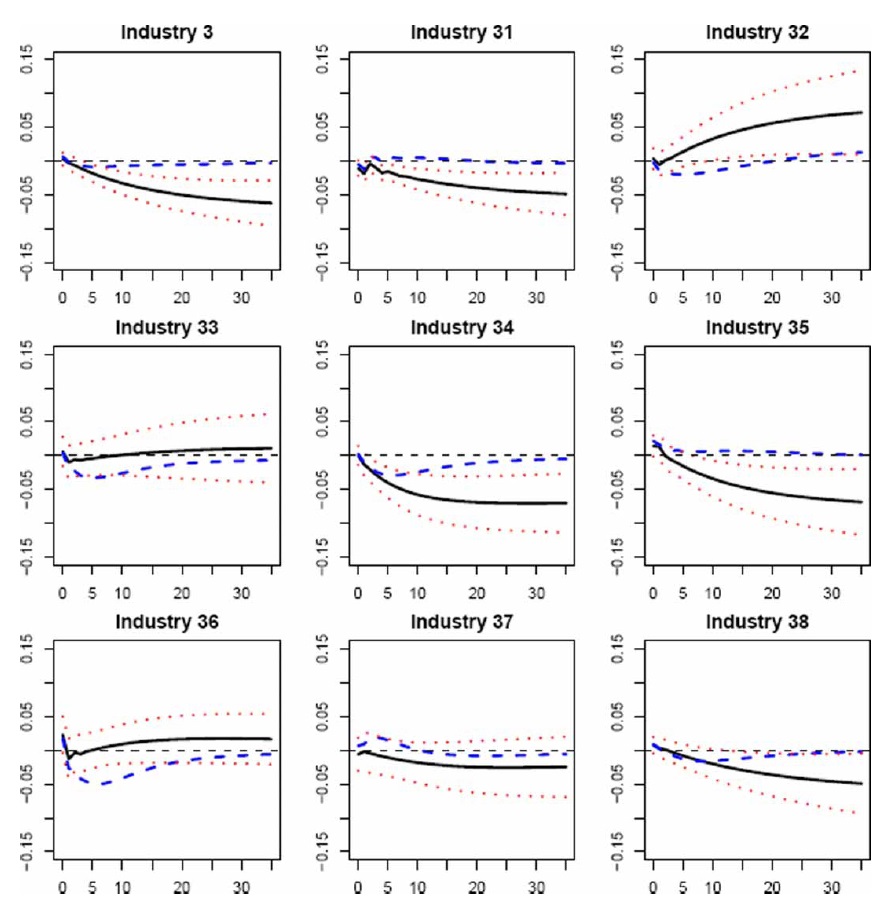
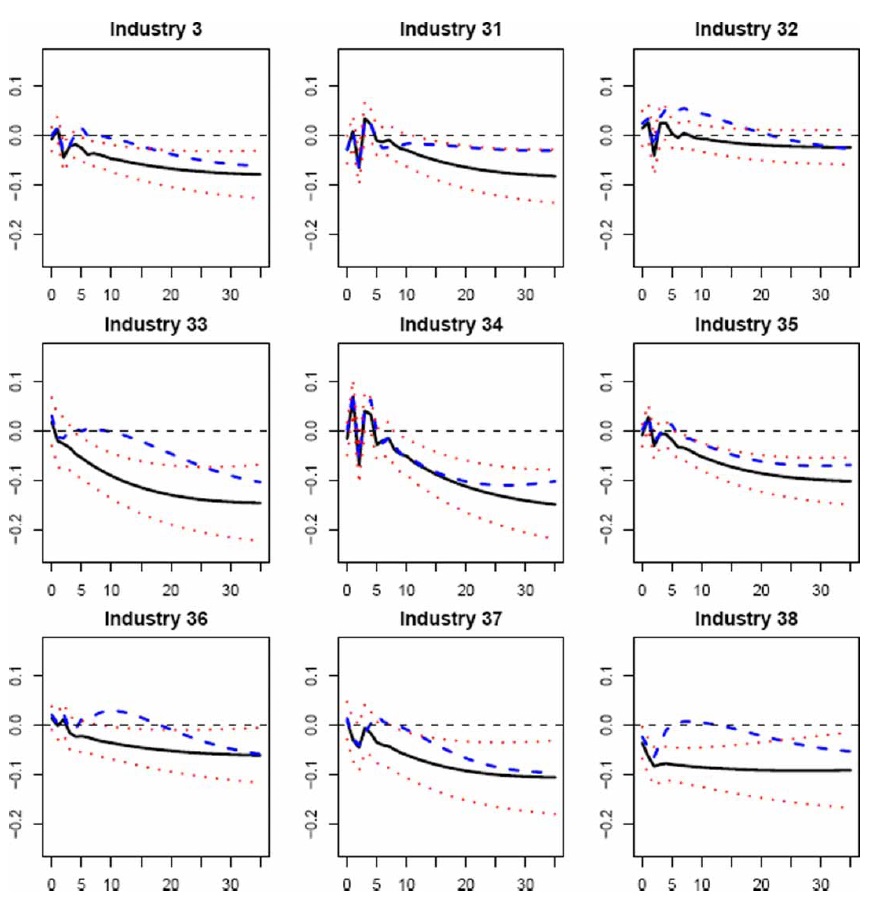
The output responses of the eight industry groups within manufacturing show a significant differential pattern of output responses to an oil price shock across countries (see Figure 1, rows 2 to 9 of charts). Whereas the output responses of EMU manufacturing industries substantially differ among countries, the negative pattern of responses is similar for most industries in the Anglo-Saxon countries. Among the EMU economies considered, similarities are observed between German and Italian output reactions for, at least, four industries (‘wood and wood products’, ‘paper and paper products’, ‘chemical’, and ‘non-metallic mineral products’ industries), and also between French and Spanish output responses for another four industries (‘wood and wood products’, ‘paper and paper products’, ‘non-metallic mineral products’, and ‘metal products, machinery and equipment’ industries). In addition, the Italian and German industrial output responses are relatively similar to those found in the Anglo-Saxon countries, with all manufacturing industries negatively affected by an oil price increase. The exceptions are the ‘textiles, wearing apparel and leather’ and ‘basic metals’ industries in Germany, which show a positive response when oil price increases.
We calculate the standard correlation coefficient in order to analyse the extent to which the industrial effects of oil price shocks are similar across countries.We first find that this correlation coefficient reaches values larger than 0.80 for all industries in the two Anglo-Saxon countries. Second, the correlation coefficients of output responses between the Anglo-Saxon and German industries and those between the Anglo-Saxon and Italian industries are larger than 0.50 for almost all industries. Third, the Italian-German correlation coefficient is above 0.90 except for ‘food, beverages and tobacco’, ‘textile,wearing apparel and leather’ and ‘basic metals’ industries. Finally, a positive correlation (larger than 0.70) between the responses of four industries (namely, ‘wood and wood products’, ‘paper and paper products’, ‘non-metallic mineral products’, and ‘metal products, machinery and equipment’ industries) is found for the other two EMU countries (France and Spain).
Therefore, the output responses of the manufacturing industries to an oil price shock show cross-country heterogeneity for the four EMU countries studied and homogeneity across the Anglo-Saxon countries. To better understand such crosscountry heterogeneity, we assess the role that the macroeconomic structure of the economy may play in the responses of industrial output to an oil price shock.
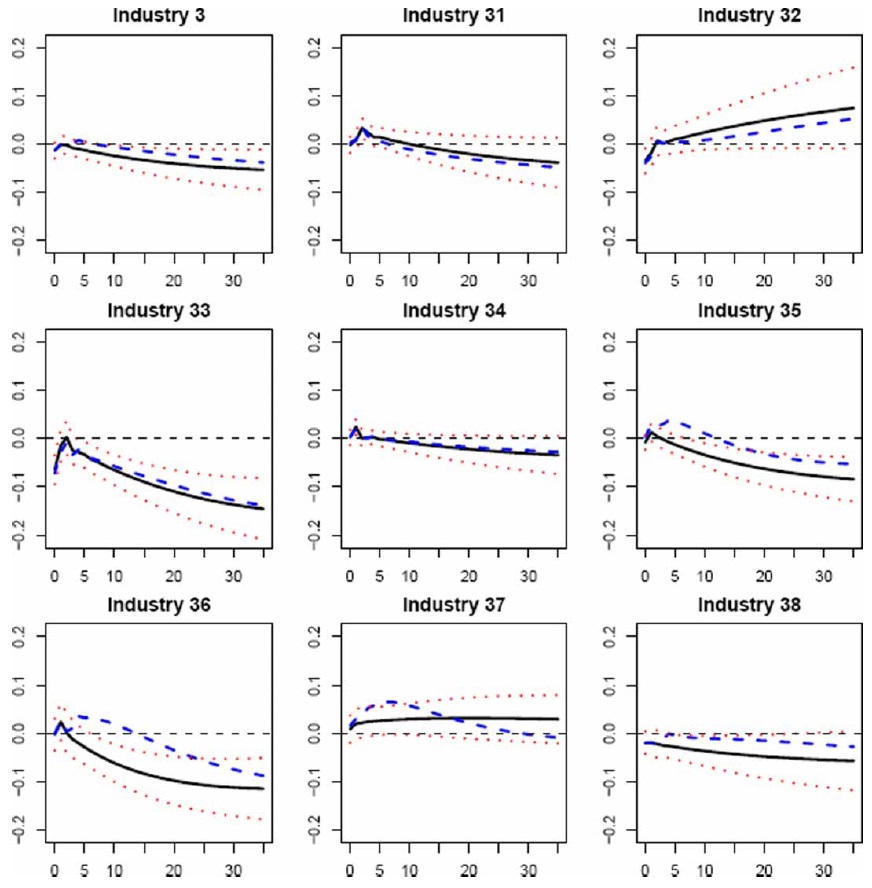
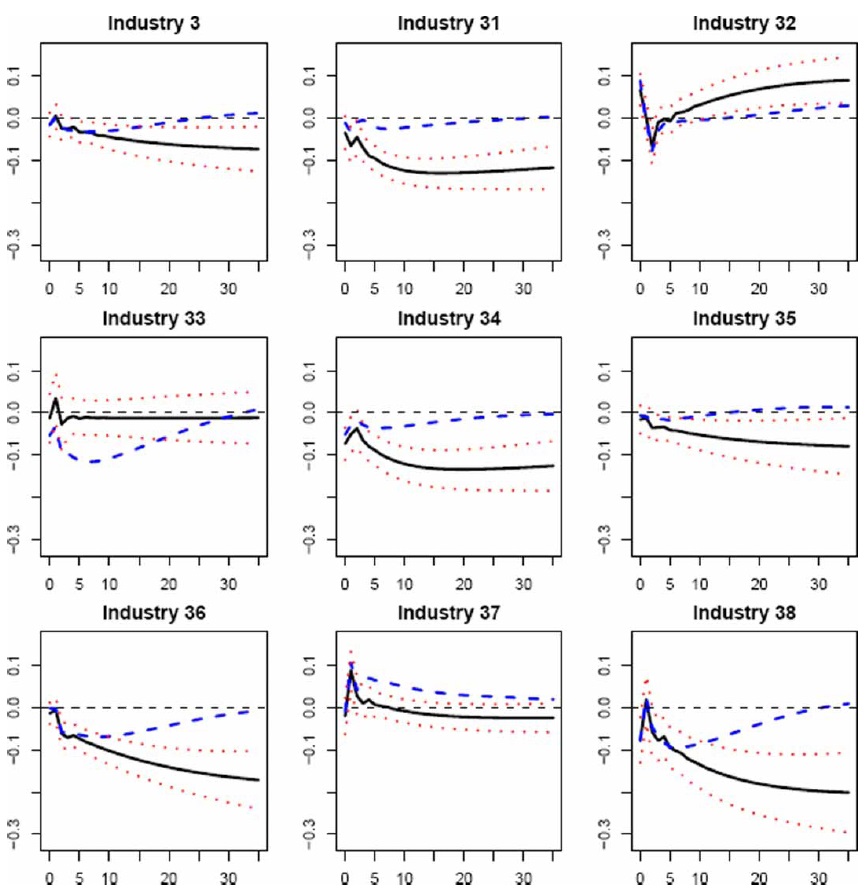
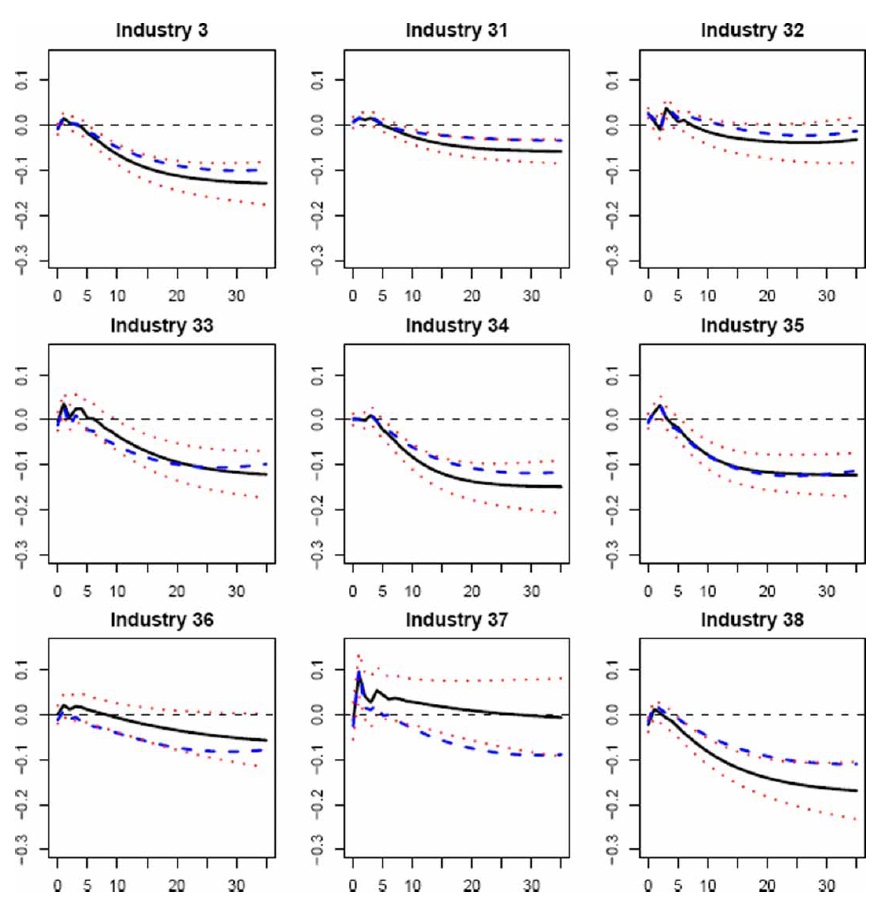
Figures 2–7 display the dynamic effects of an oil price shock on output, and their 90% confidence intervals resulting from a recursively identified bivariate model (as in Jiménez-Rodríguez, 2008),18 as well as the impacts on output obtained by using our multivariate VAR model. On comparing the results from both models, we observe that the responses resulting fromourmultivariate model are within the 90% confidence intervals calculated around the responses of the bivariate model for most industries in the Anglo-Saxon countries, Italy, and Germany.19 Given that the responses of the bivariate model, by construction, measure the average total effect of an oil price shock on the specific industrial output and are statistically identical to the responses of themultivariate model, the transmission mechanisms related to the macroeconomic structure seem not to act as a limitation on the effects of an oil price shock on industry-level output. This does not mean that the transmission channels do not exist, but they may work in such a way that they cancel each other out. However, the transmission mechanisms of an oil price shock seem to have a remarkable influence on the output responses for the other EMU countries (France and Spain), given that the responses from our multivariate model lie outside the 90% confidence intervals calculated for the responses of the bivariate model. There seem to exist relationships between the real oil price and the remaining macroeconomic variables in France and Spain, which means that an oil price shock has a permanent effect upon industry-level output.20 Therefore, the modelling of the macroeconomic structure seems to be important in examining the consequences of an oil price shock at the industrial level, since the analysis of the transmission channels helps us to better understand the response of industry-level output to such a shock.
On examining the responses of the macroeconomic block to an oil price shock, we find that the results in all countries are consistent with what is predicted by many theories. Following an oil price shock, aggregate output falls and consumer prices rise. Monetary authorities respond with a contractionary monetary policy by raising interest rates, possibly aimed at curbing inflation. Higher oil prices also lead to both a contraction in monetary aggregates21 and a depreciation of the real effective exchange rate. Aswe previously highlighted, the analysis of transmission channels related to the macroeconomic block helps to gain a better understanding of the influence of an oil price shock on the response of industry-level output. Since the monetary policy and real effective exchange rate responses to an oil price shock tend to be the main transmission mechanisms,22 we next assess how industrial output reacts to an increase in interest rates and to a depreciation of the real effective exchange rate. Higher interest rates reduce industry-level output in most industries in all countries,23 which contributes to lower output at the industrial level after an oil price shock. The real exchange rate depreciation contributes to partly offsetting the negative impact on industrial output, which follows an oil price shock in all the countries studied except France and Spain. In the latter two countries, the depreciation tends to have the opposite expected impact by reducing industry-level output, which contributes to larger negative effects.24
Therefore, we observe that the effects of the main transmission mechanisms of an oil price shock tend to cancel each other out in the Anglo-Saxon countries, Italy, and Germany, which may explain why the results from the bivariate model do not statistically differ from those resulting from our multivariate model. In France and Spain, however, the effects of such mechanisms are multiplied, which may help to explain why the results from both models differ.
17The finding that higher oil prices adversely affect the UK manufacturing activity is in concordance with the result reported by Jiménez-Rodríguez and Sánchez (2005) for overall economic activity. 18Jiménez-Rodríguez (2008) considers a recursively identified bivariate VAR model with real oil prices in domestic currency and specific industrial output as variables (entering into the bivariate model in that order), and this model is estimated by the maximum likelihood estimation approach. 19We have verified that the same conclusion can be obtained by analysing whether the responses resulting from the bivariate model are within the 90% confidence intervals calculated around the responses of our multivariate model. These results are available from the authors upon request. 20It is worth stressing that the macroeconomic block does not lead to more homogeneous output responses across industries in those countries for which cross-industry heterogeneity is found using the bivariate model (France, Germany, and Spain). 21The only exception to this is Italy, where the monetary aggregate only lessens after one year. 22Looking at the forecast error variance decomposition, we observe that the main two sources of volatility (apart from oil prices) for most industries are interest rates and real effective exchange rates in all countries. 23Authors such as Bohi (1989) and Bernanke et al. (1997) argued that overall economic downturns observed in the US after oil price shocks are caused by a combination of direct impacts of the shocks themselves and the monetary responses to them. 24An Appendix with all these results is available from the author upon request.
This paper assesses the importance and the role of the macroeconomic block of the economy in the response of the industrial output to an oil price shock in six OECD countries (France, Germany, Italy, Spain, the UK, and the US). In doing so, we first estimate an identified multivariate VAR model, obtaining that the output responses of the manufacturing industries to an oil price shock show relevant differences across the four EMU countries studied and similarities across the Anglo-Saxon countries. We then compare these results with the results obtained using a recursively bivariate VAR model (as in Jiménez-Rodríguez, 2008). Thus, we observe that the modelling of the macroeconomic structure is important in examining the consequences of an oil price shock on the industry-level output, since the study of the transmission channels helps us to better understand the response of industrial output to such a shock. Therefore, cross-country differences found within the EMU can also be partially explained by differences in the transmission mechanisms related to the macroeconomic block in addition to differences in the industrial structure.25
25See Jiménez-Rodríguez (2008) for further details regarding the influence of the industrial structure.