This paper aims to find how Korea’s cultural exports, a measure of cultural proximity, influence its total exports. Centered on consumption goods, detailed product-by-product analyses are also conducted. Empirical analyses using the gravity model show that a 100% increase of Korea’s cultural exports has the effect of increasing total exports by 3.9-4.7%; the export increasing impact of reproducible cultural goods is 3.8-6.1%. The one-year lagged cultural exports also significantly affect the current total exports. Although the overall positive impact of cultural exports is stronger to those of nondurable consumer goods, exports of some durable goods are also positively influenced by them. Meanwhile, the positive impact of cultural exports is larger in higher-income nations. In the case of higher-income countries, the export-increasing effect is larger on durable consumer goods, but, in the case of lower-income countries, larger on nondurable consumer goods. Asian countries are more positively affected by Korea’s cultural exports than those in the other regions. From the viewpoint of trade policy, Korea should take greater interest in cultural exports to higher-income countries in order to increase their positive impact.
UNESCO (2005) defines cultural goods and services as “tangibles and intangibles conveying cultural contents that might either take the form of a good or a service.” In a broader term, cultural goods and services also include “the goods and services which are required to produce and disseminate such content, including cultural equipment and support materials, as well as ancillary services even if they are only partially cultural in their content (UNESCO, 2005).” Meanwhile, Schulze (1999) use the term, “art”, rather than cultural goods and services. It defines art by including goods and services which are definitely art, and uses them as examples rather than endeavoring to define art in its entirety. According to Schulze (1999), art is comprised of three categories: live performing art; unique, non-reproducible art (original paintings, sculptures, and antiques) and reproducible cultural art (recorded music and films, books, and so on). Although cultural goods show a partial picture of “tangibles and intangibles conveying cultural contents”, this paper only focuses upon cultural goods mainly due to data availability.
The market for cultural goods is arguably one of the most internationalized. World imports of cultural goods increased 347%—from $47.8 billion to $213.7 billion—between 1980 and 1998 (UNESCO, 2000). The worldwide entertainment and media markets were estimated to be $1,228 billion for 2003 (Price Waterhouse Coopers, 2004). Based on customs-based data, trade in core cultural goods increased between 1994 and 2002, from $38 billion to $60 billion (UNESCO. 2005). Cultural goods have recently been an important part of international trade.
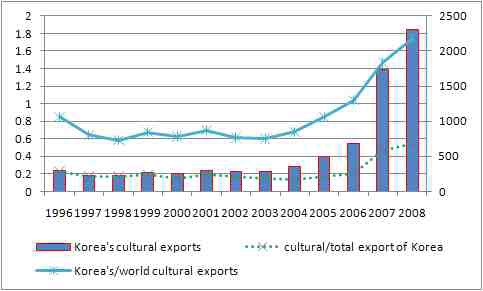
Korea’ cultural exports have also surged. The size of Korea’s cultural exports has increased from $250 million in 1996 to $2.25 billion in 2008. The share of Korea’s cultural goods exports as a percentage of the world total has also grown, from 0.8% in 1996 to 1.8% in 2008. Korea’s exports of cultural goods to the United States constituted about 56% of the total in 1996, but decreased to about 30.5% in 2008. Germany and France have been the main importers of Korean cultural goods in Europe. The share of exports to 10 Asian countries
In Korea, trade in cultural goods attracts wide attention for two reasons. First, Hallyu
This paper focuses upon the second argument. Academic studies on the effects of cultural exports are related to literature on cultural proximity and international trade. It has been known that cultural closeness exerts a positive influence on bilateral trade (Melitz, 2002; Girma and Yu, 2002; Rauch, 2001; Beugelsdijk, de Groot, Linders, and Slagen, 2004). The primary reasoning is the reduction of transaction/information costs through cultural proximity. Garnaut (1994) argues that linguistic and other historical and cultural links are particularly important at reducing the cost of unfamiliarity in international trade relating to the so called ‘psychic costs’ or ‘subjective resistance’. Head and Ries (1998) also insist that ‘taste linkage’ reduces transaction costs.
Many academic papers are dedicated to empirically estimating the impact of cultural proximity on trade by using time-invariant proxy variables. There are a long list of proxies of cultural proximity: common language (Melitz, 2003; Fidrmuc and Fidrmuc, 2009), ethnic network (Rauch and Trinidade, 2002; Girma and Yu, 2002), immigrants (Head and Ries, 1998), social and business network (Rauch, 2001; Wagner, Head, and Ries, 2002), historical links (Eichengreen and Irwin, 1998), a combination of these variables (Felbermayr and Toubal, 2007), cultural similarity index (Hofstede, 2001; Kogut and Singh, 1988; Beugelsdijk
Theories have been developed to explain what determines patterns of international trade in cultural goods. Stigler and Becker (1977) and Throsby (1999) suggested that cultural closeness is formed through an accumulation process of consumption and cultural capital. Disdier
There are a few researches on the impacts of Korea's cultural exports
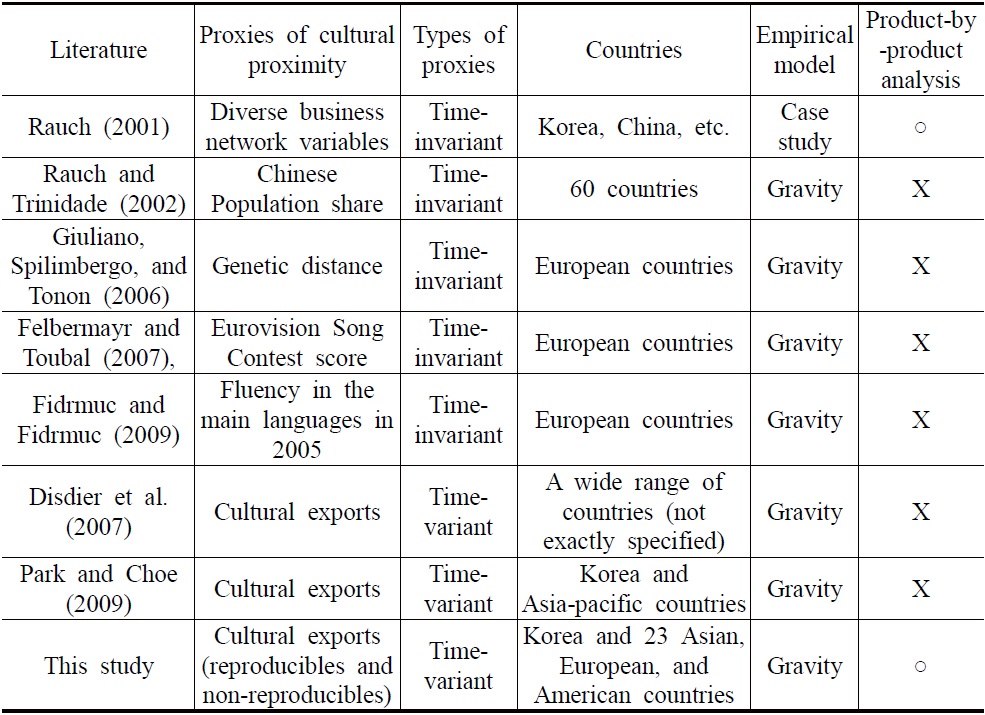
This paper aims, by using a gravity model (as most of relevant literature did. See Table 1), to find how Korea’s cultural exports influence its total exports. Similar to the previous literature, we hypothesize that cultural trade reduces transaction costs, forms similar preferences among trade partners, and makes positive impacts on total exports.
Meanwhile, this paper is distinctive in some ways (See Table 1). First, this empirical study covers not only Korea’s cultural exports to East Asian countries, but also to the other regions such as major European countries, India, and Middle East countries. Although there have been a few studies that test how cultural exports impact the overall exports of Korea, all of them focus on Korea’s exports of cultural goods to East Asia and the Pacific region. While the rapid increase of Korea’s cultural exports is overlapped with Hallyu in East Asia, Korea’s exports to countries outside of East Asia and the Pacific region have become important. For example, K-pop has become popular in European countries such as France (Korea Herald. 2011).
Second, we estimate the impacts of cultural exports by product category, income level of importing countries, and region. There has been little research with such detailed analyses. Moreover, as mentioned later, this study divides cultural goods into reproducible and non-reproducible goods. Third, this research uses panel data of exports in cultural goods as a measure of the cultural proximity. As mentioned above, many studies of cultural proximity and international trade have used time-invariant genetic cultural variables. However, by using time-series trade data, the changing nature of cultural proximity, which is consistent with the theories of the accumulation of cultural capital, can be estimated.
[Table 1] Selected Empirical Literature of Cultural Proximity and Trade
Selected Empirical Literature of Cultural Proximity and Trade
This paper proceeds as follows. The second section explains the empirical model and data used. The third section presents the results of empirical analyses. The last section concludes. In brief, the results capture the effects of cultural proximity. Korea’s exports of cultural goods have a positive influence on Korea’s total exports.
1The ten Asian countries are China, Hong Kong, Indonesia, Japan, Malaysia, Philippines, Singapore, Thailand, Vietnam, and Taiwan. 2Hallyu, a term coined by Chinese journalists in the late 1990’s (Lee, 2002), means the phenomenon of Korean popular culture becoming vogue, especially in East Asia. 3This paper only refers to literature in economics. There are a number of researches on Korea’s cultural exports, so called Hallyu, in diverse academic disciplines such as media, business, culture, and sociology. The major argument related to this paper’s theme is that the consumption of Hallyu improves Korea’s country image and this also positively influences on the preference for Korean consumption goods. See Kim(2011) for studies of the other disciplines in detail.
This empirical research uses a gravity model. There exists no concrete theoretical basis for cultural exports impacting other exports (mainly consumer goods). Meanwhile, the gravity model is regarded as a very useful tool to analyze impacts of diverse factors on trade, such as transport costs, tariffs, regional integration, cultural proximity, etc. Moreover, the gravity model now has a solid theoretical basis (Shepherd, 2010).
The gravity model used in this paper is based on Anderson and van Wincoop (2003). Although traditional gravity equations are empirically successful, they just capture the impact of bilateral trade costs on trade flows, ignoring the fact that countries operate in a multilateral world. As a result, traditional estimates suffer from omitted variable bias since they fail to control for theoretically motivated price index terms, which aggregate both domestic and international trade costs, and cannot capture “multilateral resistance (the barrier to trade that each countries face with all of its trading partners)”. Failing to account for multilateral resistance effects lead to overestimated impacts of changes on trade barriers in bilateral trade.
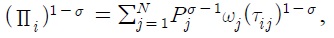
Anderson and van Wincoop (2003) assumes, first, that the supply of each good is fixed in that each region is specialized in the production of only one good. Second, preferences are identical, homothetic, and approximated by a CES utility function. The key characteristic of the theoretical model of Anderson and van Wincoop (2003) is multilateral resistances. Based upon them, trade between regions is determined by relative trade barriers. That is, trade between two regions depends on the bilateral trade barriers relative to average trade barriers that they face with all trading partners. The theory implies an empirical model as follows.

Where

denotes inward resistance and captures the fact that country
captures the dependence of exports from country

Where

Based on the model specified above, product-by-product analyses are also conducted by subdividing Korea’s exports into more detailed categories. In the product-by-product analyses, the volume of the corresponding cultural exports is excluded from that of a specific product category.
Besides the OLS estimation, the Poisson estimator, suggested by Santos Silva and Tenreyro (2006), is used in order to take into account the presence of bilateral trade flows that are zero or missing from the dataset
The time span of data is 1995-2008 (Data of 1994 is also used to make a one-year lagged variable of cultural exports). Data of 23 countries are used. Those countries are major importers of Korea cultural goods in North America (including Mexico), Europe, and Middle East as well as Asia. They cover about 95% of Korea’s cultural exports and about 76% of Korea’s total exports in 2008
This paper employs the HS (Harmonized Commodity Description and Coding system)
All variables used in the OLS analyses are logged forms. A summary of statistics is in Table 2. Nominal GDP data are collected from the IMF World Economic Outlook Database. The Linder effect is calculated based on real GDP data from the IMF World Economic Outlook Database. The annual average of the real exchange rate is the value of Korean won compared to a unit of the partner countries’ currency. Daily exchange rate data are collected from Bloomberg.
[Table 2] Summary of Statistics
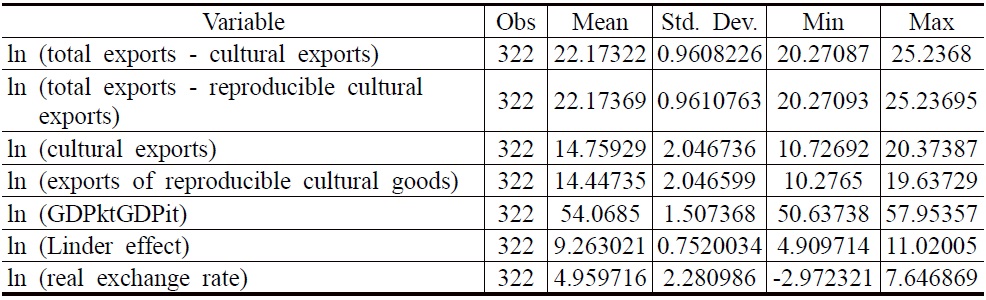
Summary of Statistics
4When using the theoretical gravity model of Anderson and van Wincoop (2003), multilateral resistances need to be taken into account. However, standard price indices (CPI, PPI, etc.) are not aggregated in the way implied by the theory, and can often be poor proxies for the ideal variables that the theory requires (Shepherd. 2010). Due to this problem, many studies have commonly added importer and exporter dummies to control multilateral resistance. However, Baldwin and Taglioni (2006) extended the multilateral resistance factor to be applied for panel data, and suggested country pair dummies as a better tool to deal with it. In this paper, country pair dummies take on the role of country dummies because Korea is the only exporter. 5A random effect model is also conducted, but not reported, because the Hausman tests show that random effect estimators are often not adequate. Shepherd (2010) points out that a fixed effect model is usually more adequate for gravity models. 6RTA is not included because the time span of Korea’s RTA with ASEAN is very short, and Korea’s RTAs with the US and the EU were not in force as of 2008. 7Disdier et al. (2007) also used PPML estimation due to the same reason. 823 countries are selected based upon the volume of Korea’s cultural exports to them. They have ranked most often among the 30 largest importers of Korean cultural goods during 1995-2008. Some countries, such as Luxembourg, Austria, Spain, Ireland and Pakistan, are omitted because their import volume of Korean cultural goods is minimal. As shown in Appendices 1 and 2, the 23 countries are China, Hong Kong, Indonesia, Japan, Malaysia, Philippines, Singapore, Thailand, Vietnam, Taiwan, India, Saudi Arabia, UAE, Australia, the United States, Canada, Mexico, France, Germany, Italy, Netherlands, Russia and the United Kingdom. 9HS is composed of chapter (2 digits: for example, HS 69 means ceramic products), heading (4 digits), sub-heading (6 digits), and 10 digits. The larger number of digits means the broader category of products.
Ⅲ. Results of Empirical Analyses
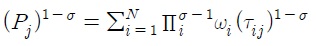
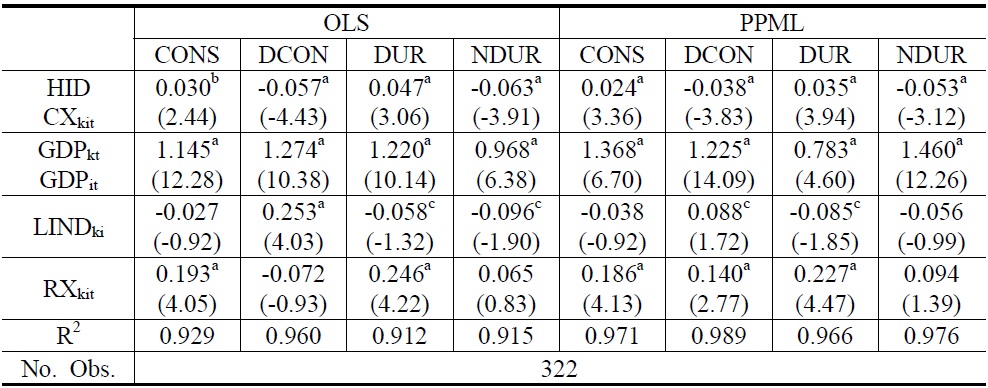
First, we aim to estimate the impact of Korea’s exports of cultural goods on its total exports. The results are shown in Table 3. Based on the OLS estimation, the coefficient of the log of total cultural exports is 0.039 significant at the 1% level, while that of the log of reproducible cultural exports is 0.038 significant at the 1% level. In both cases, one-year lagged variables are statistically significant, and coefficients of them are larger than those of current ones. The product of GDPs and the Linder effect show expected signs at a statistically significant level. The real exchange rates also show the expected positive sign. The same analyses were conducted with the PPML technique. Coefficients on both total cultural goods (0.047) and reproducible cultural goods (0.061) are larger than those from the OLS analysis. The coefficients of one year lagged exports of cultural goods (and reproducible cultural goods) are smaller than those of current cultural exports (and reproducible ones). These results are different from the OLS analysis.
In sum, Korea’s cultural exports have the impact of increasing its overall exports. A 100% increase of Korea’s cultural exports has the effect of increasing its total exports by 3.9-4.7%. The impact on reproducible cultural goods is a little higher at 3.8-6.1%. The sizes of coefficients estimated here are smaller than those (0.10-0.15) reported by Disdier
[Table 3] Impacts of Korea’s Cultural Exports on Total Exports

Impacts of Korea’s Cultural Exports on Total Exports
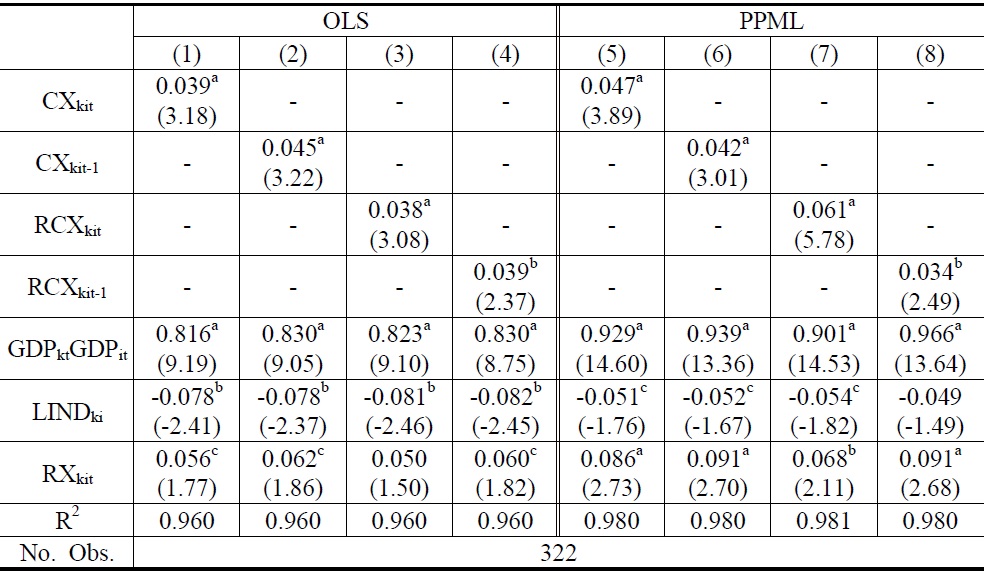
The effect of cultural exports on overall ones could be different due to the income level of importers. Because consumers in higher-income countries have more purchasing power than those in lower-income countries, the impact could be larger. Higher-income countries are defined as those having a year’s GDP per capita of more than $10,000; lower-income countries are those having a year’s GDP per capita of less than $10,000. With dummies to define both income levels (1 for higher-income countries [HID] and 0 for lower-income countries), interaction terms HIDCXkit and HIDRCXkit are constructed. As expected, effects of Korea’s exports of cultural goods on overall exports are larger for higher-income importers. The coefficients of HIDRCXkit are larger than those of HIDCXkit (Table 4).

Impacts of Korea’s Cultural Exports on Total Exports by Income Level of Importing Countries
Although exports of cultural goods make a positive impact on total exports, it might be different by category of products. Specifically, it is expected that exports of cultural goods would have a positive impact upon the demand for imported consumption goods (Disdier
In general, consumer goods are classified as durables and nondurables. Durable consumer goods provide a stream of utility
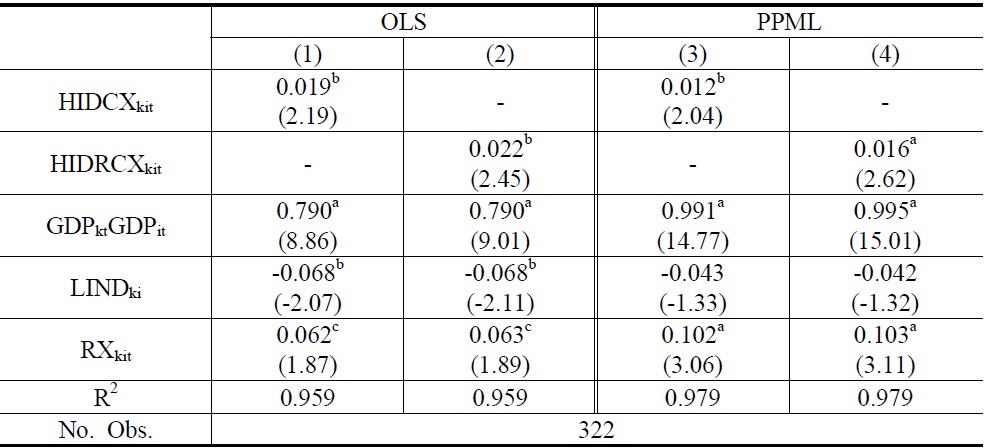
As shown in Table 5, exports of cultural goods have a positive impact upon nondurable consumption goods at the 1% significance level in both OLS and PPML analyses. Meanwhile, exports of cultural goods do not have a significant effect upon direct and durable consumption goods. As durable consumption goods are, in general, composed of high value added products such as mobile phones and other electronics, this result seems to mean that, in the case of Korea, the positive impact of cultural exports might be higher in exports of relatively lower value added consumption goods.
[Table 5] Impacts of Korea’s Cultural Exports on those of Consumer Goods

Impacts of Korea’s Cultural Exports on those of Consumer Goods
To see the effects of exports of cultural goods in detail, analyses based upon HS 2 digit codes were also conducted (See the results in Appendix 4). Because the focus is upon effects on consumer goods, some categories that are composed of intermediate and producers’ goods
To investigate which products among HS 84, 85, and 87 (they include some higher value added durable consumer goods, which are major export products of Korea) are affected by the exports of cultural goods, additional analyses on selected goods are performed as presented in Table 6. HS 8516 (electronic heaters), HS 8517 (telephone sets including mobile phones), and HS 8528 (television monitors and projectors) are positively influenced by exports of cultural goods.
[Table 6] Impacts of Korea’s Cultural Exports on those of Selected Goods
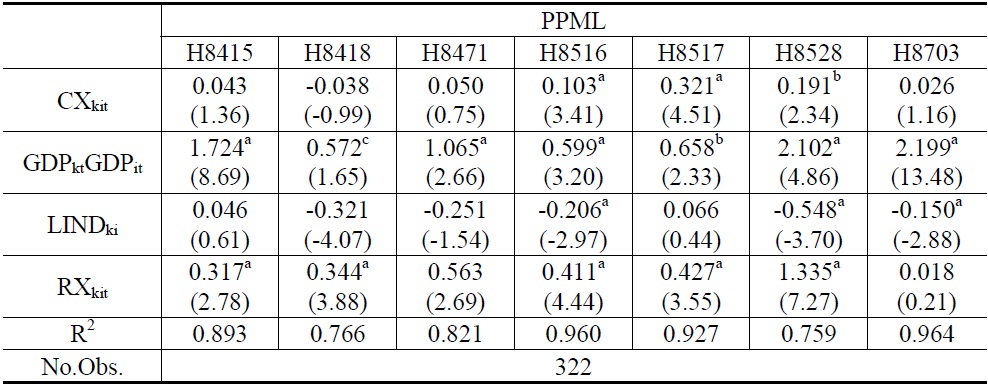
Impacts of Korea’s Cultural Exports on those of Selected Goods
The income level of the importing nations could also be an important factor. For example, lower-income countries might purchase relatively cheaper Korean nondurable goods, such as clothes. Countries with higher-income could buy relatively more expensive durable Korean-made consumer goods such as TVs. However, the opposite could also be possible—that consumers in higher-income nations are less attracted by Korean-made durable goods than those in lower-income countries. They may be less likely to purchase a Korean TV, even if they like Korean cultural goods, because they are already familiar with products imported from other countries (for example, Japan) or domestically-made ones. On the other hand, consumers in lower-income countries are relatively more attracted by Korean durable goods, because the Koreanmade products contain good images of Korea such as wealth, being in vogue, etc. The consumption of foreign durable goods is sometimes seen to be a symbol of the wealth of the consuming individual. For example, until the 1990s, owning a foreign car—especially those imported from Germany or the United States—was a status symbol in Korea.
Based on analyses reported in Table 7, the positive impact of cultural exports on those of consumer goods is larger in higher-income countries. In detail, the positive coefficients are estimated in durable goods, but negative signs are shown in direct and nondurable consumer goods. These results mean that the overall impact of Korea’s cultural exports is dependent upon the purchasing power (or income) of consumers in importing countries.

Impacts of Korea’s Cultural Exports on those of Consumer Goods by Income Level of Importing Countries
The other analyses, based on HS 2 digit codes, are also conducted. The impact on direct and nondurable goods (food and clothes) is larger for lower-income countries while the impact on automobiles (HS 87) is significantly larger for higher-income countries (See Appendix 5). Additional analyses are performed to investigate which products among HS 84, 85, and 87 are affected by the exports of cultural goods (see Table 8). Impacts of cultural exports on HS 8517 (telephone sets including mobile phones) and HS 8528 (TV monitors and projectors) are larger in lower-income countries, while the impact on HS 8703 (motor vehicles) is larger in higher-income countries.
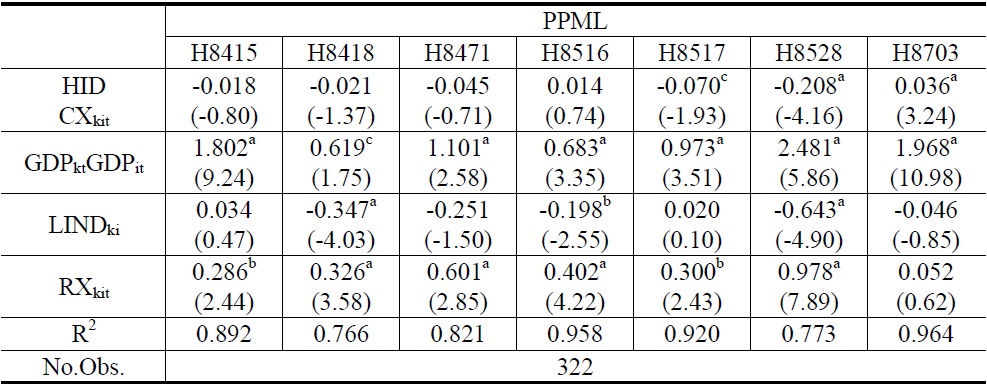
Impacts of Korea’s Cultural Exports on those of Selected Goods by Income Level of Importing Countries
The effect of exports of cultural goods on total exports can depend on the area to which the importing nation belongs. Here, it is assumed that the area of the importing nation is a factor that affects the magnitude of the effect of cultural exports on overall exports. With dummies to define countries in the Asian region (1 for countries in Asia: ASIA and 0 for non-Asian countries), interaction terms ASIACXkit and ASIARCXkit are used. Analyses here, reported in Table 9, show that countries belonging to Asia tend to react more positively to Korea’s cultural exports than the other countries. These results indicate that the impact of Korea’s cultural exports is larger among countries sharing the more similar cultural background.
[Table 9] Impacts of Korea’s Cultural Exports on Total Exports by Region
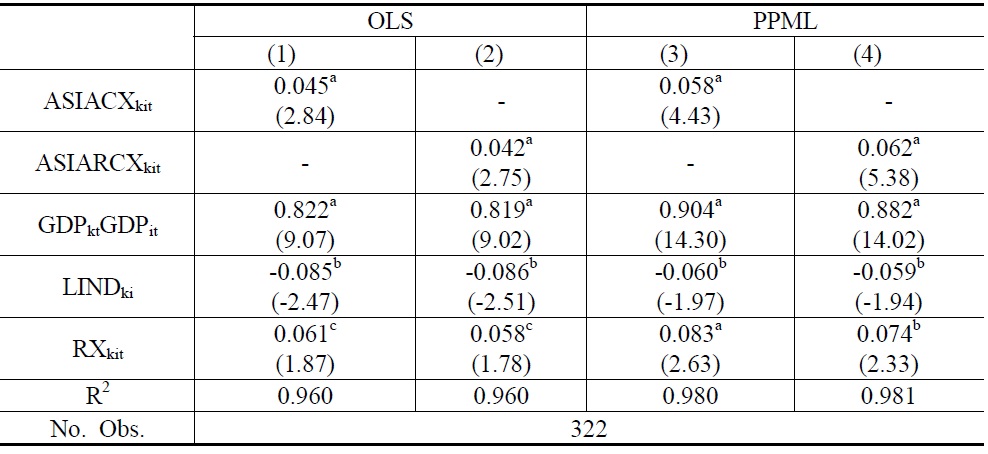
Impacts of Korea’s Cultural Exports on Total Exports by Region
10The impact of lagged exports of cultural goods was not proved in Disdier et al. (2007). 11Numerous researches in the field of international business have proved that the consumption of Korean cultural goods, Hallyu, improves Korea’s country image and this makes a positive impact on the preference for Korean goods (See Kim [2011] in detail). Armstrong and Kotler (1999) point out that when competing products or services are similar, buyers may perceive a difference based on company or brand image. Thus, companies should work to establish images that differentiate themselves from competitors. This notion is extended to the relationship between Korea’s country image and attitude towards Korean consumption goods. 12HS 07-09, 16-22, 30, 33-34, 42-43, 61-66, 69-70, 84-85, 87, 90-92, 94-97 are included in HS 2 digit analyses.
While the international trade of cultural goods has increased, Korea is becoming one of most active cultural exporters. It has been widely argued that exports of cultural goods have a positive impact upon overall exports, specifically, those of consumer goods. The main question of this paper is to find how Korea’s cultural exports influence its total exports. Stigler and Becker (1977) and Throsby (1999) suggest that cultural closeness is formed through the accumulation of cultural capital. Disdier
Using panel data of Korea’s exports (1995-2008) in cultural goods as a measure of cultural proximity, this research estimates their impacts on total exports. Using time-variant data of exports in cultural goods as an alternative for genetic cultural variables is most adequate in that the changing, accumulative nature of cultural proximity can be estimated. This empirical study includes both East Asian and non-East Asian countries as Korea’s trade partners. Moreover, various detailed analyses are also conducted.
First, empirical analyses show that a 100% increase of Korea’s cultural exports has the effect of increasing total exports by 3.9-4.7%. The impact on reproducible cultural goods is a little higher at 3.8-6.1%. The one-year lagged cultural exports of Korea also significantly affect the current total exports. In theoretical terms, these results validate using the exports of cultural goods as a proxy for cultural proximity. Second, the positive impact of cultural exports on total exports is larger in higher-income nations. This seems to be mainly due to the larger purchasing power of the consumers in those countries.
Third, the overall positive impact of Korea’s cultural exports seems to be concentrated in exports of relatively lower value added, nondurable consumer goods. However, in detail, exports of some durable goods, such as white electronics and vehicles, are also strongly influenced by the exports of cultural goods. Meanwhile, for higher-income countries, the positive effects are larger on exports of durable consumer goods, but, for lower-income countries, larger on those of nondurable goods. Fourth, Asian countries react more positively to Korean cultural exports than countries in other regions.
In terms of Korea’s trade policy on cultural goods, Korea should focus more upon higher income countries. As this study shows, the overall positive impact of Korea’s cultural exports is larger in higher income nations. Because they have higher purchasing power, the impact of cultural exports is more apparent in higher value-added durable goods. Although the impact of the exports of Korean cultural goods on overall exports is higher among Asian countries (whose income is generally low except for Japan, Taiwan and Singapore), the export destinations of Korean cultural goods should be diversified to non-Asian, higher income countries in order to increase the positive impact of cultural exports.