

This paper aims to establish a firm understanding of the structure and determinants of bilateral FDI investment linkages among APEC economies. Specifically, this paper first aims to analyze determinants of intra-APEC FDI flows so as to ascertain if and whether APEC members tend to invest more intensively intraregionally than extraregionally and, conversely, whether APEC economies receive more investments from other APEC members compared to extra-regional investments. This paper then aims to assess the impact on FDI flows of three different types of country risks - political, economic and financial risks - for the destination economy. This paper finds that the APEC member economies engage more intensively with each other in terms of FDI flows than what one might expect based on the general determinants of FDI flows. However, this conclusion does not hold once we incorporate bilateral exports, suggesting that the reason for the more intensive FDI engagement within APEC was largely due to the significant trade links between the member economies. More exports tend to promote bilateral FDI flows. This points to the complementary nature of FDI and trade in the APEC region. This paper also finds that economies with lower political risk appear to attract more FDI inflows. Thus, individual and regional efforts to improve the institutional quality of member economies are expected to contribute to increasing intra-regional FDI flows in the region. Other aspects, such as more stable political systems, improvements in socioeconomic conditions, reduction in corruption and enhancement of law and order, are all important objectives in and of themselves and will obviously contribute to greater FDI flows
APEC is a group of twenty one economies located in the Asia-Pacific region. With 2.7 billion people, APEC as a whole accounted for 40 percent of the world population of 6.6 billion people in 2007. The combined GDP of APEC was US$ 29.0 trillion in 2007, which accounted for over 53 percent of world GDP of US$ 54.6 trillion.
One of the important stylized facts concerning APEC is that many of its member economies are very dynamic in terms of economic growth. As seen in Table 1, between 2001 and 2007, the simple average of the per capita GDPs of twenty one member economies grew by 12.1 percent per annum, faster than the world average (9.5 percent). Trade expansion has been more dramatic. Between 2001 and 2007, the simple average of APEC’s total exports increased by 15.4 percent per annum, which is larger than the world average growth rate of 14.5 percent per annum.1
Expansion of foreign direct investment has also been very dramatic. Specifically, between 2001 and 2007, the values of inward holdings of foreign direct investment (FDI) stocks in the APEC region increased by 14.9 percent (simple average) or 12.8 percent (weighted average) per annum. The fast expansion of foreign direct investment is also evident globally.
Conventional theoretical models have predicted that international capital movement helps the economic growth of the destination and source economies alike, as it finances domestic investment in the destination economies while it helps maximize the efficient use of capital in the source economies. In particular, FDI can be a vehicle for technological progress in the destination economies through the use and dissemination of advanced production techniques.
Since its inception in 1989, APEC has striven to achieve the goals of “free and open trade and investment” in the APEC region. In particular, APEC’s investment liberalization and facilitation efforts have contributed to cross-bor-der investment between APEC economies. However, there has been little effort to examine the underlying nature, structure, and determinants of such financial linkages between member economies.2 Gaining a better understanding of these features of the linkages of financial markets in the APEC region will assist in identifying priorities for the post-APEC Investment Facilitation Action Plan (IFAP), and more broadly for future APEC agendas for regional economic integration (REI) and the goals of free and open trade and investment (FOTI).
[Table 1] Comparison of Inward Foreign Direct Investment and Goods Exports
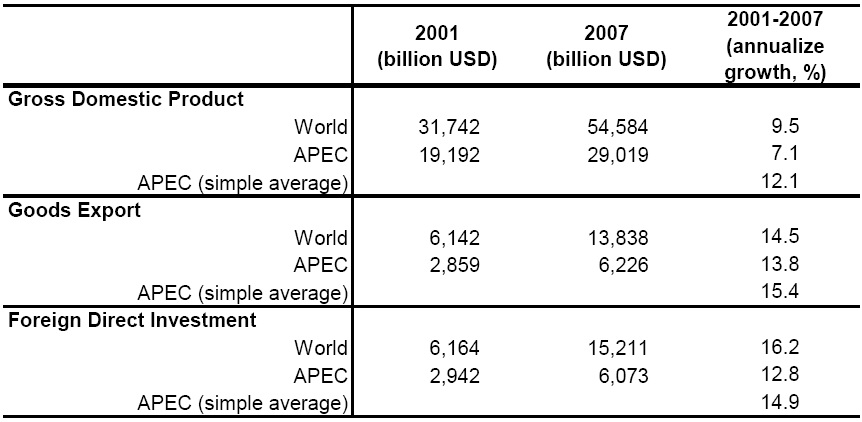
Comparison of Inward Foreign Direct Investment and Goods Exports
Despite the importance of FDI in APEC, there has been no major empirical research which attempts to assess the bilateral flows of FDI between APEC member economies. Against this background, this paper aims to establish a firm understanding of the structure and determinants of bilateral FDI investment linkages among APEC economies. Specifically, this paper aims to analyze determinants of intra-APEC FDI flows so as to ascertain if and whether APEC members tend to invest more intensively intraregionally than extraregionally and, conversely, whether APEC economies receive more investments from other APEC members compared to extra-regional investments.
We are also interested in assessing the importance of institutional variables in determining FDI flows. The link between institutional quality and crossborder capital movement deserves special attention, as such a link may be seen as one particular channel through which institutions are able to promote productivity growth (Acemoglu et al., 2005; Bénassy-Quéré et al., 2007). Indeed, good governance infrastructure exerts a positive influence on economic growth through the promotion of investment (domestic and foreign alike), while institutional underdevelopment is a key explanatory factor for the lack of foreign financing in developing economies.
It seems intuitively plausible to believe that a sound institutional environment, i.e. efficient bureaucracy, low corruption, and secure property rights should attract more FDI. Likewise, it is expected that high country risks, such as political risks, discourage FDI inflows. Nonetheless, according to a recent survey of the literature (Blonigen, 2005), evidence remains mixed. For instance, Asiedu (2002) concludes that neither political risk nor expropriation risk have any significant impact on FDI. Noorbaksh et al. (2001) also report that democracy and political risk are not significantly related to FDI. Recently, however, Ali et al. (2010) find that institutions are a robust predictor of FDI and that the most significant institutional aspects are linked to property rights. They also find that institutions have a significant impact on FDI in manufacturing and in services, but that institutional quality does not matter for FDI in the primary sector.3
Therefore, we aim to assess the impact on FDI flows involving APEC economies of three different types of country risks - political, economic and financial risks - for the destination economy, using indices sourced from the International Country Risk Group (ICRG) database constructed by Political Risk Services (PRS).4
For this purpose, this paper investigates trends and patterns of foreign direct investment (FDI) flows to and from APEC economies using bilateral FDI flows for the period of 1998-2007 for which consistent data are available. It then goes on to analyze determinants of intra-APEC FDI flows. Unlike trade flows, there has been little to no detailed examination of FDI flows between APEC economies at the bilateral level, especially with regard to developing member economies. The handful of papers that have examined FDI to selected Asian economies using bilateral data only consider FDI from OECD economies as the source since they use data from the OECD.5 In contrast, the focus of this paper is on intraregional FDI flows among both industrialised as well as developing APEC economies, thus making the coverage far more extensive and informative compared to other such studies. It is important to keep in mind that this study includes bilateral flows to and from many developing APEC economies including China, making its findings novel and potentially important.
The remainder of the paper is organized as follows. After outlining some data issues in Section 2, Section 3 discusses in some detail patterns and trends in intra-APEC FDI flows using bilateral net FDI flows over the period of 1998 to 2007. Section 4 employs an augmented gravity model framework to examine the main economic determinants of intra-APEC FDI flows. Regression results are reported in Section 5. The final section offers a few policy implications and concluding remarks. An important caveat is in order. The aim of this report is not to compare determinants of intra-APEC FDI flows with extra-regional flows. Rather, the specific focus of this report is on documenting the extent of intra-APEC FDI and exploring its determinants. We are also interested in ascertaining whether APEC members invest more intensively intraregionally than extraregionally. To the best of our knowledge, these issues have not been explored previously due to the lack of data.
1For more discussions on trade in the APEC region, readers are referred to Lee and Hur (2009), another APEC PSU report, entitled “Trade Creation in the APEC Region: Measurement of the Magnitude of and Changes in Intra-regional Trade since APEC’s Inception”. 2Recent research on APEC investment linkages has been carried out by Li and Qiu (2009), but this study focuses only on M&A-type FDI. 3On the other hand, Papaioannou (2009) shows that institutional quality/country risks are highly correlated with international bank lending, and Lee and Huh (2009) show that country risks also highly associated not only with international bank lending but also with portfolio investment. 4http://www.prsgroup.com/ 5A selective list of recent papers that use bilateral FDI data from the OECD, but are not specifically limited to Asia, are Bénassy-Quéré, Coupet and Mayer (2007), Daude and Stein (2004), Head and Ries (2008), Loungani, Mody and Razin (2002), Razin, Rubinstein and Sadka (2003), and Stein and Daude (2007).
Before proceeding with the analysis it is worth outlining some data issues and including a few words on the official definition of FDI and data sources to be used (Hattari and Rajan, 2009a). The most common definition of FDI is based on the OECD Benchmark Definition of FDI (3rd Edition, 1996) and IMF Balance of Payments Manual (5th Edition, 1993). According to this definition, FDI generally bears two broad characteristics. First, as a matter of convention, FDI involves a 10 percent threshold value of ownership.6 Second, FDI consists of both the initial transaction that creates (or liquidates) investments as well as subsequent transactions between the direct investor and the direct investment enterprises aimed at maintaining, expanding or reducing investments. More specifically, FDI is defined as consisting of three broad aspects, viz. new foreign equity flows (which is the foreign investor’s purchases of shares in an enterprise in a foreign economy), intra-company debt trans-actions (which refer to short-term or long-term borrowing and lending of funds including debt securities and trade credits between the parent company and its affiliates), and reinvested earnings (which comprises the investor’s share of earnings not distributed as dividends by affiliates or remitted to the source economy, but rather reinvested in the destination economy). New equity flows could either take the form of M&A of existing local enterprises or Greenfield investments.
For developing economies, the two most comprehensive databases on FDI inflows and outflows are the IMF-BOP Manual and UNCTAD (seeDuce (2003) for a comparison of the two sources). Neither source divides FDI into M&A versus Greenfield investments.7 UNCTAD in conjunction with the Economist Intelligence Unit (EIU)’s World Investment Services database by far has the most complete FDI database (millions of US dollars). Unlike the IMF-BOP data, the UNCTAD-EIU data is based on bilateral FDI flows -- both inflows and outflows. The data are on a net basis (capital transactions credits less debits between direct investors and their foreign affiliates) and are mainly sourced from national authorities (central banks or statistical offices).
Our time period is for the decade of 1998 to 2007. Of the twenty one APEC members, sixteen economies are included in our sample: Australia; Canada; China; Hong Kong, China; Indonesia; Japan; Korea; Malaysia; Mexico; New Zealand; the Philippines; Russia; Singapore; Thailand; the United States; and Viet Nam. For reasons of data availability or lack thereof, we exclude Chinese Taipei, Brunei Darussalam, Chile, Papua New Guinea, and Peru. Some data caveats should be noted.
First, one could analyze FDI data on either stocks (i.e. International Investment Positions) or flows (i.e. financial account transactions) data. While much empirical analysis to date has been undertaken using the former, changes in stocks could arise either because of net new flows or because of valuation changes and other adjustments (such write-offs, reclassifications, etc). To abstract from these valuation and other changes, we consider only data on flows of outward FDI (net decreases in assets or when a foreign economy invests in the economy in question) and inward FDI (net increases in liabilities or when the source economy invests abroad). In any event, we only have flows data available on a consistent time-series basis for many of the developing economies under consideration.
Second, bilateral flows data especially for developing economies are not very reliable or complete pre 1997. It is also noted that unlike other types of capital flows, FDI flows have been fairly durable during the financial crisis, and therefore inclusion of the Asian crisis period (1997-98) ought not to change the analyses. In any case, we use moving averages to understand trends in section 3.
Third, where possible and necessary we counter-checked some of the missing observations and outliers with national and OECD sources.8 In this regard, the most complete dataset we have available to us is for the sub-period 2000-05 which is what we use when we consider the empirical determinants of intra-APEC FDI flows in section 4.
Fourth, since there are many more gaps in the outflows data compared to the inflows data, we primarily use the latter. Thus, for instance, if we are interested in Korea’s flows to Singapore, rather than using Korea’s outflows data to Singapore we use Singapore’s inflows data from Korea.
Fifth, the FDI data from UNCTAD or other sources cannot be divided into Greeenfield versus Mergers and Acquisitions (M&As). The macroeconomic consequences of these types of FDI flows can vary significantly. M&A data, which tracks the actual ownership of purchases and sales (as opposed to flow of funds), are maintained by several private commercial entities such as the Bloomberg, Capital IQ, Dealogic, Thomson Financial, Zephyr, etc., (unlike the data on FDI flows, which is compiled by national sources). However, not all M&A data are necessarily FDI as conventionally defined.9
6This said, the 10 percent threshold is not always adhered to by all economies systematically. For a detailed overview of the FDI definitions and coverage in selected developing and developed economies, see IMF (2003). Also see Duce (2003). UNCTAD (2007) discusses data issues pertaining to FDI inflows to China. 7See UNCTAD (2006, pp.15-21) for a discussion of Greenfield versus M&As. Cross-border M&As in the past three years have been experiencing a surge. 8This was most notable in the case of Canada for which there were many missing observations in the EIU-UNCTAD database. Given Canada’s significance as a source and destination of FDI in APEC, we followed up on national and OECD sources for which stock data on Canada was available and converted the data to flows. 9See Hattari and Rajan (2009b) for an initial evaluation of cross-border M&As in selected Asian economies. This paper uses only cross-border M&As meeting the ten percent threshold. Li and Qiu (2009) also look at M&As in APEC, but do not appear to be sensitive to this threshold. In addition, the paper incorrectly takes the difference between total FDI flows and M&As and assumes the difference is Greenfield investments.
Ⅲ. Size And Extent Of Intra-Apec Fdi Flows
1. Aggregate Inflows to and Outflows from APEC
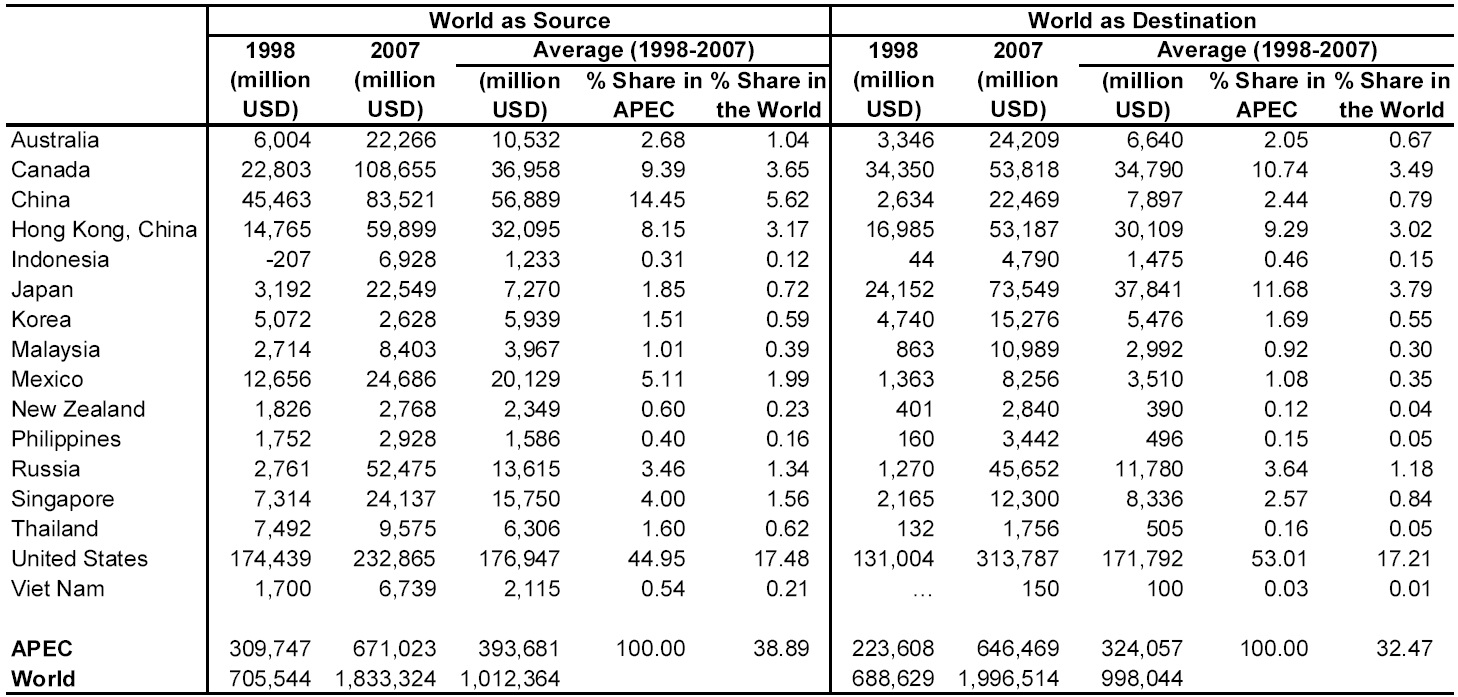
The FDI inflows to and outflows from the APEC member economies between 1998 and 2007 are shown in Table 2. As is evident, the APEC economies as a cluster are significant both as a destination and source of FDI. It is worth noting that on average over the ten year period under consideration the relative share of FDI inflows into APEC vis-à-vis the world stood at almost 40 percent. Similarly the relative share of FDI outflows from APEC vis-à-vis the world was over 30 percent. APEC’s FDI inflows have more than doubled over the ten year period under consideration. Specifically, FDI inflows into APEC have grown from about US$ 310 billion in 1998 to over US$ 670 billion in 2007. FDI outflows from APEC have also almost trebled from about US$ 220 billion in 1998 to over US$ 640 billion in 2007.
[Table 2] FDI Inflows and Outflows of APEC Economies
FDI Inflows and Outflows of APEC Economies
However it is important to note that there appears to be considerable heterogeneity within the APEC economies both in terms of the share and magnitude of FDI inflows and outflows. If one looks at the average shares of inflows to all the individual economies in APEC taken in our sample, there is clear dominance by the advanced industrialized economies like the United States and Canada as well as China and Hong Kong, China. These economies represent over 75 percent of the total average inflows into APEC. It is interesting to observe that with regard to the shares of FDI outflows from APEC, again it is almost the same set of economies that emerge as the dominant source economies, with only one notable exception. Japan finds its way to the top four replacing China. These four economies, namely the United States; Canada; Japan; and Hong Kong, China represent nearly 85 percent of global FDI outflows from APEC.
While it is undeniable that APEC as a grouping assumes an important role as both a destination and source of FDI inflows and outflows vis-à-vis the world, one needs to take a closer look at the trends in shares over the years to get a better idea of their dynamics. Given that flows data can be lumpy (as noted, stock data are not available), we compute three-year moving averages of the shares of APEC’s FDI inflows and outflows vis-à-vis the world.
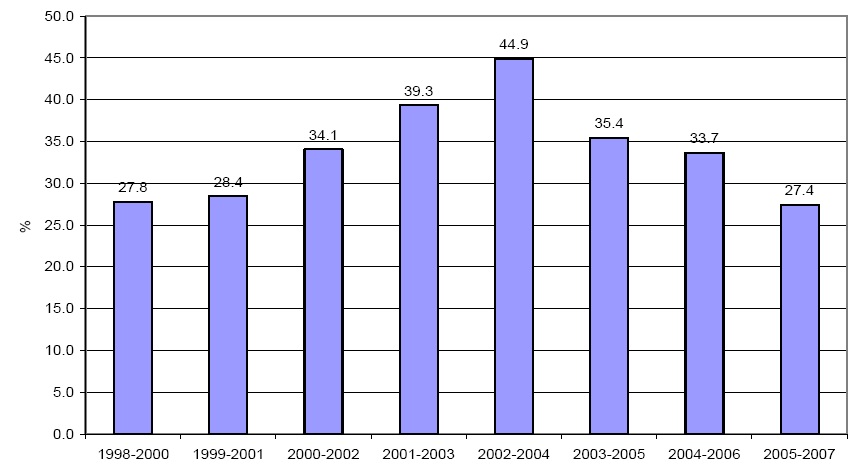
Figure 1 reveals that the average share of FDI inflows into APEC economies vis-à-vis the world decreased somewhat over the last decade from about 42 percent in 1998-2000 to 35 percent in 2005-07. However, it is important to note that this pattern is not uniform across all the years as we see spurts in inflows in 2004-05. On average, APEC members have constituted 40 percent of total global inflows over the decade under consideration. In the case of outflows, as apparent from Figure 2, the average share of FDI outflows from APEC vis-à-vis the world has been increasing over the years until 2002-04, peaking at 45 percent, after which it has been declining steadily, reaching 27 percent by 2005-08, the same level as a decade ago. On average, APEC members have constituted 30-35 percent of total global outflows.10
2. Intraregional APEC FDI Flows: Aggregate Shares
Having considered broad economy aggregate outflows and inflows to and from APEC, we analyze the bilateral FDI flows between the APEC economies. This exercise is far from straightforward. UNCTAD data on inflows and outflows do not match exactly (also see UNCTAD, 2006, Chapter 3 and Hattari and Rajan, 2009a). The FDI outflows data from source economies are incomplete for many economies. While some source economies have relatively complete data on outflows, others either have incomplete data or no data at all. Different reporting practices of FDI data create bilateral discrepancies between FDI flows reported by source and destination economies, and the differences can be quite large. For example, data on FDI flows to China as reported by the Chinese authorities and by the investing economies’ authorities differ by roughly US$ 30 billion in 2000, US$ 8 billion in 2001, and US$ 2 billion in 2002 (Hattari and Rajan, 2009a). Faced with these concerns, we draw inferences on FDI flows by examining FDI inflow data reported in the destination economies as they are more complete and are relatively available for all economies under consideration. In other words, we focus on the sources of inflows rather than destination of outflows. To keep the analysis manageable, we compute three year moving averages starting from 1998-2000 until 2005-07, rather than on an annual basis.12
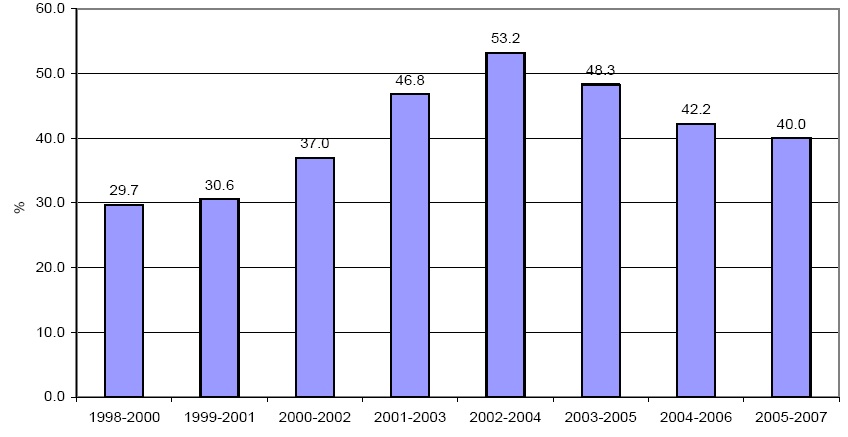
Figure 3 expresses the shares of intra-regional inflows in three year moving averages as noted earlier. The intra-regional shares have grown from an average share of about 30 percent in 1998-2000 to 40 percent in 2005-07, peaking at over 53 percent in the early 2000s before falling back to 40 percent.
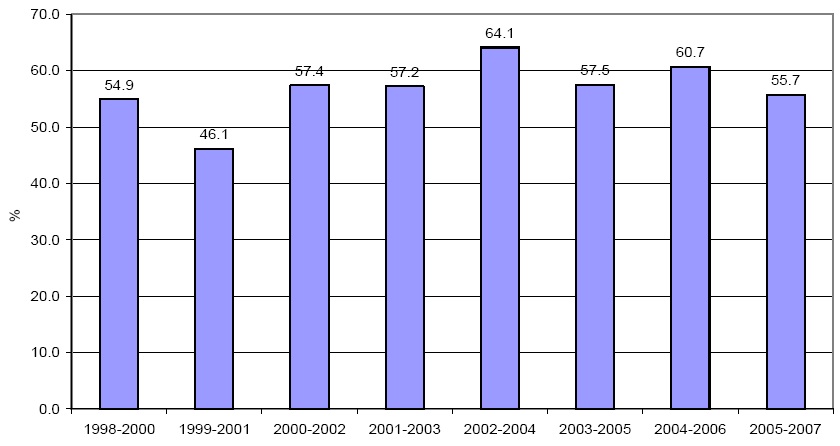
The three-year moving averages have been computed for the FDI outflows in Figure 4. In the case of FDI outflows, the average intra-APEC share over the decade of 1998 to 2007 has hovered around 55 to 60 percent. The share of intra-APEC outflows that stood at about 55 percent in 1998-2000 peaked at 64 percent in 2002-04 and settled at about 56 percent in 2005-07.
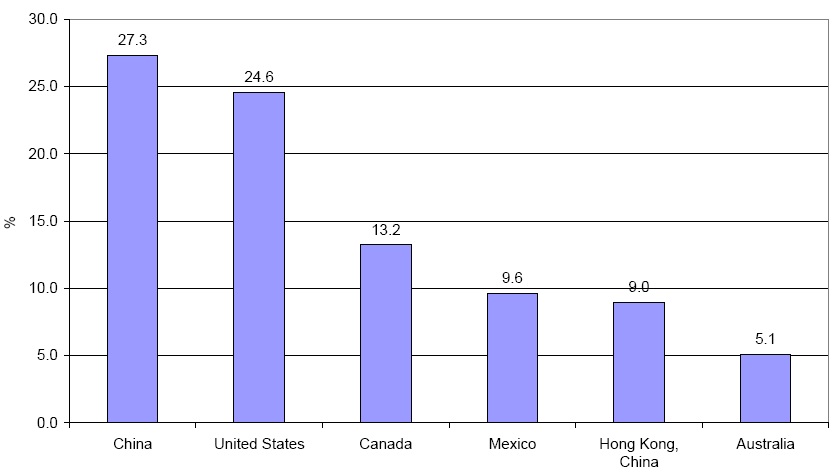
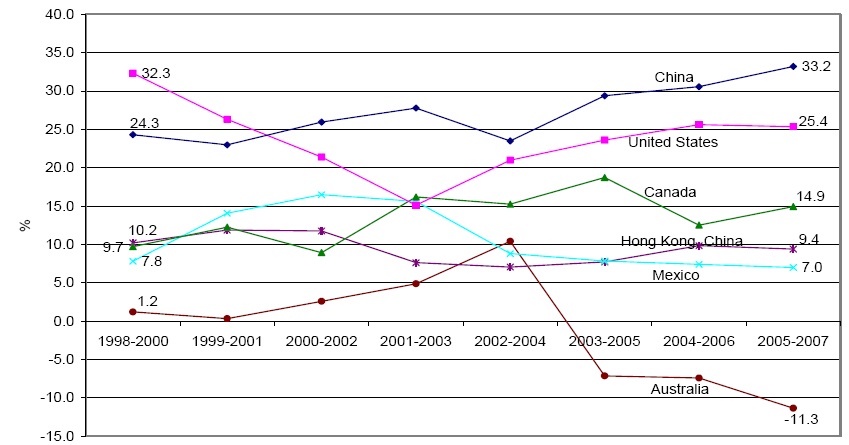
Focusing a bit deeper on the intra-APEC shares of both FDI inflows and outflows, we find that there are broadly five to six economies which clearly emerge as the largest sources and destinations of intraregional FDI. Figures 5a and 5b show the leading APEC destinations of intraregional FDI inflows during the period of 1998-2007. During the decade of 1998-2007, on average as figure 5a shows, China (27 percent) and the United States (25 percent) together hosted over half of the total intra-APEC inflows. The other significant destinations in the APEC grouping are Canada (13 percent); Mexico (10 percent); Hong Kong, China (9 percent); and Australia (5 percent). Considering the shares over the years, as reflected by the three-year moving averages in figure 5b, Australia has experienced a marked decline as a destination of FDI inflows from within the APEC post 2003-05 where we can see negative values (which indicate that Australia saw significant disinvestments during that period). Mexico too has experienced declines in the shares since 2001-03).13
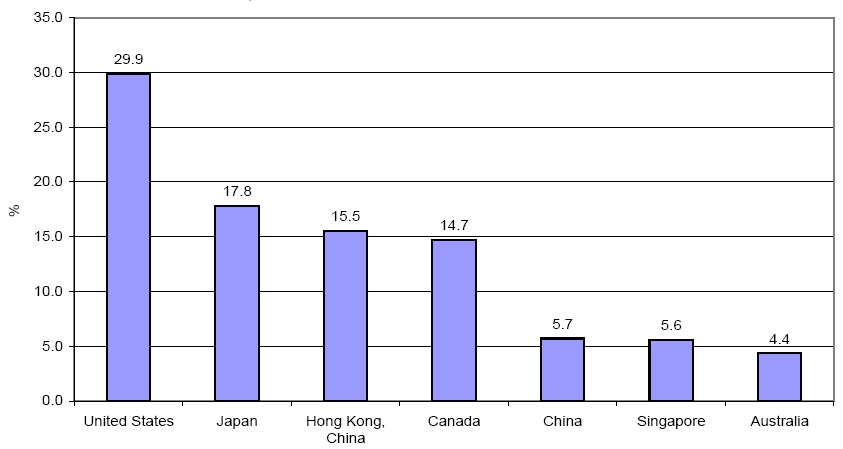
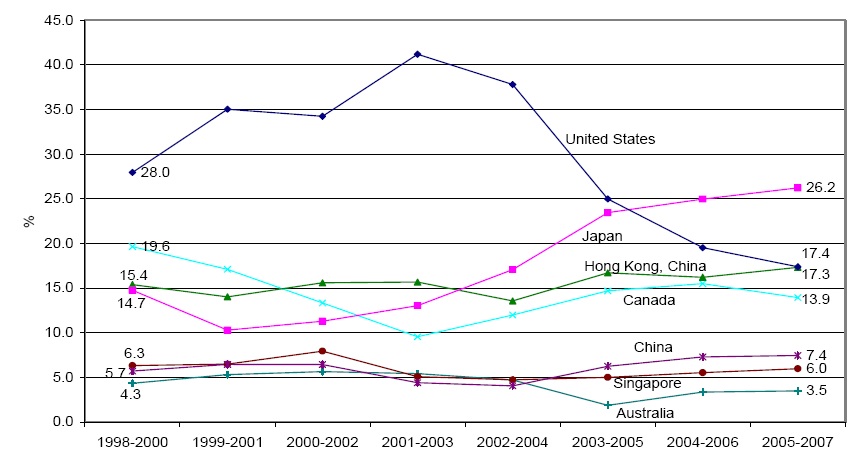
Figures 6a and 6b show the leading APEC source economies of intraregional FDI outflows. During the decade of 1998-07, as can be inferred from figure 6a, the United States continues to remain the single-most important source for foreign investments in the APEC region, with its contribution being one-third of intra-APEC outflows. The other key sources of outflows have been Japan; Hong Kong, China; and Canada (all with shares between 15 and 18 percent). The comparison over the years shows very little variation in the shares of most economies with the exception of Japan. Japan’s share as a source of intraregional outflows almost doubled from about 15 percent during 1998-2000 to about 26 percent during 2005-07 (as shown in figure 6b).14 It is also interesting to note that China’s share also increased from below 6 percent during 1998-2000 to over 7 percent during 2005-07. To understand where these outflows have been targeted, we need to focus on individual economy shares.
3. Intraregional APEC FDI Flows: Individual Economy Shares
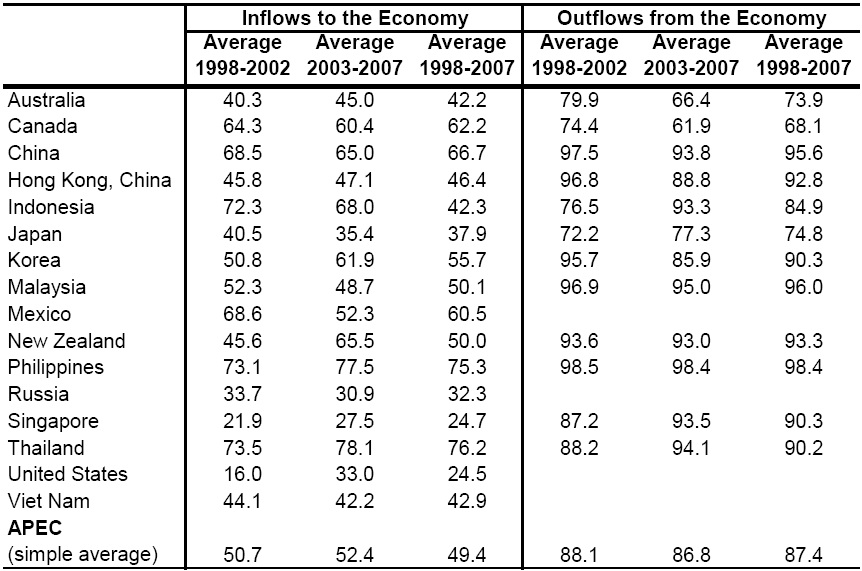
Since aggregate regional shares could hide significant economy variations between economies, we also examine data on intra-APEC flows for individual APEC economies. Some interesting patterns emerge from looking at Table 3 that shows the shares of intraregional FDI inflows into individual APEC economies.
With regard to FDI inflows, five economies, viz. Thailand; the Philippines; China; Canada; and Mexico, stand out from the rest of the APEC economies with exceptionally high shares of intraregional inflows compared to other APEC members. Specifically, while the intra-APEC shares of inflows (period average) exceed about 75 percent or more for Thailand and the Philippines, it stands at about 60 percent or more for the other three economies. The lowest share is in the case of the United States and Singapore, where only 25 percent of inflows into these economies are from other APEC member economies.15
[Table 3] Intra-Regional Share of FDI Flows in the World
Intra-Regional Share of FDI Flows in the World
Closer examination of the data reveals that the extremely high shares of intra-regional FDI inflows into some APEC economies like Mexico and Canada have primarily been because of inflows from their giant North American neighbor, the United States. The average inflows from the United States over the period of ten years under consideration have been consistently above 95 percent for Canada and 90 percent for Mexico. Similarly, if one looks at China, the numbers reveal that about 50 percent of inflows into the economy over the last decade from within the APEC region actually come from Hong Kong, China. Part of this is no doubt related to round-tripping (Hattari and Rajan, 2009a).16 New Zealand’s inflows are predominantly concentrated from its large neighbor, Australia (about 75 percent on an average). Inflows into the Philippines from within APEC have been dominated by Japan and the United States which together comprise about 80 percent of the total inflows from APEC into the economy. Japan and Singapore have been the main investors into Thailand with the two comprising a near 80 percent share in the total inflows to Thailand from the region on the whole.
The individual intra-regional FDI outflow shares of most of the member economies (with the notable exception of the United States) have been quite high as well. For instance, the average shares of intra-regional outflows from China; Hong Kong, China; Korea; Malaysia; New Zealand; the Philippines; Singapore; and Thailand have been consistently above 90 percent over the ten year period.
For other economies like Australia, Japan, and Canada, nearly 70 percent of their outflows flow to member APEC economies. However, in many cases, the flows are not spread evenly but are rather concentrated in specific members. To illustrate this point, let us just consider a few examples. Canada, for instance, directs nearly 60 percent of its outflows towards the United States. Thus, these two North American economies which dominate intra-APEC flows as discussed in Section 3.2 above are largely interacting predominantly with one another. Hong Kong, China and China are the other obvious examples. While nearly 60 percent of China’s outflows are directed towards Hong Kong, China, over 50 percent of Hong Kong, China’s outflows are targeted towards China. Australia is another case where nearly 95 percent of its FDI outflows are directed towards New Zealand. Thus, while intra-APEC flows are significant, in many cases the flows are concentrated between a few economy pairs rather than being evenly spread out across all members.
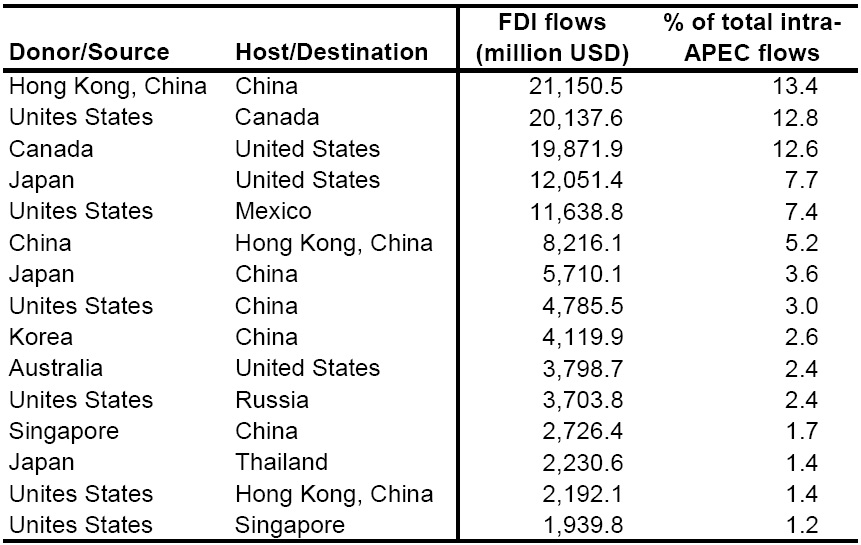
The foregoing trends seem to suggest that the intra-APEC flows are dominated by a few economies; they tend to be quite concentrated. In order to counter check this point, we compile the top 15 bilateral FDI flows between 1998 and 2007 and compute their share in the aggregate intra-APEC flows.17 As shown in Table 4, it is apparent that the United States; Canada; China; Hong Kong, China; and Japan prominently figure as the leading sources and destinations for bilateral FDI flows within APEC. Hong Kong, China’s flows to China (and vice versa) and the flows from the United States to Canada (and vice versa) are among the top five intra-APEC bilateral FDI flows, together constituting over two-fifths of total intra-APEC flows between 1998 and 2007. Apart from these, Japan’s flows to the United States (8 percent), flows from the United States to Mexico (7 percent), and Japan’s flows to China (about 4 percent) are the other significant intra-APEC flows. These six sets of bilateral flows made up over half of intra-APEC FDI flows for the period under consideration.
[Table 4] Top 15 Bilateral FDI Flows in the APEC Region (Average 1998-2007)
Top 15 Bilateral FDI Flows in the APEC Region (Average 1998-2007)
Two important data caveats should be kept in mind in the case of FDI flows. First, the FDI data are based on flow of funds as opposed to economy of ownership. Why does this matter? Apart from concerns about round-tripping (China-Hong Kong, China most notably but other instances as well), there are significant concerns about trans-shipping. The above intra-APEC data excludes offshore financial centers (OFCs) such as the British Virgin Islands (BVI), Bermuda, Cayman Islands, Mauritius, and Western Samoa as sources of FDI. Insofar as at least some part of inflows from the OFCs involve FDI that originated from other APEC economies and the inflows are not destined back to the originating economy (i.e. trans-shipping as opposed to round-tripping), we may be undercounting the size of intra-APEC FDI flows.18
10How much of these outflows were to other APEC members versus non-members? This issue is examined later in Section 3.2. 11Sources for all Figures 2.1 to 2.5: based on data from UNCTAD FDI/TNC and EIU World Investment Services Databases. 12It is instructive to note that the top destinations of FDI using data based on FDI inflows data in the destination economy and FDI outflows data from the source economy have stayed roughly the same during the period under consideration. 13A closer look at the raw data reveals that Australia’s sudden decline was due to a heavy outflow to the United States in 2005. Mexico’s sharp decline in intra-APEC inflows was a combination of huge FDI outflows to Japan during the year 2004 and a simultaneous increase in inflows from Spain (non-APEC). These affected the averages significantly. 14This appears largely because of a significant increase in outflows to the United States in the second sub-period. 15The Netherlands, Germany and the UK are the major non-APEC sources of FDI to Singapore. 16Japan, Singapore, and the United States being the other notable sources of FDI inflows into China. 17The results are largely consistent for individual years as well. 18For instance, the BVI have consistently been the second largest source of FDI into China, surpassed only by Hong Kong, China, with the Cayman Islands and Western Samoa also being among the top 10 investors in recent years.
Ⅳ. Determinants Of Fdi Flows: Model And Data
This section undertakes an empirical investigation of some of the possible determinants of FDI flows to and from the APEC economies for the period 2000-2005. We use this sub-period as the data are most complete for these years.
Our aim is to develop a relatively parsimonious model that includes specific bilateral variables as well as selected destination economy policy variables. In view of this, we follow the basic gravity-type framework which argues that market size and distance are important determinants in the choice of the location of source economies for direct investments. The theoretical basis for the gravity model of FDI has been proposed by Head and Ries (2008). A competing model is the capital-knowledge model of multinational activity developed by Carr, Markusen, and Maskus (CMM) (2001), which is arguably more appropriate if one uses FDI stock data. In addition, some of the variables required to operationalize the CMM model are not easily available for smaller developing Asian economies. We therefore use an augmented gravity model based on Head and Ries (2008), which we discuss below.
The basic specification of our estimated model is outlined below:
where:
We assume the coefficients of the real GDP of the source and destination economies to both be positive as they proxy for important masses in gravity models. A destination economy that has a large market often tends to attract more FDI. The coefficient of the source economy size could either be negative or positive. While large real GDP indicates greater aggregate income and/or more companies, and therefore higher ability to invest abroad, small real GDP in the source implies limited market size and consequent desire by companies to expand their operations overseas in order to gain market share. The signs for common language, common border and common culture ought all to be positive, while the sign for distance from the source to the destination economy should be negative, as greater distance between economies makes a foreign operation more difficult and expensive to supervise and might therefore discourage FDI.19
We augment our baseline gravity model with measures of financial and trade openness of the source and destination economies, the broad hypotheses being that the more open the economies the greater the extent of cross-border FDI flows in general. We use measures of international capital markets and trade restrictions from the Economic Freedom of the World published by the Fraser Institute.20 Higher index placement indicates more liberal trade and financial regimes. We also include a bilateral FTA as it is commonly believed that FTAs tend to stimulate FDI flows (for instance, see Yeyati, Stein and Daude, 2002). We examine this linkage by including dummies for operational bilateral trade agreements between the destination and source. We also hypothesize that the change in the real exchange rate should have a negative sign as a real exchange rate depreciation of the destination economy should raise FDI flows from the source economy (due to the wealth effects). However, there are other channels that could lead to ambiguity of the signage (Cushman, 1985). For example, as will be discussed below if there is a high positive relationship between FDI and exports, a real exchange depreciation of the destination economy can increase its exports and may reduce FDI flows from the source economy.
where, in addition to equation (4.1) above:
Equation (4.2) is our baseline model (Model 1).
3. Extended Model ? Effects of APEC Membership
We are also interested in ascertaining if and whether APEC members tend to invest more intensively intraregionally than extraregionally and, conversely, whether APEC economies receive more investments from other APEC members compared to extra-regional investments. To this end, we include an intra-APEC dummy as well as an intra-Euro dummy (Model 2).21
We then add a measure of trade (exports) given the close trade-FDI links. There may be issues of reverse causality between FDI and exports so we lag-ged exports by one period (Model 3).22
Finally, given the prominence of the United States in intra-APEC flows, we replaced the APEC dummy with an APEC-no US dummy (Model 4).
4. Extended Model ? Effects of Country Risk
Many researchers have stressed the importance of institutional variables in FDI flows in determining FDI flows.23 In view of this, we include a Country Risk Index for the destination economy, broadly reflecting various political, economic and financial risks, including institutional quality (22 variables in total). This index is sourced from the International Country Risk Group (ICRG) database constructed by Political Risk Services (PRS).24 It ranges from zero to one hundred. The higher the index the higher is the overall institutional quality and lower is the country risk. We extend our benchmark model (4.3) by adding a country risk variable in the outward investment equation, as follows:
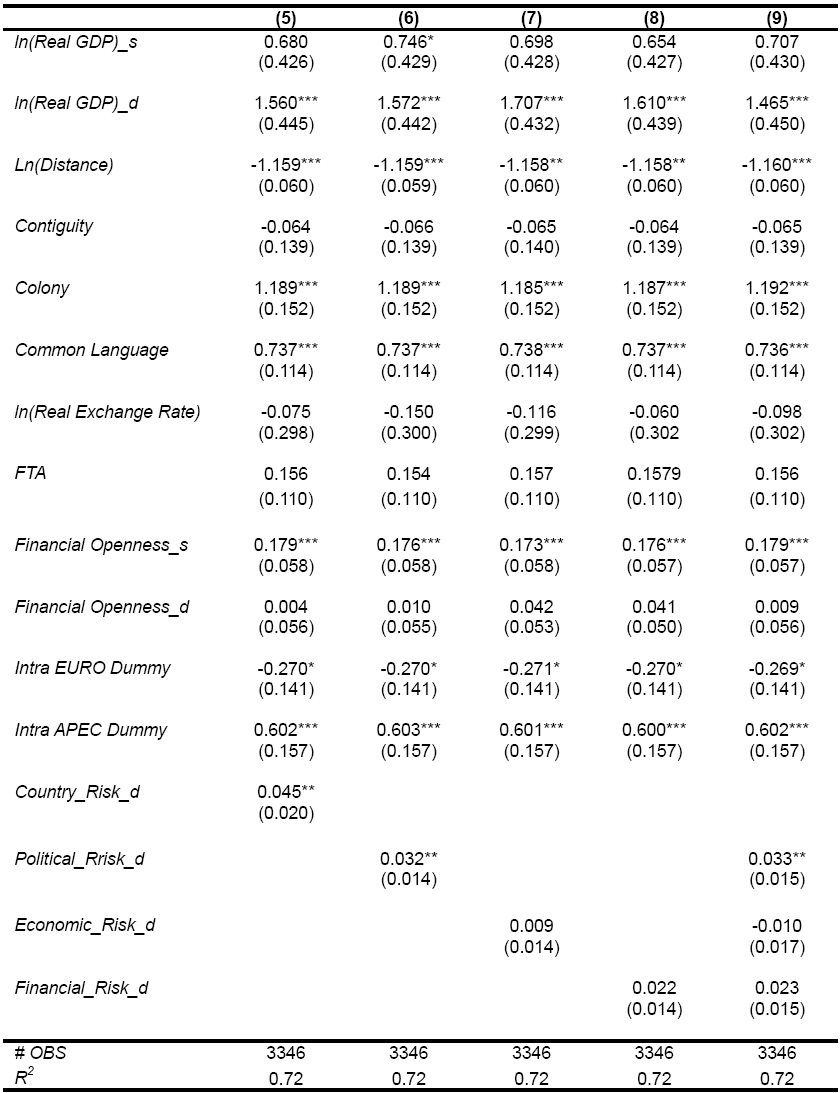
In the regression analysis, the composite country risk variable, Country_risk, will be used in Equation (4.5) (Model 5). Specifically, Country_riskjt is the country risk factor for economy j which is a combination of political, economic, and financial risks constructed by Political Risk Services (PRS) and published as the International Country Risk Guide (ICRG) rating. We then substitute the Country_risk indicator, where each of the three subcategories of risk will be used alternatively, noting that there is a significant correlation between political, economic, and financial risk, respectively (Model 6, Model 7 and Model 8, respectively). Finally, we include the three subcategories of risk concurrently so as to assess what type of risk matters the most in cross-bor-der investment (Model 9). For the sake of comparison, the original indices of economic risk and financial risk are multiplied by two, so that each of these three measures ranges from zero to one hundred.
The data sources that are used are included in the Appendix. The FDI data are based on the UNCTAD FDI/TNC and EIU’s World Investment Service databases in millions of US dollars. Following Hattari and Rajan (2009a), we deflate the FDI data by using the 1996 US consumer price index (CPI) for urban consumers. Data for real GDP and real GDP per capita are taken from the World Bank’s World Development Indicators database. Data on distance, common official language and common border are all taken from the CEPII.25 All trade data are based on the International Monetary Fund’s (IMF) Direction of Trade and Statistics (DOTS) database (although the data are limited to merchandise trade). We also deflate our bilateral trade data using the 1996 US CPI for urban consumers. The country risk variable is from ICRG as mentioned and the trade and financial liberalization are from the Economic Freedom of the World (EFW) index published annually by the Fraser Institute. The real exchange rate is the bilateral exchange rate per unit of destination economy currency adjusted by relative consumer price indices.
Our sample is based on an unbalanced panel dataset consisting of 60 source economies and 60 destination economies between 2000 2005. Given the lumpiness in the data, we use two-year averages rather than annual flows. The dataset contains a large number of missing observations for bilateral FDI (roughly one-third of the total observations) and 10 percent of disinvestment figures shown in the data as negative. Excluding missing and negative observations, our panel consists of over 3,100 observations.
In all of our estimations, we deal with the issue of censored data using the Tobit model, a commonly used approach to dealing with censored data (for instance see Stein and Daude (2007); and Loungani, Mody, and Razin (2002)) We follow di Giovanni (2005) by computing a Tobit model using the two-step procedure: first, a probit model is estimated based on whether a deal is observed to be conditional or not on the same right-hand variables as in equation (1), and the inverse Mills’ ratio is constructed from the predicted values of the model. Second, a regression is run to estimate equation (1) including the inverse Mills ratio as a regressor.26
19However, if the foreign firm is looking to service the destination economy’s market, a longer distance also makes exporting from source economies more expensive and might therefore make local production more desirable and encourage investment. This argument is not unlike the tariff-jumping one. 20See http://www.freetheworld.com/. 21We also tried an EU dummy rather than the Euro dummy. Results were largely unaltered. 22There are other ways of dealing with the endogeneity of exports, but it is not clear that those change the results significantly in the case of FDI. 23For instance, see Anghel (2005), Bénassy-Quéré et al. (2007), and Daude and Stein (2004) 24http://www.prsgroup.com/ 25http://www.cepii.fr/ 26The standard errors are corrected for heteroskedasticity and we use an estimated parameter of an exogenous variable (the inverse Mills’ ratio) in the second stage. See di Giovanni (2005) for details.
We start with the baseline gravity regression (Model 1). We then include the dummy interaction terms in order to differentiate between intra-APEC flows versus other flows (Model 2). After that we go on to add the bilateral export variable between the destination and source as discussed (Model 3). We then replace the APEC dummy with the APEC-no US dummy (Model 4). Finally, we examined the impact of various types of risks on FDI flows (Models 5 to 9).
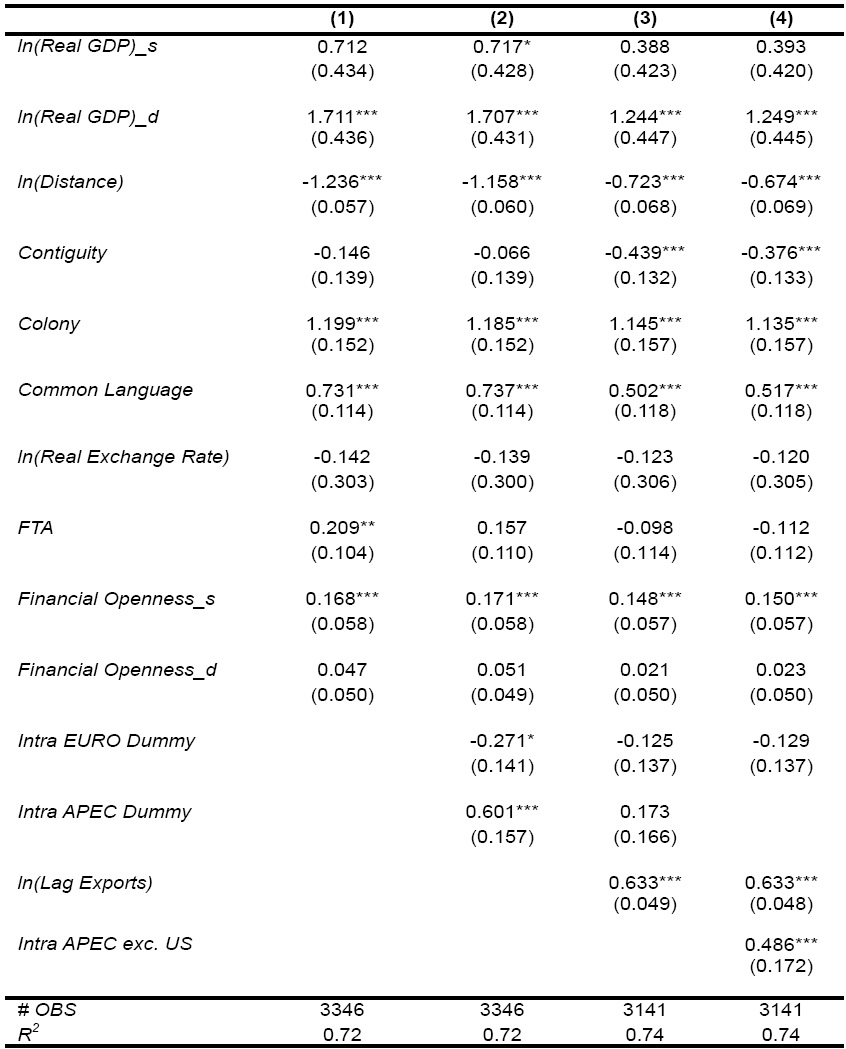
Table 5 summarizes the results. Our baseline model (Model 1) fits the data well, with goodness-of-fit of over 0.7. It suggests that larger economies receive greater volumes of FDI and this result is statistically significant. Specifically, it suggests that a 10 percent increase in the GDP of a destination economy will increase FDI flows to the economy by about 17 percent. On the other hand, the coefficient of the source economy, while positive, is statistically insignificant. This result is not completely unexpected, as major source economies such as the United States; Japan; and China, and smaller source economies such as Hong Kong, China; and Singapore are both major sources of FDI to the region. 27 Greater distance between the destination and source economy appears to hinder bilateral FDI and this result is strongly significant, with the distance elasticity at about -1.2.
Possessing a common official language is positively associated with increased FDI inflows, and this result is economically and statistically significant. That is, any economy pair sharing the same official language enjoys more than twice (i.e. 107% more) the FDI flows between themselves than with other economies.28 Sharing a common border does not seem to have a significant impact on bilateral FDI flows. A former colony appears to attract more FDI inflows, suggesting history matters. Real currency appreciation in the destination economy does not appear have any statistical or economic significance. Greater trade liberalization in the source and destination does not appear to have much impact on FDI flows.
[Table 5] Determinants of Bilateral FDI Flows
Determinants of Bilateral FDI Flows
An operational FTA has a positive and statistically significant impact on bilateral FDI flows. Financial liberalization in the source economy appears to promote outward FDI, though somewhat surprisingly, financial liberalization in the destination economy appears to have no discernible impact on FDI inflows.
2. Results for Extended Model: Effects of APEC Membership
We go on to add the intra-APEC and intra-Euro dummies (Model 2). The results remain consistent with the baseline regression with the exception of the bilateral FTA dummy which loses statistical significance while the source economy market size becomes weakly statistically significant. Somewhat paradoxically the Euro effect is negative and weakly statistically significant.29
More interestingly, the intra-APEC dummy is strongly positive and statistically significant, suggesting that the APEC region is closely interlinked in terms of FDI flows. Specifically, the coefficient of 0.601 on the APEC membership dummy illustrates that the APEC members enjoy 82 percent (or 1.8 times) more FDI flows among themselves than with non-APEC member economies. In a complementary project report of the APEC Policy Support Unit, Lee and Hur (2009) report that the estimated coefficient for APEC membership in the equation for total exports of goods is 1.02, suggesting that on average, an APEC member economy exports 177 percent (or 2.8 times) more to other APEC member economies than to non-APEC member economies, while the effect of APEC membership on total imports is 0.62, implying that on average, an APEC economy imports 86 percent (1.9 times) more from other APEC member economies, compared to imports from non-APEC member economies. Thus, the APEC membership effect on FDI flows is smaller than that on total exports, but similar to that on total imports.
We next added lagged bilateral export (in logs) (Model 3). This variable is strongly statistically and economically significant, suggesting that more exports tend to promote bilateral FDI flows. This points to the complementary nature of FDI and trade in APEC. This could be because FDI is export-oriented, or greater exports increase familiarity with an economy, hence stimulating FDI inflows as well. The inclusion of lagged exports also causes some changes in the other coefficients. First, perhaps, most importantly, the intra-APEC dummy now becomes economically and statistically insignificant, suggesting that the reason for the more intensive FDI engagement within APEC was largely due to significant trade links between the member economies.
This finding is in parallel with the findings of a related report for portfolio investment and bank lending by the APEC Policy Support Unit. Lee and Huh (2009) find that the inclusion of the bilateral goods trade intensity variable in the gravity model reduces the size of the coefficient for the APEC membership dummy. Thus, we have strong evidence that that the cross-border capital movement, in terms of FDI, portfolio investment and bank lending, is largely due to strong linkages of intra-regional trade in the region. This implies that the financial market in the APEC region as a whole is not as fully integrated as the goods market, even though the continuing expansion of intra-regional trade in goods in the region is expected to contribute to the intra-regional financial transactions in the region.
Second, the distance elasticity declines somewhat (from 1.2 to 0.7 in absolute terms) but remains strongly significant, suggesting that more bilateral exports may facilitate FDI by reducing the informational barriers that could otherwise hinder cross-border investments. Third, the elasticity of the destination economy size (GDP) declines (from 1.7 to 1.2) but remains significant, suggesting that intra-APEC FDI flows may be somewhat more export-oriented rather than aimed at domestic markets. Fourth, the contiguity dummy becomes statistically significant, but is negative in signage. The other results go through as before.
When we exclude the US from the intra-APEC dummy, it now becomes statistically and economically significant, implying the APEC members, excluding the United States, undertake more bilateral FDI flows than might be explained by other factors even after accounting for bilateral trade flows. Other results remain unchanged from Model 4.
3. Extended Model: Effects of Country Risk
Our aim in this section is to ascertain if the destination country risk impact FDI flows and why (i.e. what kind of risks). The results are summarized in Table 6.
We start by first including the overall composite country risk rating for the destination (Model 5). This variable is economically and statistically significant with the correct, i.e. positive, sign (higher index value means lower risk). Specifically, we find that the coefficient on the composite country risk index is 0.045 and significant at the 5 percent level. This estimate implies that a 10-point reduction in the country risk index of a destination economy is associated with a 4.5 percent increase in FDI flows to the economy. All other variables remained intact. Clearly, destination country risk ratings matter. But what kinds of risks matter -- political, economic or financial?
To investigate this we replaced the composite index with the individual components (first political risk, then economic risk, then financial risk (Models 6, 7 and 8, respectively). The political risk (Pol_risk) rating aims to assess the political stability of the economies. It is comprised of the following 12 components: government stability, socioeconomic conditions, investment profile, internal conflict, external conflict, corruption, military in politics, religious tensions, law and order, ethnic tensions, democratic tensions, democratic accountability and bureaucracy quality. As is apparent, the political risk index is statistically and economically significant. That is, the coefficient on the political risk index is 0.032 and significant at the 5 percent level. This estimate implies that a 10-point reduction in the political risk index of a destination economy is associated with a 3.2 percent increase in FDI flows to the economy.
[Table 6] Determinants of Bilateral FDI Flows: Impact of Country Risk
Determinants of Bilateral FDI Flows: Impact of Country Risk
We then replaced the political risk index with the economic risk (Econ_risk) rating to assess an economy’s current economic strengths and weaknesses. It is comprised of the following five components: per capita GDP, real GDP growth, annual inflation rate, budget balance as a percentage of GDP, and current account as a percentage of GDP. As is clear from Table 6, this index is statistically insignificant.
We also replaced the economic risk rating with financial rating (Fin_risk) which aims to provide a means of assessing an economy’s ability to pay its way. It is comprised of the following five components: foreign debt as a percentage of GDP, foreign debt services as a percentage of exports and goods and services, current account as a percentage of exports of goods and services, net international liquidity as months of import cover, exchange rate stability. Once again the index was statistically insignificant.30
The foregoing suggests that the most important dimension of country risk is political risk which includes law and order and institutional quality. As a counter-check we included all three risk components simultaneously. Only the political risk rating is statistically significant, reinforcing the above conclusion.31
We undertook a number of robustness checks starting with the baseline model noted above.32
First, we used three-year averages instead of two-year averages and found that the results are not materially different.
Second, given the importance of the China-Hong Kong, China bilateral FDI flows, and the likelihood that a large part of that may be round-tripping, we re-estimated the regression by including a China-Hong Kong, China dummy. This dummy was statistically and economically insignificant and has no impact on other estimated coefficients.
Third, we also replaced the trade liberalization measure with trade-to-GDP ratios and the financial liberalization measure with another popular measure of de jure openness, viz. the Chinn-Ito index (see Ito and Chinn, 2007).33 The results remained unchanged.
Fourth, we removed the FTA variable since it was statistically and economically significant. The results again remained unchanged.
Therefore, overall the results are robust.
27To find out this more explicitly, we also included real GDP per capita and population in place of real GDP and found a positive coefficient for real GDP per capital and a negative coefficient for population. The results are available from the authors upon request. 28It is calculated as 107% = (exp(0.731)-1)*100. 29This result is robust even if we replace the dummy with one that includes the entire EU. 30As political risk, economic risk and financial risk ratings are composite indices, it would be interesting to assess each component of the risk ratings. The present study does not attempt to do this due to the constraint of the length of the paper. Those who are interested in this are referred to Hayakawa, Kimura and Lee (2011). 31However, inclusion of all three sub-components simultaneously should be treated with a degree of caution in view of the high degree of correlations between them. 32Since the results are highly robust and similar to the baseline model, for parsimony we did not list the regression results here. 33We normalized the Chinn-Ito index from 0 to 100. Other measures of financial / capital account openness do not change results much. The Chinn-Ito index has become the preferred measure of financial openness in much of the literature
This study has been one of the first to examine trends and patterns of bilateral FDI flows with APEC economies, including developing ones. Most other studies have either just focused on aggregate flows, or only examined bilateral flows involving the more industrialised APEC economies. This study considers both developing and industrialised APEC members, making it far more comprehensive in coverage.
The data indicates that around 40 percent of FDI inflows to APEC members have come from within the region, and there is evidence that this share has been rising over the last decade. About 60 percent of APEC’s FDI outflows have been channeled to member economies, and this share, while high, appears to have been quite steady over the last decade.
Clearly some of these flows are overstated as they involve recycling or round-tripping of funds (especially between China and Hong Kong, China). Against this, trans-shipping from offshore financial centers have not been included, implying some underestimation of flows. Apart from China-Hong Kong, China; Canada-United States bilateral flows tend to dominate intra-APEC flows. These two sets of bilateral flows constitute above 40 percent of intra-APEC FDI flows. The United States; Canada; Japan; and Hong Kong, China are together responsible for 75 percent of intra-APEC outflows, while the United States; Canada; China; and Mexico constitute 75 percent of intra-APEC FDI inflows. This heavy concentration of FDI flows within APEC is a relatively under-appreciated fact. This suggests that there is significant potential for enhancing intra-APEC flows by focusing on member economies which have relatively under-developed cross-border links. But how?
Distance and the commonality of language seem to be strongly associated with bilateral FDI flows. Distance and language are proxies for information asymmetries, and hence efforts to share more information among APEC member economies are expected to strengthen the investment linkages in the APEC region. While relatively little can be done about physical distance (beyond improving transportation channels), APEC economic policymakers can facilitate intraregional investment flows by investing in superior telecommunications capabilities and other trade and investment facilitations measures to boost cross-border informational flows so as to reduce transactions costs.
More interestingly, the intra-APEC dummy is strongly positive and statistically significant, suggesting that the APEC region is closely interlinked in terms of FDI flows. Specifically, the coefficient of 0.601 on the APEC membership dummy illustrates that APEC members enjoy 82 percent (or 1.8 times) more FDI flows among themselves than with non-APEC member economies. However, the inclusion of lagged exports in the regression equation causes the intra-APEC dummy to become economically and statistically insignificant.
This finding suggests that the reason for the more intensive FDI engagement with APEC was largely due to significant trade links between the member economies. More exports tend to promote bilateral FDI flows. This complementarity between trade and FDI may either be reflective of the vertical segmentation of production and trade in APEC (especially within East Asia), or that exports tend to be the initial mode of entry into a foreign market followed by greater FDI. In other words, greater exports bring with them more information and understanding about local markets after which the market is serviced via FDI. Regardless of the exact reasons for the complementarity between trade and FDI, steps to enhance intra-regional trade among APEC members ought also to help facilitate the cross-border FDI flows as well.
Lastly, the paper found that economies with lower country risk appear to attract more FDI inflows. Particularly, our results suggest that the most important component of this risk pertains to political risk (as opposed to financial or economic risks). The link between political risk and cross-border capital movement deserves special attention; as such a link may be seen as one particular channel through which institutions are able to promote productivity growth (Acemoglu et al. (2005); Bénassy-Quéré et al. (2007)). Indeed, good governance infrastructure exerts a positive influence on economic growth through the promotion of investment (domestic and foreign alike), while institutional underdevelopment is a key explanatory factor for the lack of foreign financing in developing economies.
Individual and regional efforts to improve institutional quality of member economies are expected to contribute to increasing intra-regional FDI flows in the region. Other aspects such as more stable political systems, improvements in socioeconomic conditions, reduction in corruption and enhancement of law and order are all important objectives in and of themselves and will obviously contribute to greater FDI flows. APEC-wide action plans and capacity-building programs could be useful in some instances to member economies, helping to contribute to enhanced intraregional economic ties.
APEC has in place several action plans and capacity building programs which seek to improve the institutional settings in economies. They include actions which can be chosen by economies to most suitably reflect their particular circumstances. The APEC-OECD Integrated Checklist on Regulatory Reform, the Investment Action Plan and elements of the Leaders’ Agenda to Implement Structural Reform are all relevant to suggesting economies implement sound institutional settings that underpin investment. This research shows that benefits are likely to accrue if economies implement them.
There are many ways to take this study forward, some of which are considered below.
First, the analysis here suggests quite a strong degree of complementarity between trade and FDI within APEC. At least part of this is related to the high level of vertical specialization that occurs in the region, especially within East Asia. That is, due in large part to FDI, the production of manufactured goods has been fragmented across the region and this, in turn, has generated a huge expansion of intraregional trade in parts and components. Thus, international product fragmentation is an important feature of the deepening interdependence in East Asia and more broadly in the entire APEC region.34 Therefore, more in-depth analysis is needed to understand the FDI-trade linkages and the phenomenon of product fragmentation within the APEC region and what role policy could play to further enhance these trade and investment links.
Second, most analysis of FDI fails to differentiate between Greenfield and Mergers and Acquisitions (M&As). The latter are likely more affected by financial variables such as stock market capitalization, liquidity etc and their macroeconomic and development consequences could be quite different from Greenfield investments. While data limitations prevent a breakdown of the FDI data into the two sub-components, one could separately study M&A data using other data sources such as Thomson Financial, Bloomberg, Dealogic and such. Analysis of M&A data, which is based on the economy of ownership rather than flow of funds, also overcomes the problems of transhipping and round tripping that is pervasive in most capital flows data.


