After the announcement of a long-term plan to promote FTAs in September 2003, the Korean government formed FTAs with many countries such as Chile, Singapore, EFTA, the US, the EU, and so on. Among the FTAs that Korea had made, the Korea-US and Korea-EU FTAs had faced very strong opposition from producers of agricultural products in Korea.
Almost all parts of agriculture in Korea were expected to suffer negative effects from the FTA with the US, since the prices of domestic products were higher than those of imported ones, in general. Among the agricultural sectors, the beef and pork industries were predicted to be affected the most. For example, Choi et al. (2006) estimated that the Korea-US FTA would lead to a decrease in the value of domestic production in the beef and pork sectors of 525 billion won (about 445 million dollars with exchange rate of 1180won/$) and 250 billion won (about 212 million dollars), respectively.
Meanwhile, it is commonly speculated that the influences of the FTA with the EU on Korean agriculture would be small compared with those of the Korea-US FTA. However, the pork sector was expected to receive a large negative impact. For this reason, all agriculture-related debates over the Korea-EU FTA have focused on the impact of the FTA on the Korean pork market.1 Hog breeders have argued that the expected value of the decrease in domestic pork production would be 400 billion won (about 340 million dollars), which is about 10 percent of the total value of production. However, those that support the FTA insisted the impact would be very small since the pork market has already been opened to other countries such as Chile with very low tariffs.
This intense controversy over the impacts of the FTAs with the US and EU instigated much research, such as Lee et al. (2005), Choi et al. (2006), Eur and Hyu (2006), Choi and Lee (2007), Han et al. (2007), Choi (2009), Ahn and Cho (2009), and Kim and Ahn (2009). However, the assessments of the FTAs in these studies do not form a consensus. Part of the reason for the very different results is the differences between the applied models. The other reason for the disagreement stems from assumptions made about the anticipated tariff reduction schedules of the FTAs. Some previous studies did not incorporate competition between domestic and imported pork and thus simply assumed the imported price would be the same as the domestic price. In addition, there is another fundamental issue. Most studies assumed specific price elasticities of demand and supply or used specific functional forms of demand and supply in constructing the models, thus failing to show a wide spectrum of the effects of the FTAs. Motivated by these limitations, this paper develops a stochastic simulation model that allows random combinations of the elasticities in the demand and supply sides within reasonable ranges to fill the gaps of the existing studies.
The main purpose of this study is to present wide ranges of the impacts of the FTAs with the EU and US on the equilibrium price and quantity of Korean pork and to provide a firm ground in evaluating the arguments surrounding the pork market in Korea as well as in preparing the policies that support hog breeders.
In the next section, the characteristics of the Korean pork market are discussed. Patterns of imports and trends of consumption are presented in this section. This section also discusses the tariff reduction schedules of imported pork according to the Korea-US and Korea-EU FTAs. Section III explains the simulation model for evaluating the impacts of the FTAs. The simulation model that includes competitiveness between domestic and EU as well as US pork is presented in this section. The supply relations of EU and US pork, which contain market power parameters and compose the system of equations for the simulations, are derived from the profit maximization problems of pork exporters. Section IV discusses in detail the elasticities employed in the analyses. Scenarios for conducting simulations are also presented in this section. Two scenarios regarding the implementations of the FTAs and three scenarios reflecting the market power of the exporters are applied. Section V reports the results of the stochastic simulations. The implications of the results are discussed, and the comparison between the simulated results of the current study and those of prior studies are presented in this section. Section VI concludes with some policy implications.
1Dairy was also mentioned as the sector that would be very much influenced by the FTA with the EU. However, fresh milk is hard to import so dairy products such as cheese, of whose share in the domestic dairy market is relatively small, have been the main targets of the investigation for the impacts of the FTA with the EU.
Ⅱ. Characteristics of Pork Imports in Korea and Tariff Reduction Schedules
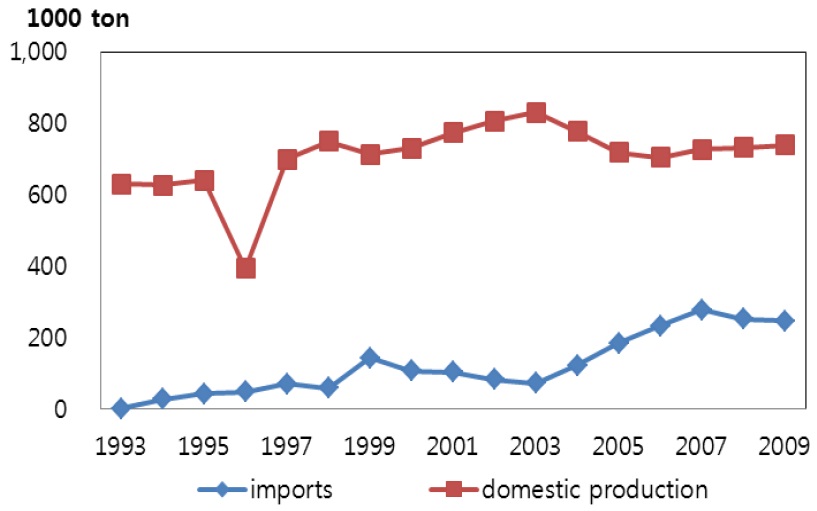
Total consumption of pork in Korea has expanded from 624,544 tons in 1993 to 929,918 tons in 2009. During the same period, the quantity supplied has increased by 61 percent. Imports gradually rose until 1999, but then decreased from 2000 to 2003. However, the increase in imports since 2003 has been outstanding; the average annual growth rate of imports since 2003 is 34 percent. The rapid rise in imports is due to the FTA that Korea made with Chile and the embargo on beef imports from the US due to BSE outbreak. Currently, the share of imports within the total consumption of pork is about 26 percent.
As presented in figure 1, there is a negative relationship between imports and domestic consumption during the period from 2003 to 2009. In the period from 1999 to 2003, imports declined while domestic production increased. However, after 2003, imports increased while domestic production showed a decreasing trend.
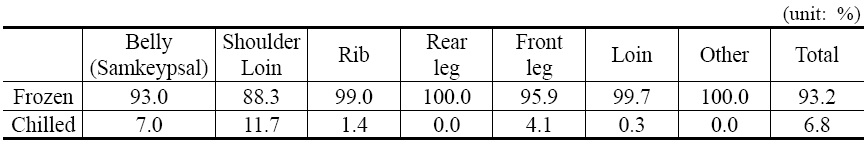
It is noticeable that most of the imported pork in Korea is frozen. During the 10 years from 2000 to 2009, the share of frozen pork within total imports was about 93.2 percent, as shown in table 1. For example, 93 percent of pork belly (which called as Samkeypsal in Korea), which constitutes the largest share within the imports, was imported in frozen form.
[Table 1] Shares of Parts within Total Imports of Pork

Shares of Parts within Total Imports of Pork
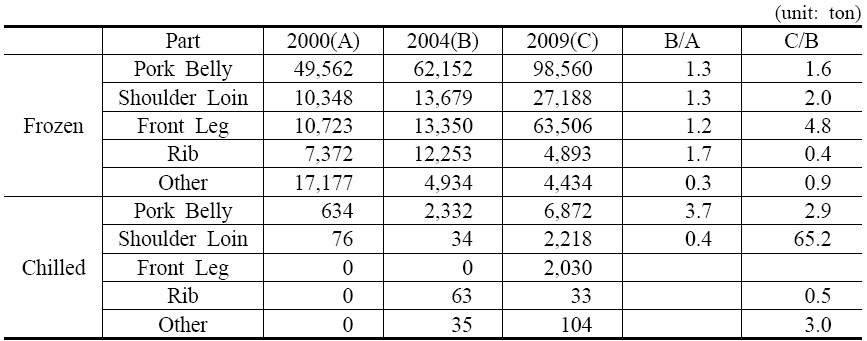
Table 2 reports on the imported parts of frozen and chilled pork. Due to the extremely high preference for Samkeypsal in the Korean market, pork belly is the most-imported part. The share of frozen belly within the total imports of frozen pork was about 50 percent in 2009, whereas the share of chilled belly within the total imports of chilled pork was about 61 percent. Shoulder loin, front leg, and rib are also parts that were imported in relatively large amounts.
[Table 2] Import of Frozen and Chilled Pork by Part

Import of Frozen and Chilled Pork by Part
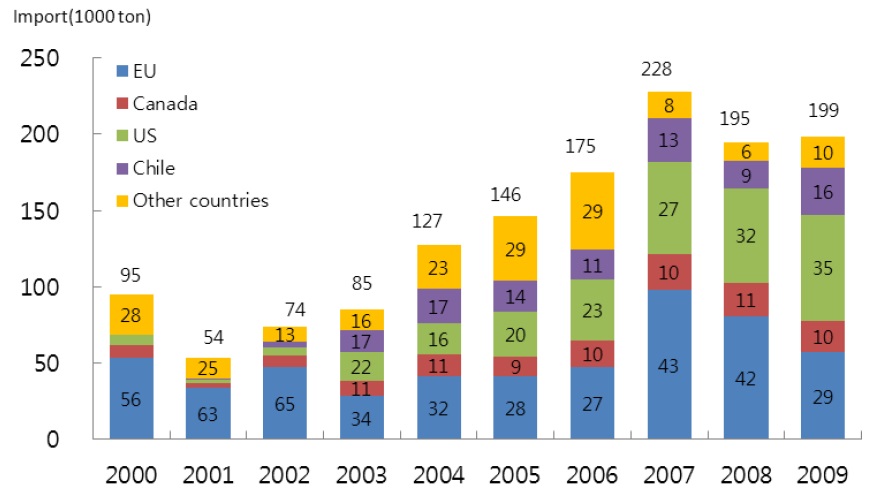
As indicated in figure 2, frozen pork is imported mostly from the EU and US. Other major exporting countries are Canada and Chile. In 2009, the shares of frozen pork imported from the EU and US within total imports were 35 and 29 percent, respectively. Shares of Canada and Chile were 10 and 16 percent in 2009. Since 2002, the share of imports from Chile has been remarkable. The FTA between Korea and Chile was ratified in 2004 and the 25 percent tariff rate on pork imported from Chile has been reduced until 2011 and will be completely removed in 2013. Although the tariff reduction on Chilean pork has contributed to a rapid increase in imports from Chile, the market share of Chilean pork is not likely to increase in the future. With the implementation of the FTAs with the US and EU, tariff reduction will make EU and US pork cheaper and allow for strong competition with Chilean pork. Thus, we can expect the market shares of EU and US pork to grow larger relative to that of Chilean pork.
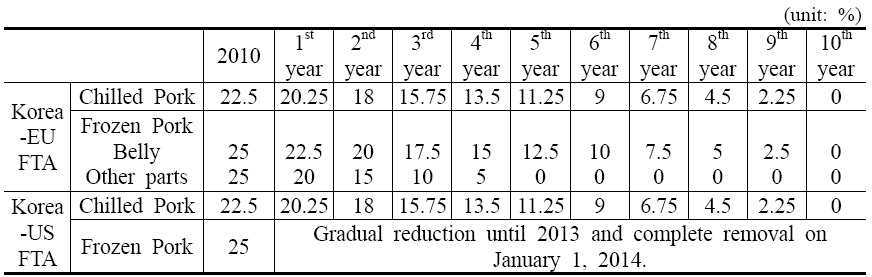
Table 3 reports tariff rates on EU and US pork after the implementation of the FTAs. In 2010, a 22.5 percent tariff was imposed on chilled pork while a 25 percent tariff was levied on frozen pork. The Korea-US FTA agreed to remove the tariff on chilled pork imported from the US within 10 years. However, Korea must remove the tariff on frozen pork imported from the US on January 1, 2014. Until then, the tariff on US frozen pork must be reduced in equal yearly increments. On the other hand, Korea agreed with the EU to eliminate the tariff on chilled pork within 10 years. For frozen pork, two tariff reduction schedules are applied. Tariffs on pork belly will be removed within 10 years while tariffs on other parts of pork will be abolished within 5 years.
[Table 3] Tariff Rates on EU and US Pork after Implementation of the FTAs

Tariff Rates on EU and US Pork after Implementation of the FTAs
Ⅲ. Simulation Model for Assessing the Impacts of the FTAs
The basic structure of the model for this study is expressed as a system of equations representing demand functions, market supply relations, and price relations. While the presented model is in succession to prior studies in part, it has fairly distinctive features in three aspects.
First, in defining the demand equations, the prices of imported pork are explicitly included as the substitute prices, similar to previous studies(Kim et al., 2007; Ahn and Cho, 2009; Kim and Ahn, 2009), since imported and domestic pork are not homogenous. Unlike these previous studies, however, the present paper includes different demand functions of pork based on country of origin. Moreover, the price competition between domestic and imported pork is reflected not only in the demand function of domestic pork, but also in the demand function of imported pork. Most previous studies did not consider the competition between domestic and imported pork in the demand function of imported pork. Thus, these studies failed to reflect the effect of the decrease in domestic pork price, caused by the FTA, on the shift in the demand function for imported pork. The decrease in the price of imported pork due to the FTA would shift down demand for domestic pork, thus decreasing the domestic pork price, which would in turn lead to a downward shift in the demand for imported pork. These feedback effects are considered in the current study.
Second, the developed model in this study allows for the possibility of price control by pork exporters. All previous studies assumed that pork exporters are price takers; thus, tariff reduction incurred by the FTA was assumed to be fully transmitted into the decrease in the imported price. However, in reality, we observed that the imported price does not decrease large enough in response to the tariff reduction. In order to explain this discrepancy between the decrease in the imported price and tariff reduction, the simulation model is developed in such a way that pork exporters’ market power plays a role.
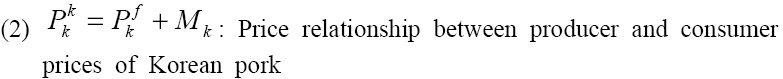
Third, the simulation model in this study incorporates the relationship between producer and consumer prices of domestic pork. None of the previous studies distinguished between these two prices; thus, the imported price was assumed to directly influence the domestic producer price. However, the consumer price of domestic pork is of great importance when competing with imported pork at the consumer level. For this reason, the model in this study is structured in such a way that imported prices affect the consumer price of domestic pork, which then influences the producer price. Since the change in producer price is derived, the change in the gross revenue of pork producers evaluated in the current study is based on a more theoretical basis.
The structure of the model is described as follows:


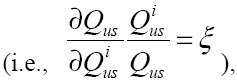
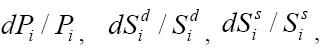
For the inverse demand of each type of pork, the superscript indicates the demand where price of the interest is influencing and the subscript indicates the country of origin. Thus, for example,

we indicated the superscript as the demand to which the prices belong in order to clearly show the interaction among the prices of each pork in each demand equation, as discussed by equations (10) and (11). In equations (1) to (7),

is the shifter of demand for pork from country

is the producer price of Korean pork,

is the shifter of supply for Korean pork,

is the international price of pork from country
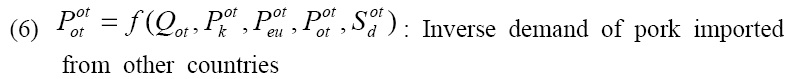
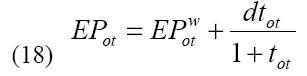
It is assumed that the selling price of pork imported from other countries is determined by adding the tariff to the international price, as in equation (7). Assuming a small country, equation (7) provides the supply function for pork imported from other countries. In defining the supplies of US and EU pork, however, we address the market power of exporters of US and EU pork. The supply relation of US and EU pork is based on the profit maximization problem of the representative exporter. For example, US pork exporter
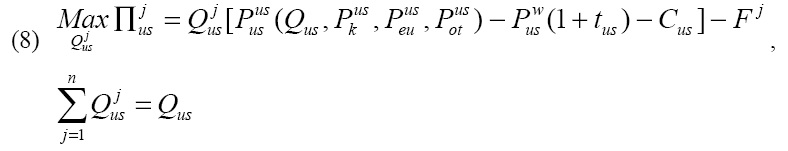
where

is the US pork supplied by exporter
2
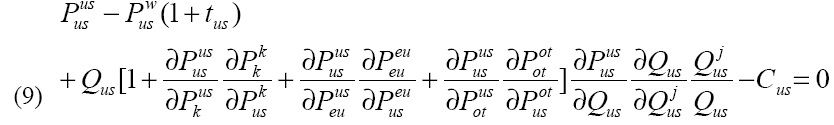
In equation (9),
is the conjectural elasticity that reveals the degree of competition among suppliers (exporter in the setting of the current study). Thus, if it is 0, then the market is competitive, and if it is 1, then it indicates a cartel (or monopoly) among the suppliers. The oligopoly market is parallel with the conduct parameter whose value is between 0 and 1. For the current study, this elasticity is assumed to be symmetric across all exporters

as in Genesove and Mullin (1988), Sexton (2000), and Wolfram and Corts(2001).
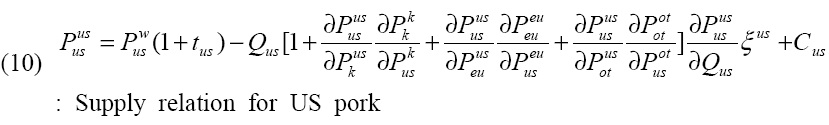
By applying the same line of the profit maximization problem for the exporters of EU pork, we can derive the first order condition, which is very similar to equation (9). In short, the supply relations for US and EU pork are expressed as follows.


The system of equations that describes the equilibrium of pork markets where the market power of exporters is embedded consists of equations (1) to (7), (10) and (11). In the system, endogenous variables are

and
Before we proceed further, the advantages of the equilibrium displacement model with which the current study is going to simulate the impacts of the FTAs should be emphasized. An equilibrium displacement model does not require a specific functional form of demand or supply, and it is composed of the percentage changes in the variable and the parameters, such as price elasticity of demand and supply. Moreover, this model does not need specific values of endogenous variables at the starting year of the simulation. Thus, it has been widely applied to the assessment of the influences of the changes in exogenous shocks, such as policy change, tariff reduction, introduction of R&D, and change in supply and demand shifters. Some notable examples include Floyd (1965), Sumner and Wohlgenant (1985), Alston and Hurd (1990), Piggott, Piggott and Wright (1995), James and Alston (2002), and Zhang and Sexton (2002) (Davis and Espinoza (1998) provide a detailed list of the studies using this form of models).
An equilibrium displacement model is based on the log-differential form of equations (1) to (7), (10), and (11). Total differentiation of each equation in the system and division of the differentiated equations with left hand side variables under the assumption of linear demand yields the following forms.


3

where

is the reciprocal of the elasticity of demand for pork from country

is the elasticity of price transmission from the price of pork from country

is the elasticity of the price of pork from country

is the reciprocal of the elasticity of supply for Korean pork with respect to own price, and

is the elasticity of the price of Korean pork with respect to the supply shifter. In these equations,
and

denote

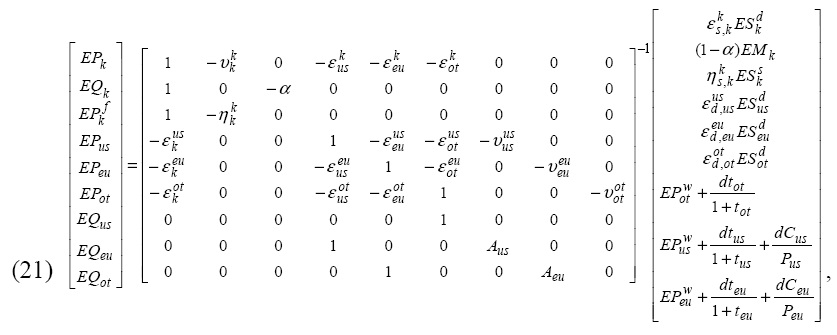
and
respectively. Using a matrix form, the solution of the system is expressed as equation (21), where endogenous variables are in the left hand side.

where

and

Since the evaluation of the sole impacts of the changes in the imported prices caused by the FTA is the purpose of this paper, the changes in demand and supply shifters, changes in international prices, change in the marketing margin for Korean pork, and changes in unit handling costs for the exporters of EU and US pork are not incorporated in the simulations. Thus, the exogenous variables

are assumed to be zero in the analyses. In other words, only changes in tariff rates are reflected in the simulations.
2Exact first order condition is To add more explanation, is the direct impact on price equation (4) according to the change in Qusj and are the indirect impacts on price equation (4), according to the change in Qusj. For example, the captures the change in the price of US pork (in equation (4)) according to the change in the price of Korean pork (in equation (1)) incurred by the change in price of US pork. 3Total differentiation of equation (10) is thus the division of both sides by yields which is the same as equation (19). 4For example, we may set the demand function of Korean pork as Inverse demand that corresponds to this function is Thus, in this case, is the same as and is the same as etc.
Ⅳ. Parameters and Scenarios for the Simulations
Instead of estimating the elasticities, such as own or cross price elasticity of demand in each demand function, the elasticities from the previous studies are used in the simulations. However, the simulation results critically depend on the specific value of the elasticity that we choose from the prior studies. Moreover, the elasticities differ by study, which makes it difficult to pick out the appropriate single value.
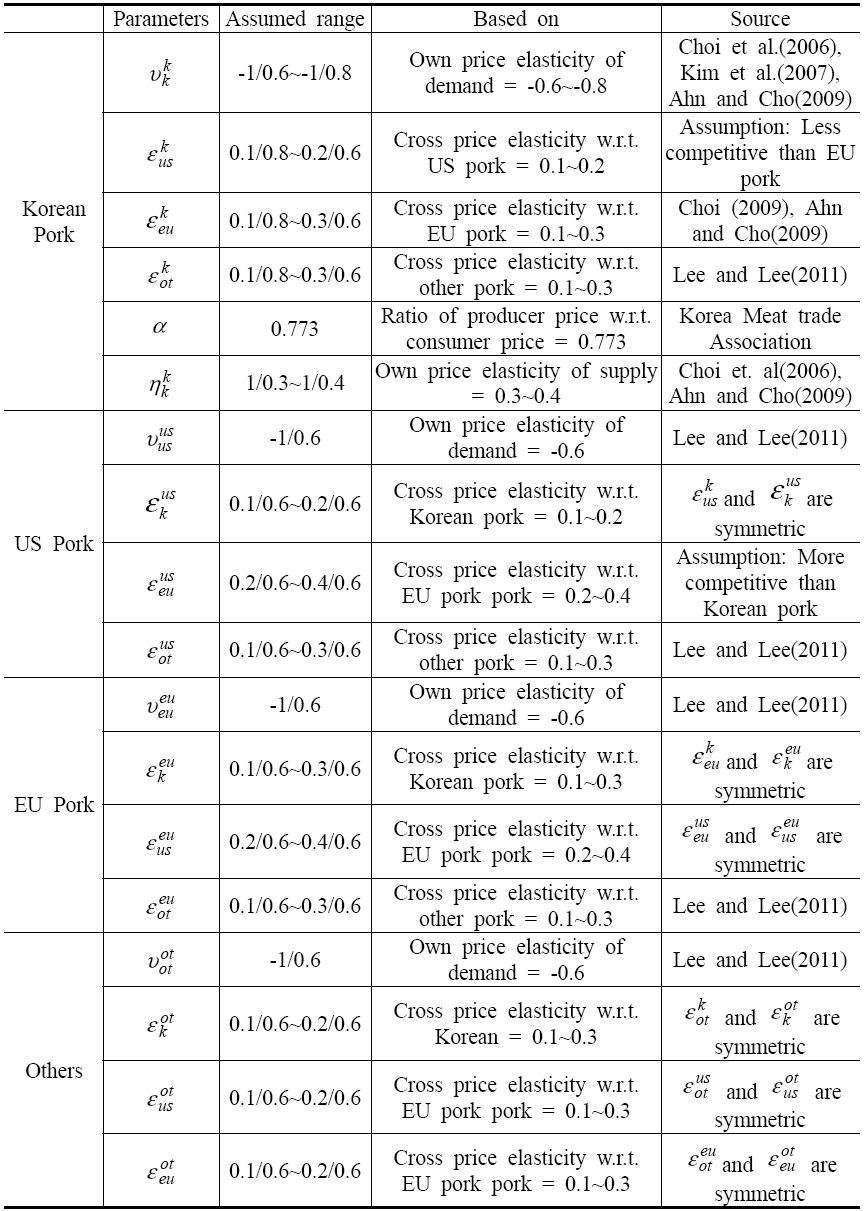
For these reasons, the ranges of elasticities were chosen from the most recent studies, and random combinations of the elasticities were applied for conducting the stochastic simulations. Since most previous studies assumed or estimated elasticities using the usual form of demand and supply functions where quantity demanded/supplied is in the left hand side, the selected elasticities were converted into the parameters in equations (12) to (20) as in the third column of table 4.
[Table 4] Elasticities Used in the Simulations

Elasticities Used in the Simulations
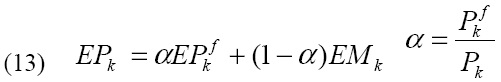
Table 4 presents the selected ranges and the sources of the elasticities used in the stochastic simulations. Recent studies on domestic pork demand show a relatively inelastic demand with respect to own price. For example, Choi et al. (2006) used a demand elasticity of -0.6 in assessing the impacts of the FTA with the US, Kim et al. (2007) estimated the demand elasticity as -0.6034, Choi (2009) posited a demand elasticity of -0.73 in evaluating the impact of the tariff reduction for pork, and Ahn and Cho (2009) used a demand elasticity of -0.6 to stimulate the influences of the FTA with the US. Reflecting these studies, the range from -0.6 to -0.8 is adopted as the own price elasticity of demand for domestic pork.
For the price elasticity of supply for domestic pork, the range from 0.3 to 0.4 was used in the simulations. In analyzing the supply of domestic pork, recent studies posited an inelastic supply. Choi et al. (2006) used a supply elasticity of 0.31 and Ahn and Cho (2009) assumed a supply elasticity of 0.3, as in the outlook model of the Korea Rural Economic Institute (KREI). Thus, the adopted range for the price elasticity of supply in the simulations is within reasonable boundaries.
The producers’ cooperatives and meat packers association reported that the share of chilled pork in the domestic supply is 70 to 80 percent. However, the majority of imported pork is frozen. Based on this indisputable difference, most recent studies assumed very weak competition between domestic and imported pork. Reflecting this circumstance, the range from 0.1 to 0.3 for the cross elasticity of domestic pork with respect to the price of EU pork was used in the simulations, as in Choi (2009) and Ahn and Cho (2009). Kim et al. (2007) estimated the cross elasticity of domestic pork with respect to the price of imported pork as 0.21, and the outlook model developed by KREI showed it is about 2/5 of the own price elasticity of demand. Considering these empirical studies, the cross elasticity of domestic pork with respect to the price of EU pork used in the simulations is well within the acceptable range. A little bit narrower range for the cross elasticity of domestic pork with respect to the price of US pork was used in the simulations. Over the last 10 years, imports from the US have been less than those from the EU. This implies that the competitiveness of EU pork is stronger than that of US pork in the domestic market; thus, the cross elasticity of domestic pork with respect to the price of US pork is lower than that of EU pork. Based on this difference in competitiveness, the adopted range for the cross elasticity of domestic pork with respect to the price of US pork in the study ranges from 0.1 to 0.2. For the cross elasticity of domestic pork with respect to the price of pork imported from other countries, the range from 0.1 to 0.3 was used in the simulations, following Lee and Lee (2011).
For the own price elasticity of demand for US, EU, and other pork, -0.6 was used in the simulation as in Lee and Lee (2011). Symmetry was assumed for the cross price elasticities between each pork price

For doing stoachasitc simulations, it was assumed that the elasticities

are uniformly distributed within each picked out range, in order to allow equal probabilities to appear. Using Simulación 4.0, random numbers for each elasticity were generated, and 2,000 different stochastic combinations of elasticities were made. Thus, the simulation results produced 2,000 different solutions for each endogenous variable.
Two scenarios regarding the implementation of the FTAs as well as three scenarios regarding the degree of market power of the exporters (six scenarios in total) were employed in the simulations. For implementation of the FTAs, the first scenario was set to assess the exclusive effects of the FTA with the EU, in order to reflect the situation that the FTA with the EU is already in effect while that with the US is still waiting to be ratified. In this scenario, the change in tariff levied on US pork was assumed to be zero (i.e.,
In the scenarios of tariff reductions, the critical point is the choice of starting year of the tariff reduction for US pork. It is very hard to predict the exact date of the ratifications by the National Assemblies of Korea as well as the United States. Thus, it was simply assumed that the Korea-US FTA will be rectified in 2011 both in the United States and Korea and the tariff reduction will start from 2011.
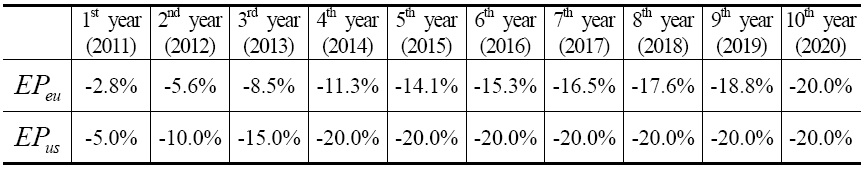
As discussed earlier, almost all imported pork is frozen, and the proportion of frozen pork within the imports from the EU and US is more than 95 percent. Thus, only tariff reduction on frozen pork was incorporated in the scenarios. Considering the tariff reduction schedule in table 3, the changes in the prices of EU and US pork were assumed as in table 5. In order to calculate the changes in the price of EU pork in table 5, tariff rates for EU pork in table 3 were weighed by the average shares of pork belly (59 %) and other parts of pork (41%) within the total imports from the EU during 2000 to 2010.
[Table 5] Assumed Changes in the Prices of EU and US Pork incurred by the FTAs

Assumed Changes in the Prices of EU and US Pork incurred by the FTAs
1. Effects of the Korea-EU FTA
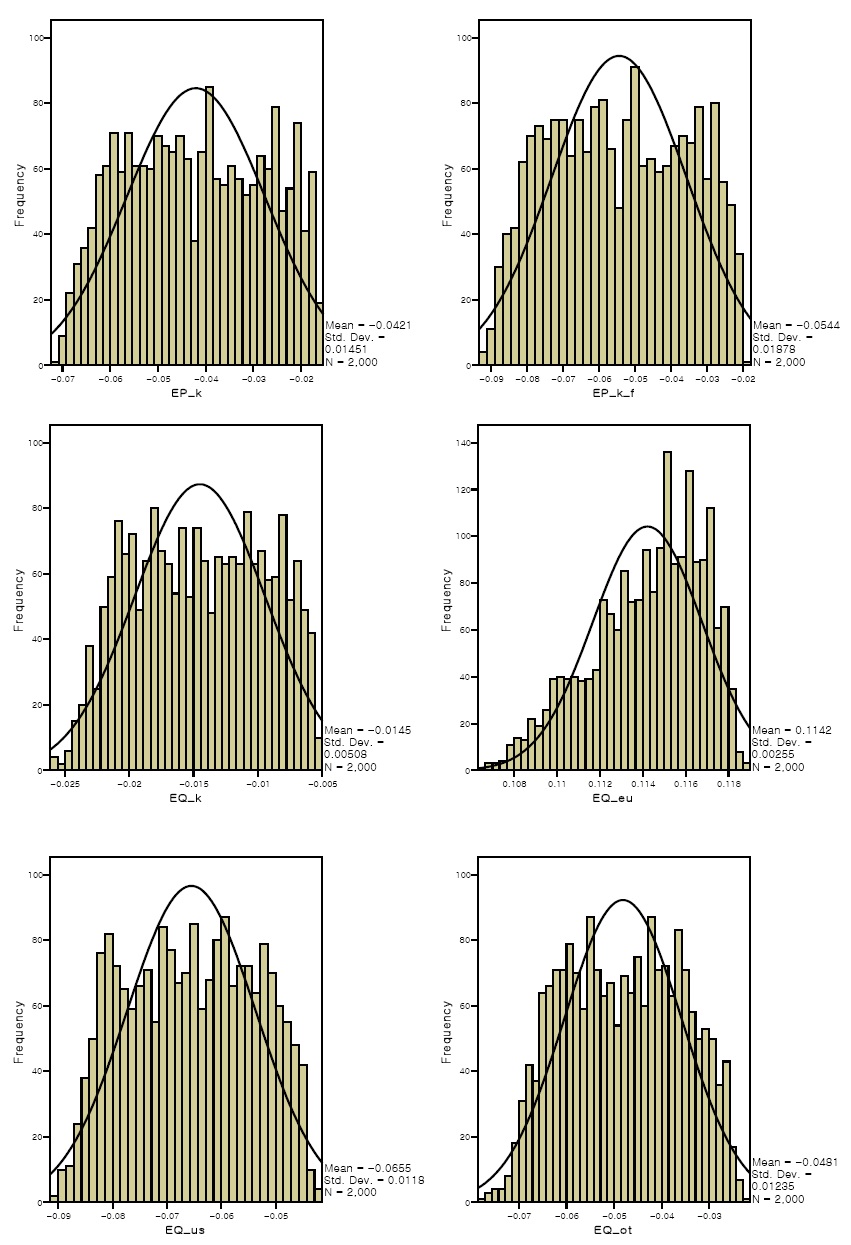
Using 2,000 different stochastic simulation results, distributions of the simulated changes in quantity and price caused by tariff reductions on EU pork were constructed. Figure 3 illustrates the distributions in the 10th year when all tariffs are completely eliminated, under the assumption that exporters of US and EU pork do not exercise market power.
The FTA with the EU was simulated to bring about little influence on the quantity of domestic pork, but relatively large impact on the domestic pork price. As indicated by figure 3, the tariff elimination of EU pork would lead to a decrease in the quantity of domestic pork by 1.45 percent on average (with a standard deviation of 0.5 percent). The simulated mean of the fall in consumer price of domestic pork would be 4.2 percent with a standard deviation of 1.45 percent. A decrease in the producer price of domestic pork was simulated to be greater than that of the consumer price. The mean of the change in producer price would be -5.4 percent at a standard deviation of 1.87 percent.
The removal of the tariff on EU pork was simulated to increase imports from the EU by 11.42 percent while it would decrease imports from the US and other countries by 6.55 percent and 4.81 percent, respectively, since removal of the tariff would make EU pork relatively cheaper.
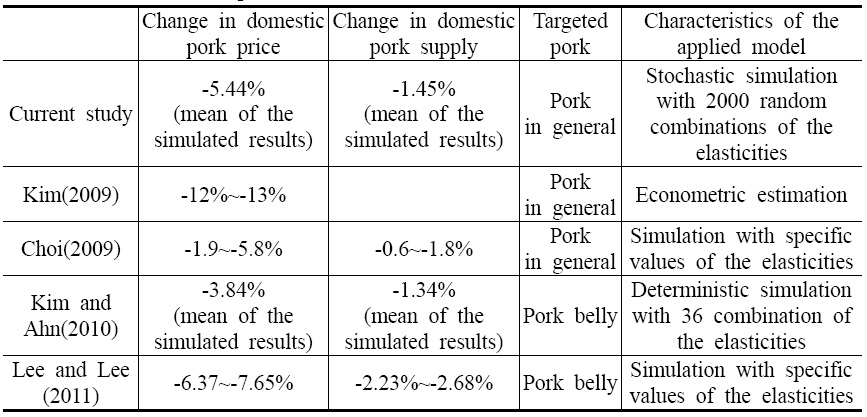
Table 6 shows the difference in the simulated results between current and prior studies. Assuming a competitive market for imported pork, the stochastic simulation results on the equilibrium price and quantity of domestic pork in the current study did not much differ from the results of prior studies; however, the impacts evaluated in the current study were generally smaller than those of previous studies. Based on econometric estimation, Kim (2009) reported the Korea-EU FTA would decrease the domestic pork price by 12 to 13 percent. Choi (2009) reported that the FTA would result in a decrease in the price and quantity of domestic pork by 1.9~5.8 percent and 0.6~1.8 percent, respectively. The simulated means for the price and quantity of domestic pork belly in a work by Kim and Ahn (2010) were reported to be -3.84 and -1.34 percent, respectively. Lee and Lee (2011) reported relatively high impacts of the Korea-EU FTA on the price (-6.37~-7.65 percent) and quantity(-2.23~-2.68 percent) of domestic pork belly.
[Table 6] Simulated Impacts of Tariff Removal on EU Pork in Current and Prior Studies

Simulated Impacts of Tariff Removal on EU Pork in Current and Prior Studies
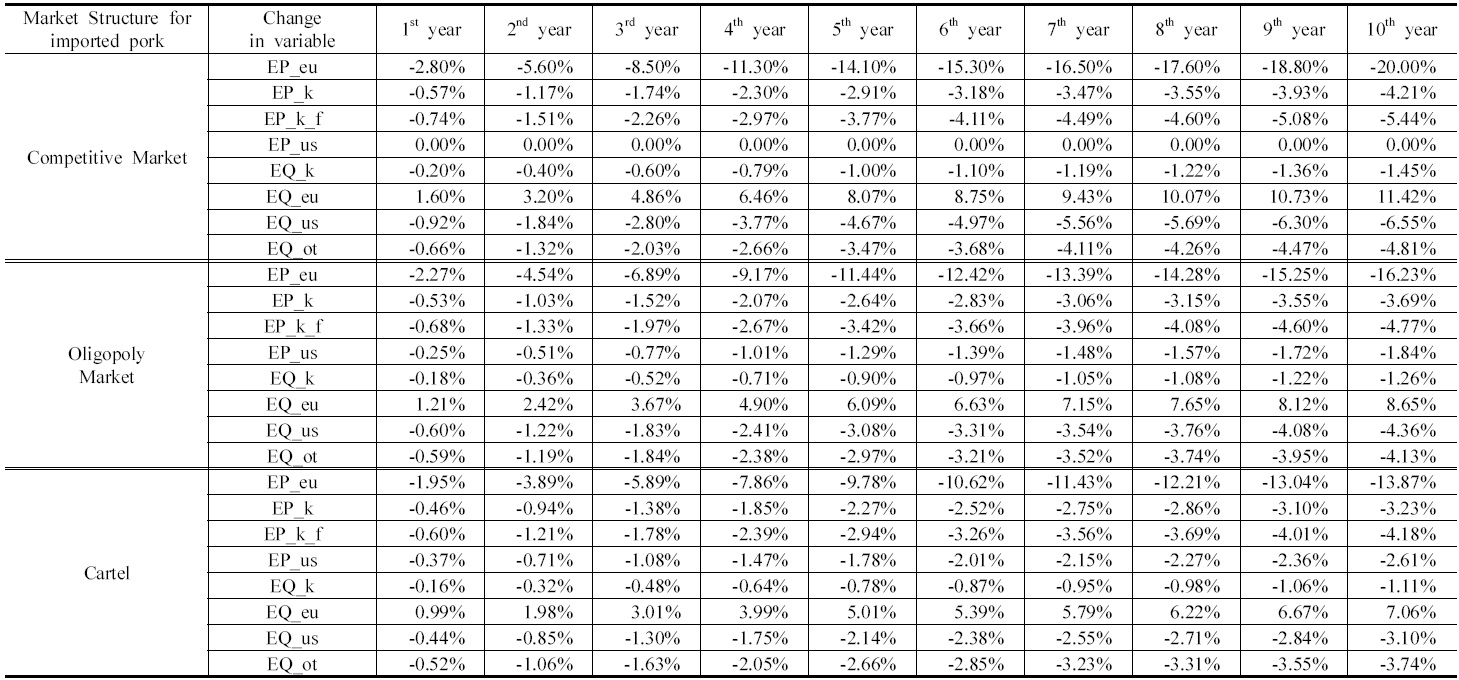
Impacts of the FTA with the EU during the implementation period under the different situations of the market structure for imported pork are presented in table 7. The stochastic simulation results in table 7 have four noticeable features.
First, the impacts of the FTA (the reduction of the tariff) decrease as the degree of the market power of exporters increases. In other words, under oligopoly or monopoly markets for EU and US pork, decreases in the quantity and price of domestic pork, increase in imports from the EU, and decrease in imports from the US as well as other countries would be lower than those under a competitive market for EU and US pork.

Simulated Effects of the FTA with the EU according to a different Market Structure of Imported Pork
Second, the decrease in the imported price of EU pork under the market power of exporters would be less than that under a competitive market for EU and US pork. For example, complete tariff removal in the 10th year would result in a decrease in the price of EU pork by 20 percent with no market power of exporters. However, removal of the tariff on EU pork would bring about a decrease in the price of EU pork of 16.23 percent under the oligopoly power of exporters and 13.87 percent under the monopoly power of exporters. In other words, whereas the tariff reduction is fully transmitted to the decrease in the imported price under the competitive market of imported pork, it would be only partially transmitted to the decrease in the imported price under the market power of exporters. This partial transmission of the tariff reduction explains why there are smaller impacts of the FTA with the market power of exporters, which were discussed in the above paragraph. When exporters exercise market power, they set the selling price in the Korean market by partially reflecting the reduction of the tariff and absorbing the difference between the change in marginal cost (caused by the change in tariff as in equation (8)) and the change in selling price as additional profit. This fact has very important implications for the Korean pork industry. The situation in which exporters of pork in the EU and US exercise market power is desirable to Korean pork producers since the price and quantity of domestic pork are little influenced, whereas it hurts Korean pork consumers by maintaining a relatively higher price than the competitive market.
Third, whereas a sole reduction of the tariff on EU pork would result in only a decrease in the price of EU pork if there is no market power of exporters, a reduction of the tariff would lead to a decrease not only in the price of EU pork, but also in the price of US pork. In the fifth column of table 7,
Fourth, the simulation results suggest that the FTA with the EU would have smaller impacts even under the extreme situation of a cartel among exporters. Moreover, the differences between the impacts of the FTA under a competitive market and those under the monopoly power of exporters are not remarkable. For example, tariff removal on EU pork would result in a decrease in producer price and quantity of domestic pork of 5.44 and 1.45 percent, respectively, under a competitive market, and 4.18 and 1.11 percent, respectively, under the market power of exporters.
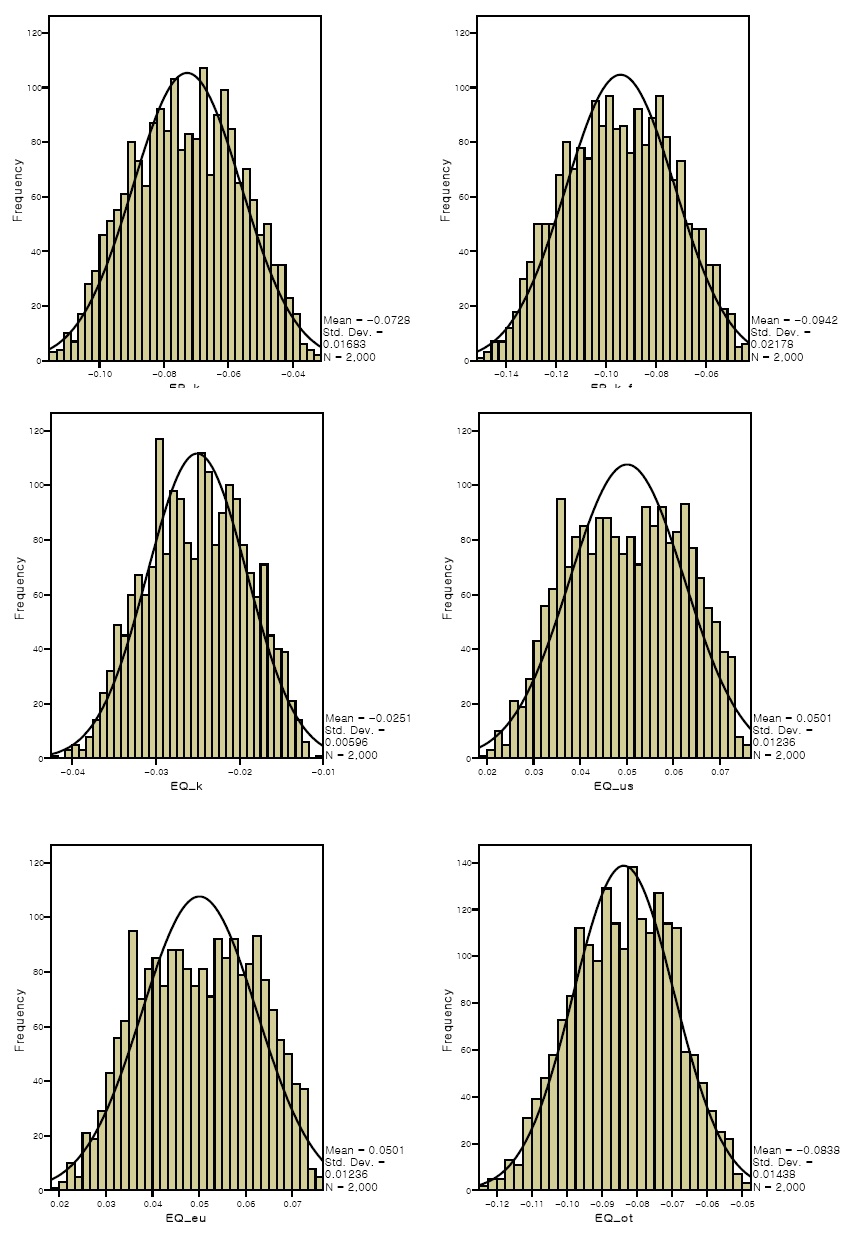
2. Effects of the Korea-EU FTA and Korea-US FTAs
Figure 4 depicts the distributions of the simulated changes in quantity and price of domestic pork in the 10th year of implementation of the FTAs when pork exporters do not exercise market power. Removal of the tariffs on both EU and US pork would result in relatively little impacts on the quantity of domestic pork, whereas there would be a relatively larger influence on domestic price. However, the fall in quantity and price would be greater in the case of the FTA with the EU. After the elimination of the tariff on EU and US pork, the mean of the fall in the quantity of domestic pork was simulated to be 2.51 percent with a standard deviation of 0.6 percent, mean of the decline in the consumer price of pork was simulated to be 7.28 percent on average with a standard deviation of 1.68 percent, and mean of the decrease in the producer price of pork was simulated to be 9.42 percent on average with a standard deviation of 2.18 percent.
Removal of the tariffs on EU and US pork was simulated to increase imports from the EU by 5.01 percent. However, the simulated increase in imports of EU pork is less than that in figure 3, where only the Korea-EU FTA is implemented. The Korea-EU and Korea-US FTAs would largely decrease imports from other countries (by -8.3 percent) compared with the case of only the Korea-EU FTA (by 4.8 percent).
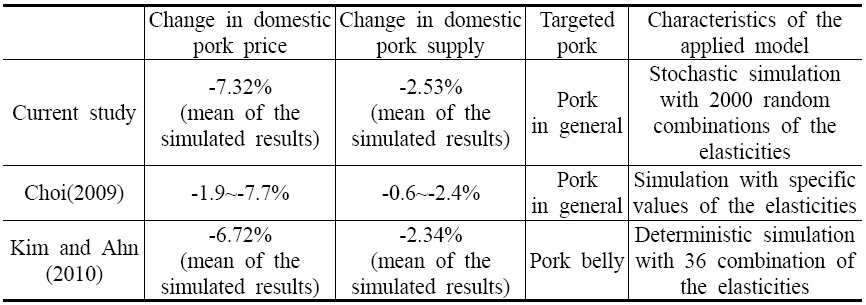
Table 8 shows the difference in the simulated results between the current and prior studies. Assuming a competitive market for imported pork, the stochastic simulation results on the equilibrium price and quantity of domestic pork in the current study are generally greater than those of previous studies. Choi (2009) reported that the Korea-EU and Korea-US FTAs would result in decreases in the price and quantity of domestic pork by 1.9~7.7 and 0.6~2.4 percent, respectively. The simulated means for the price and quantity of domestic pork belly in the work of Kim and Ahn (2010) are -6.72 and -2.34 percent, respectively.
[Table 8] Simulated Impacts of Tariff Removal on EU and US Pork in Current and Prior Studies

Simulated Impacts of Tariff Removal on EU and US Pork in Current and Prior Studies
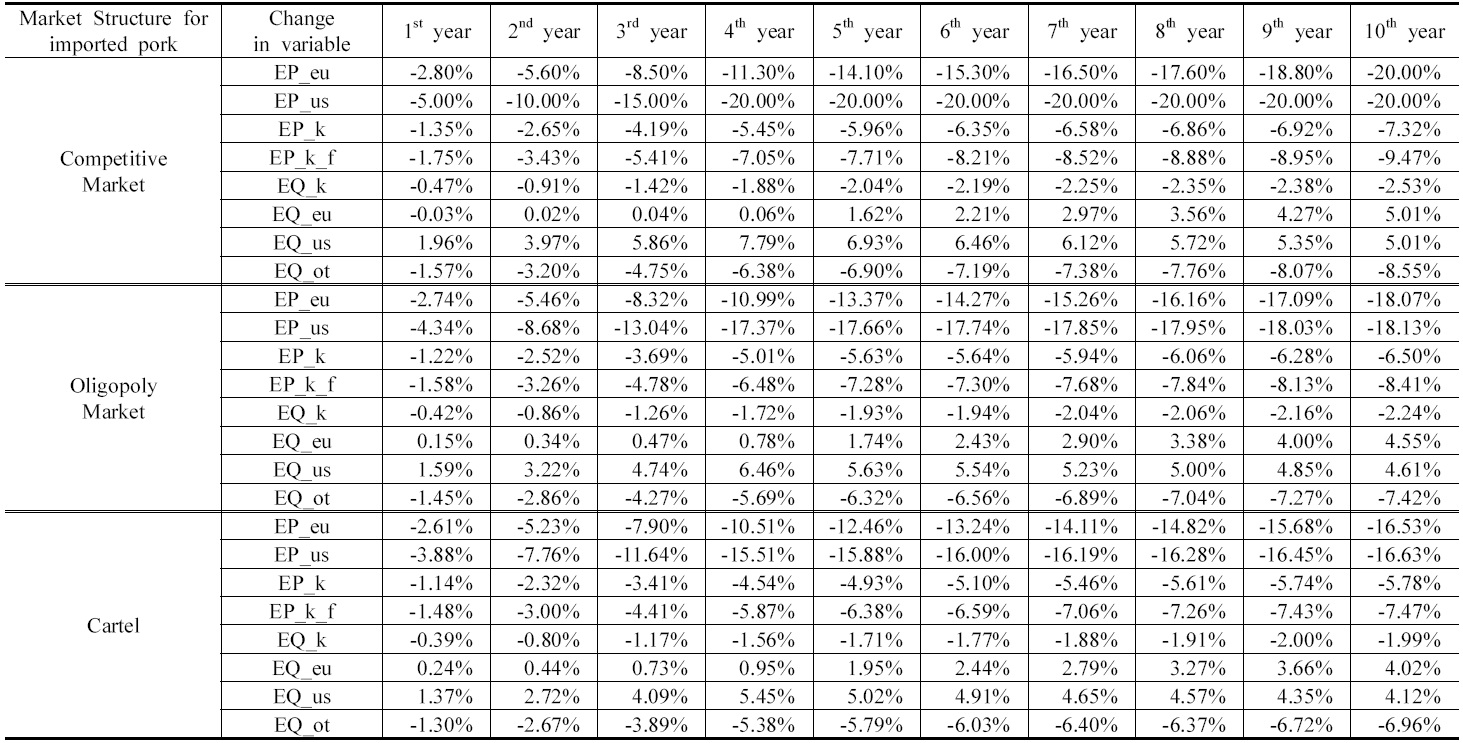
Table 9 presents the impacts of the FTAs with the EU and US during the implementation period under different situations of market structure for imported pork. The four characteristics discussed in table 7 are also found in table 9. However, there are four additional distinct features in the simulated results presented in table 9.
First, we can observe an increase in imports from the US, since tariff reduction on US pork was reflected in the simulations. Second, a decrease in the US pork price incurred by the tariff reduction under the market power of exporters is not large compared with the competitive market for the imported pork. This is because US pork exporters would exploit the difference between the tariff change and the change in selling price as additional profit.
Third, while imports of EU pork would increase continuously according to the reduction of the tariff on EU pork, imports of US pork would be highest in the 4th implementation year and decrease gradually until the 10th year. The reason for this simulated pattern of imports from the US can be explained by the difference in the tariff reduction schedules. Tariff reduction of frozen US pork will be completed in the 4th year after the implementing the Korea-US FTA. Thus, US pork would not have any more price advantage caused by the tariff reduction from the 5th year onward. However, tariff reduction on EU pork will continue after the 5th year of implementation; thus, EU pork would get cheaper relative to US pork and thus imports from the EU will become larger by substituting the imports from the US.
Fourth, if exporters of EU and US pork have no power to control prices, change in the price of US pork would be maintained at -20 percent from the 4th to 10th years of the implementation period since the tariff reduction on US pork would be completed in the 4th year. However, the price of US pork would continuously decrease even after the 4th year of implementation if pork exporters exercise market power (compare the 3rd and 11th columns or 3rd and 9th columns in table 9). The competition between the EU and US pork exporters can explain this phenomenon. If exporters exercise market power, they can set the price, and exporters of US pork have to lower the price of US pork to compete with cheaper EU pork, although there is no additional tariff reduction on US pork. These results are very realistic and reasonable considering the competing relationship between US and EU pork in the Korean market.

Simulated Effects of the FTA with the EU and US according to a different Market Structure of Imported Pork
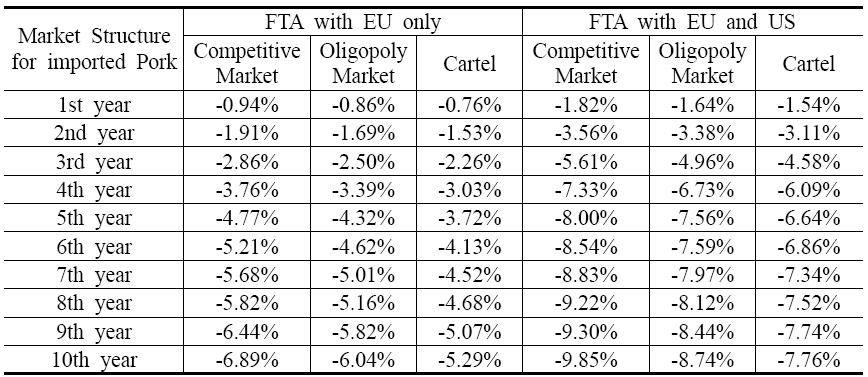
3. Impacts on pork producers’ gross revenue
Table 10 presents the simulated changes in domestic pork producers’ gross revenue. The results imply that the negative impacts of the FTAs on the pork producers’ revenue are relatively small at the beginning stages of the implementation of the FTAs; however, pork producers would suffer significant income loss after completion of the tariff reduction.
[Table 10] Change in Gross Revenue of Pork Producers

Change in Gross Revenue of Pork Producers
If the markets of imported pork are competitive, implementation of the FTA with the EU would decrease the gross revenue by 0.94 percent in the first year, 4.77 percent by the 5th year, and 6.89 percent by the 10th year, respectively. Under the monopoly power of exporters, pork producers’ gross revenue was simulated to decrease by 0.76 percent in the first year, 3.72 percent by the 5th year, and 5.29 percent by the 10th year, respectively.
If the FTAs with the EU and US are implemented together and there is no market power of exporters, the changes in gross revenue were simulated to be -1.82 percent in the first year, -8.0 percent by the 5th year, and -9.85 percent by the 10th year. With the monopoly power of exporters, the FTAs with the EU and US were simulated to bring about a fall in pork producers’ gross revenue by 1.54 percent in the first year, 6.64 percent by the 5th year, and 7.76 percent by the 10th year.
Considering that the value of domestic pork production was 4,085 billion won in 2009, tariff removal on pork imported from the EU and US would bring about a decrease in the value of domestic production in the pork sector by 402 billion won if there is no market power of pork exporters and by 317 billion won if pork exporters exercise monopoly power.
5Percentage change in gross revenue can be calculated by
The pork sector has been the center of the debate over the impacts of the Korea-EU and Korea-US FTAs since it was expected to receive the most negative effects. In order to evaluate the effects of the FTAs with the EU and US, this paper developed a simulation model that explicitly includes a substitution effect between domestic and imported pork.
The simulated impacts of the FTAs with the US and EU imply that the pork industry would remain stable at the beginning stages of the FTAs even with an increased amount of imported pork. This suggests Korean hog breeders and the government would have enough time to raise the competitiveness of domestic pork against imported pork. As discussed, the critical point is cross price elasticity. Since an increased quality difference between domestic and imported pork leads to lower cross price elasticity, the competitiveness of domestic pork can be increased by enhancing quality.
To assess the sole effect of the FTA with the EU and US, some other shocks, such as a tariff reduction on Chilean pork or possible changes in the price of pork imported from other countries, are not incorporated into the simulations. Thus, the simulation results must be interpreted with care by considering these assumptions. The simulation model in this paper does not incorporate the competition between chilled and frozen pork due to data limitations as well as restricted information on the demand and supply elasticities of frozen and chilled pork. This paper also does not account for the substitution between the parts of pork or competition between the same parts of domestic and imported pork. It would be worthwhile to develop a more extended model that overcomes these limitations in a future study.