Diabetes is a chronic disorder of carbohydrate metabolism due either to the relative or the absolute lack of insulin being produced by the beta cells or to insulin resistance. Insulin resistance develops as a result of the over production of insulin as in obese patients. Persistent hyperglycemia is the key feature of diabetes that leads to glycosylation of macromolecules. Glycosylated macromolecules, especially proteins, behave as free radicals and generate oxidative stress, which is a plausible factor for the development of diabetic complications [1]. During a pre-diabetic condition, hyperglycemia also plays a significant role in the destruction of beta cells by imparting oxidative stress because of glycosylation processes [2].
Treatment of chronic diseases with modern medicines is directed to the symptoms and not the root cause of the disease. Such treatments create other physiological disorders [3]. This is also the case with the treatment/ management of diabetes. In such a chaotic situation, a need exists for a more effective approach that can prevent/manage the disease with fewer or no side effects. Treatment of diabetes with botanicals is focused on the holistic approach and has fewer or no side effects compared to treatment with synthetic drugs. Botanicals prevent and cure the disease and help the individual to achieve his/her natural body rhythm. Many botanicals are used for the management of diabetes, but their effects and mechanisms are all different. They also differ in terms of efficiency. Hence, a need exists to standardize the available herbal medicines in terms of their efficacy and mechanism of action. We have already published from our laboratory reports on several plants with anti-diabetic effects [4, 5]. The next plant in the series is
SR is a perennial plant and belongs to the family
The aerial part of SR (authentication voucher no. 006) used in this study was collected from the university of Botswana campus in the month of February in 2012. The plant parts were washed, chopped into small pieces, and shade dried. After that, they were crushed to powder and soaked in 70% methanol for cold extraction. After seven days, the methanol extract of SR (SRM) was filtered and then made solvent free by evaporation under reduced pressure. The yield of the extract was 9.8% weight/weight (wt/wt).
Male albino SD rats, each weighing approximately 250 g, were used for all the experiments, Following the guidelines of the university’s Animal Use and Care Committee (Ref no: UBR/RES/ACUC/001), the animals had free access to water and food
The blood glucose and the lipid profile were measured by using kits from Aggape Diagnostics, Switzerland. Other chemicals were bought from local suppliers and were of analytical reagent (AR) grade. Mild diabetes was induced in rats by injecting alloxan monohydrate (50 mg/kg body weight (BW)) intraperitoneally for two consecutive days. After one week, the blood glucose was measured to confirm diabetes. After the confirmation, rats were kept in the diabetic condition for a week. To induce severe diabetes, we injected 120 mg/kg of alloxan monohydrate one week later. Rats having glucose levels between 125 and 175 mg/ dL once and then checked the glucose level were considered mildly/MD rats while rats having glucose levels higher than 175 mg/dL were considered SD rats.
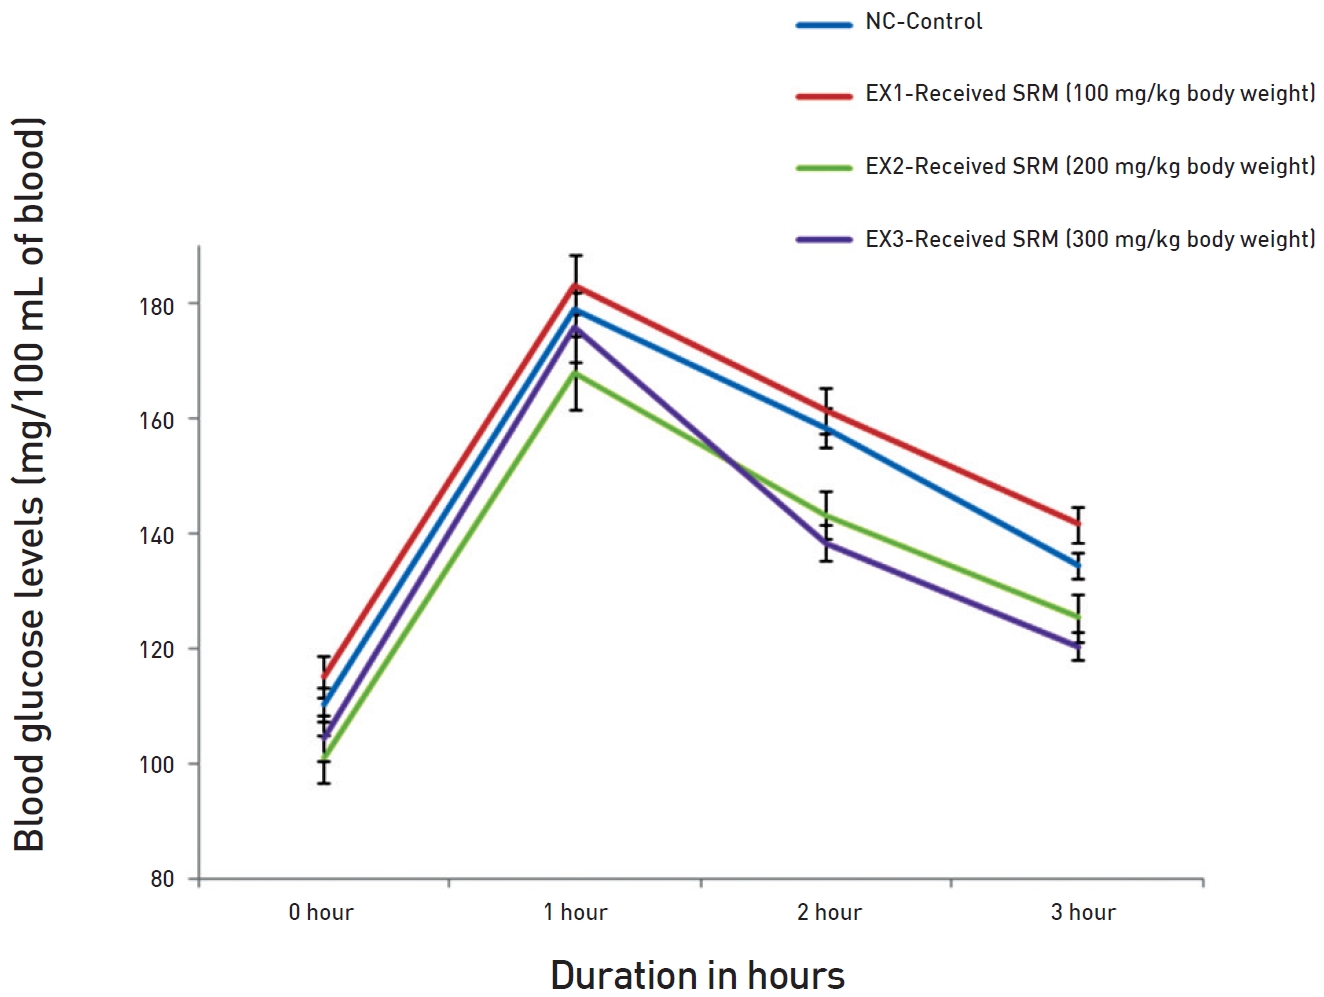
In the first experiment, we investigated the effect of SRM on the oral glucose tolerance tests (OGTTs) in normal rats. For this experiment, 20 male rats were selected and divided into 4 groups of five each: one control group and three experimental groups (EX1, EX2, and EX3). All the rats were denied food and water overnight (for 18 hours). Blood samples were taken from the rats in all four groups before treatment, and their fasting glucose levels were measured with a glucometer. Control rats were administered glucose (2 g/kg BW), and the rats in three EX groups were administered 100, 200 and 300 mg/kg BW of the extract along with glucose at 2 g/kg BW, respectively. All the administrations were oral and done with the help of a syringe and a tube. After the doses had been administered, blood samples were taken at 1 hour intervals for 3 hours, and their blood glucose levels were estimated.
In the second experiment, we investigated the hourly effect of SRM on the glucose levels in diabetic rats. For this experiment, 25 rats (5 normal rats + 10 MD and 10 SD rats) were selected and grouped as follows: The normal control 1 (NC1) group had 5 rats that were administered orally 1 mL of distilled water (DW). The MD control 1 (MDC1) group had 5 rats that were administered orally 1 mL of DW. The MD experimental 1 (MDE1) group had 5 rats that were administered orally 200 mg/kg BW of SRM in 1 mL of DW. The SD control 1 (SDC1) group had 5 rats that were administered orally 1 mL of DW. Finally, the SD experimental 1 (SDE1) group had 5 rats that were administered orally 300 mg/kg bw of SRM in 1 mL of DW. All rats were kept fasting overnight, and blood samples were taken the next day (0 hour), after which the rats were administered extract, followed by blood samples being taken and glucose levels being measured every hour for 6 hours.
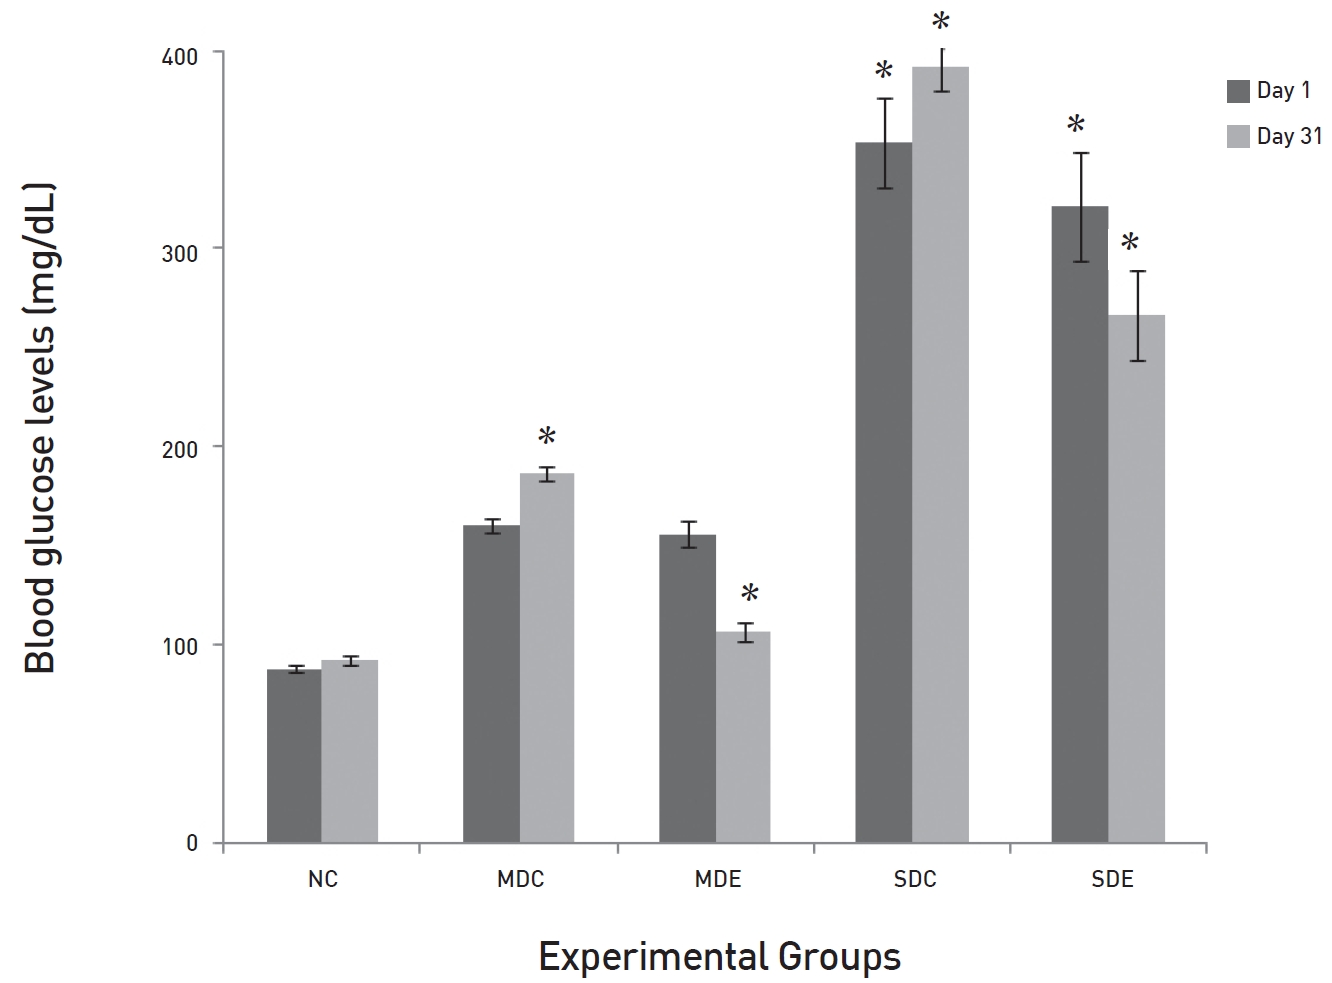
In the third experiment, we investigated the effect of longterm administration of SRM in MD and SD rats. A SRM dose of 200 mg/kg of BW was selected to investigate its effect in MD rats, and a dose of 300 mg/kg BW was selected to investigate the effect in SD rats. For this experiment, 30 (5 normal + 10 MD and 15 SD) rats were taken and divided into 5 groups as follows: The normal control (NC, n = 5), the MD control (MDC, n = 5), and the SD control (SDC, n = 10) groups were administered DW every day. The MD experimental (MDE) group was administered SRM at a dose of 200 mg/kg BW, n = 5) while the SD experimental (SDE) group was administered SRM at a dose of 300 mg/kg BW, n = 5). The experiment lasted for 30 days. At the end of the experiment, rats were sacrificed, and blood was collected from the brachial artery into heparinized vials. Blood was centrifuged, and plasma was separated and kept at — 70°C for biochemical estimates.
Triglycerides (TGs), cholesterol, low-density lipoprotein cholesterol (LDL) and high-density lipoprotein cholesterol (HDL) were measured by using kits bought from Aggape Diagnostic, Switzerland. Methods described in the kits were followed. Thiobarbituric acid reactive substances (TBARS) were estimated by using the method described by Sushmakumari
Reduced glutathione (GSH) was estimated by using the method of Ellman [11]. 5,5-dithiobis 2-nitrobenzoic acid (DTNB) is reduced by the free sulfhydryl group (-SH) of GSH to form one mole of 2-nitro-s-mercaptobenzoic acid per mole of -SH. The released nitrobenzoic acid anion has an intense yellow color and can be used to measure -SH groups by investigating the absorption maximum at 412 nm. The reaction mixture contained 50 μL of serum, 950 μL of DW and 1.5 mL of the precipitating solution. One mL of the mixture was mixed with 4 mL of phosphate solution and 0.5 mL of DTNB. After 5 minutes of standing, the absorbance was measured at 412 nm.
The program used for the data analysis was Sigma Stat (3.1 version, Systat Software, San Jose, CA, U.S.A.). Data were subjected to descriptive statistics, after which the differences among the groups were analyzed by using the one-way analysis of variance (ANOVA), followed by the Holm-Sidak test for comparisons.
The effect of the administrations of the three doses of SRM on the OGTTs in normal rats is demonstrated in (Fig. 1) The result shows that all three doses affected the OGTT curve, but the doses of 200 and 300 mg/kg BW had more pronounced and significant effects than the dose in the EX1 group. In all cases, the glucose levels peaked after 1 hour. Changes were noted in the recovery phases. In the control groups, glucose levels were normalized after the 3 hours, although after the second, the glucose level was starting to move towards normalization. In the EX groups, the patterns of recovery were similar, but the glucose level was lower after the 3 hours. Both the 200 and the 300 mg/ kg BW doses showed significant effects on the OGTTs in normal rats. The normalization was quicker as compared to the EX1 and the normal control (NC) groups. Because of their significant effects on the OGTTs, the dose of 200 mg/ kg BW was selected for MD rats, and the dose of 300 mg/kg BW was selected for SD rats.
The results for the hourly effects of SRM on SD and MD rats are presented in (Table 1) The table shows that both the 200 and the 300 mg/kg BW doses had significant (
The results of long-term administration of the two doses of SRM on the glucose levels in MD and SD rats are presented in (Fig. 2) The results show that SRM extract had significant effects on both the MD (
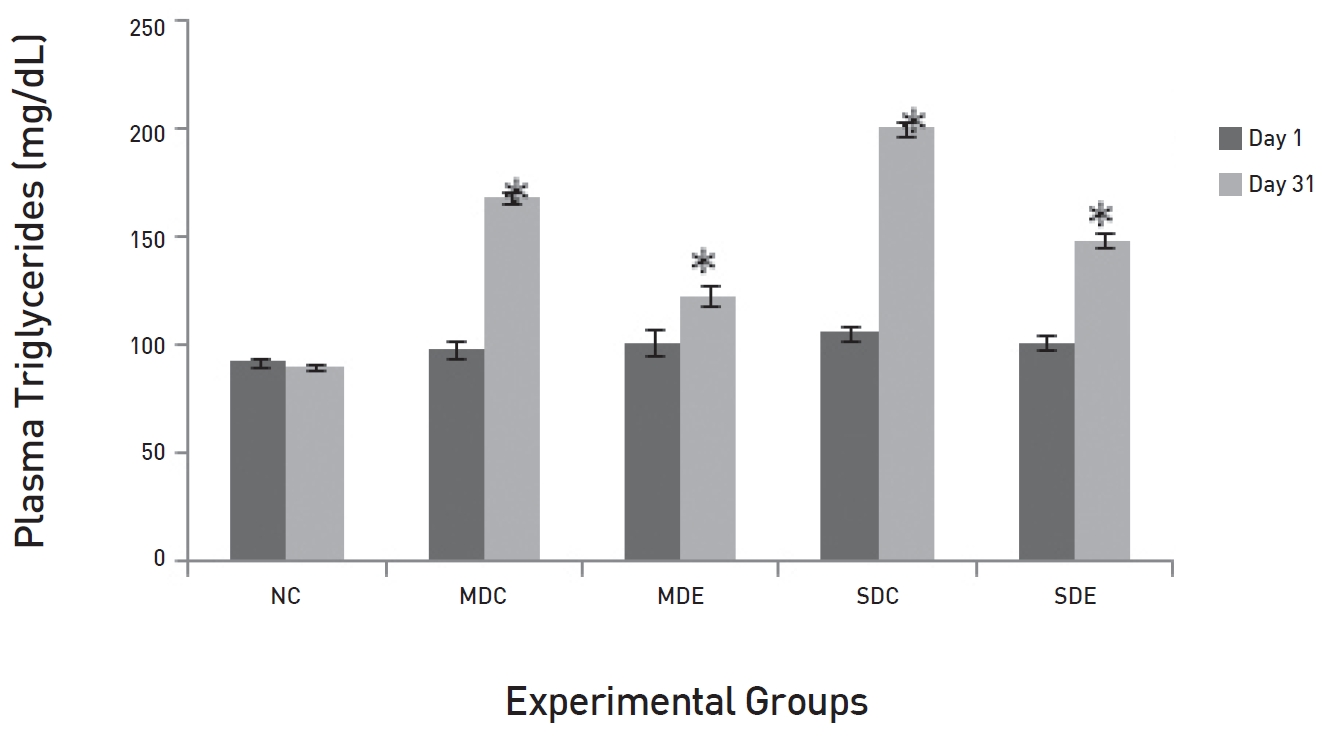
The results of daily administration of SRM on the lipid profile in MD and SD rats are presented in (Figs. 3,4,5,6) (Fig. 3) shows that the TG levels were significantly high (
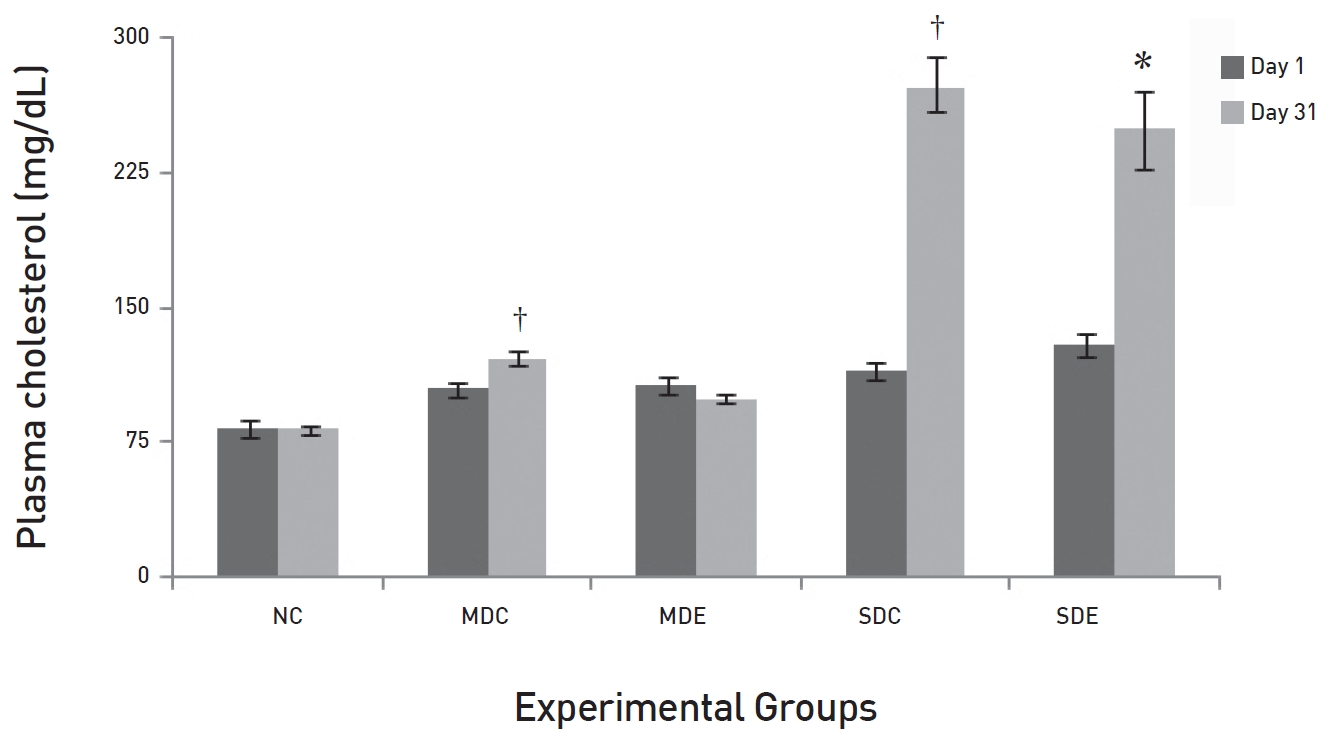
(Fig. 4) shows that the levels of total cholesterol in NC rats on day 31 differed significantly from the levels on day 31 in the MDC and the SDC rats (
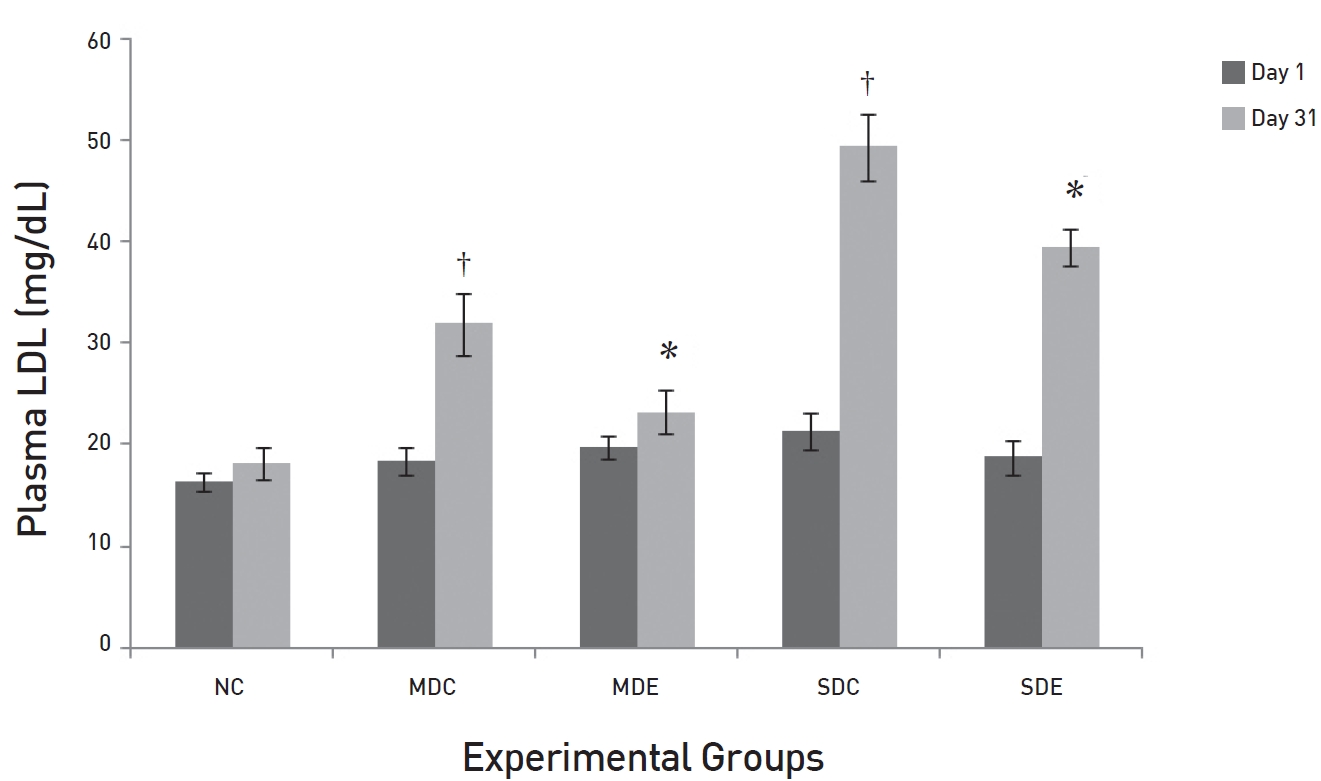
(Fig. 5) shows the effects of SRM on plasma LDL levels. The results are slightly different from those for total cholesterol, but the trends are similar. The levels in both control groups, MDC and SDC, were significantly different from their baseline values. The maximum increase in the level of LDL in the MDC group was 43% higher than the baseline value of 18.4 ± 1.29 mg/dL. In the SDC group, a very large increase was noted. The plasma LDL level increased to 49.47 ± 3.27 mg/dL (
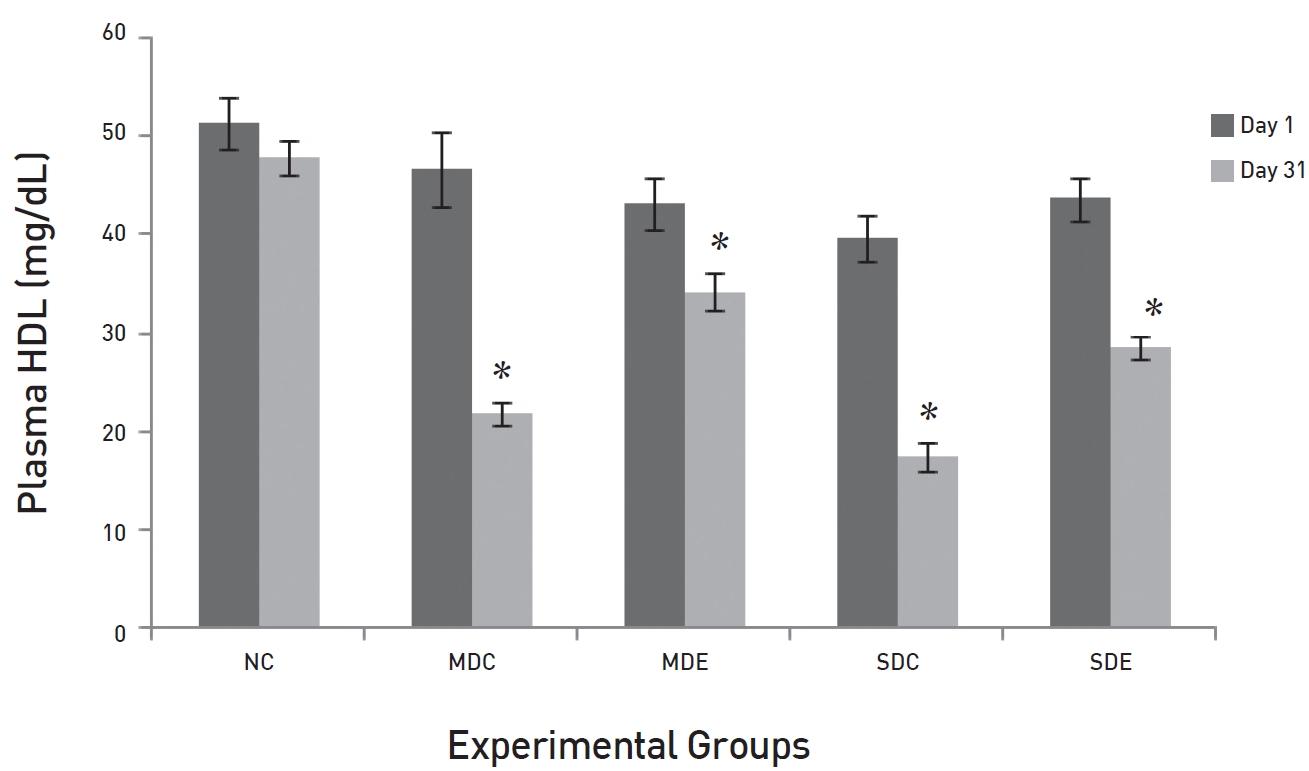
The effects of SRM on the HDL levels in MD and SD rats are presented in (Fig. 6). The fig shows a significant difference between the plasma HDL levels in the NC group and those in EX control groups, SDC and MDC, on day 31 (
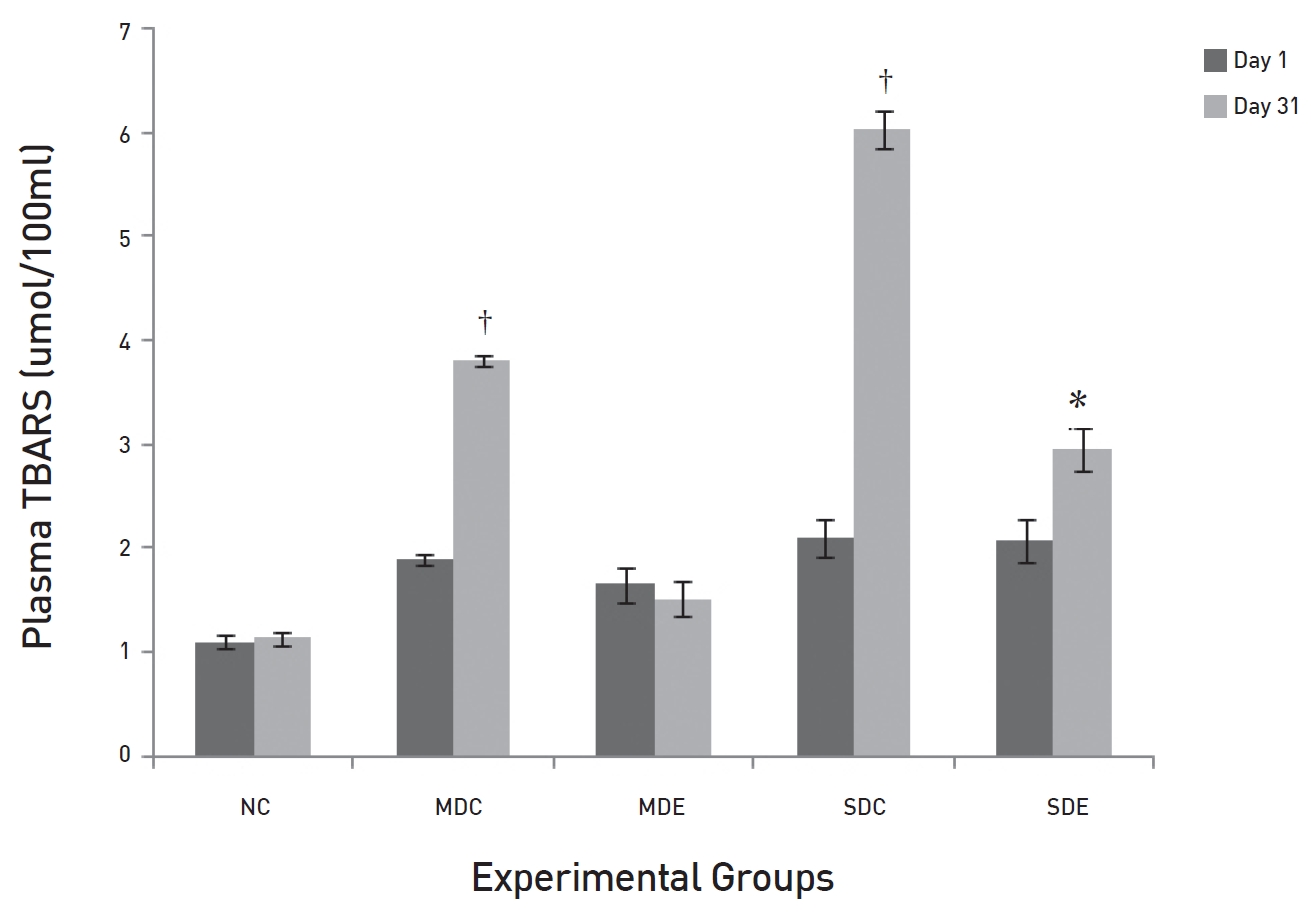
The effects of SRM on TBARS in diabetic rats are demonstrated in (Fig. 7). The fig shows that the levels of TBARS in the MDC and the SDC rats differed significantly on day 31 (
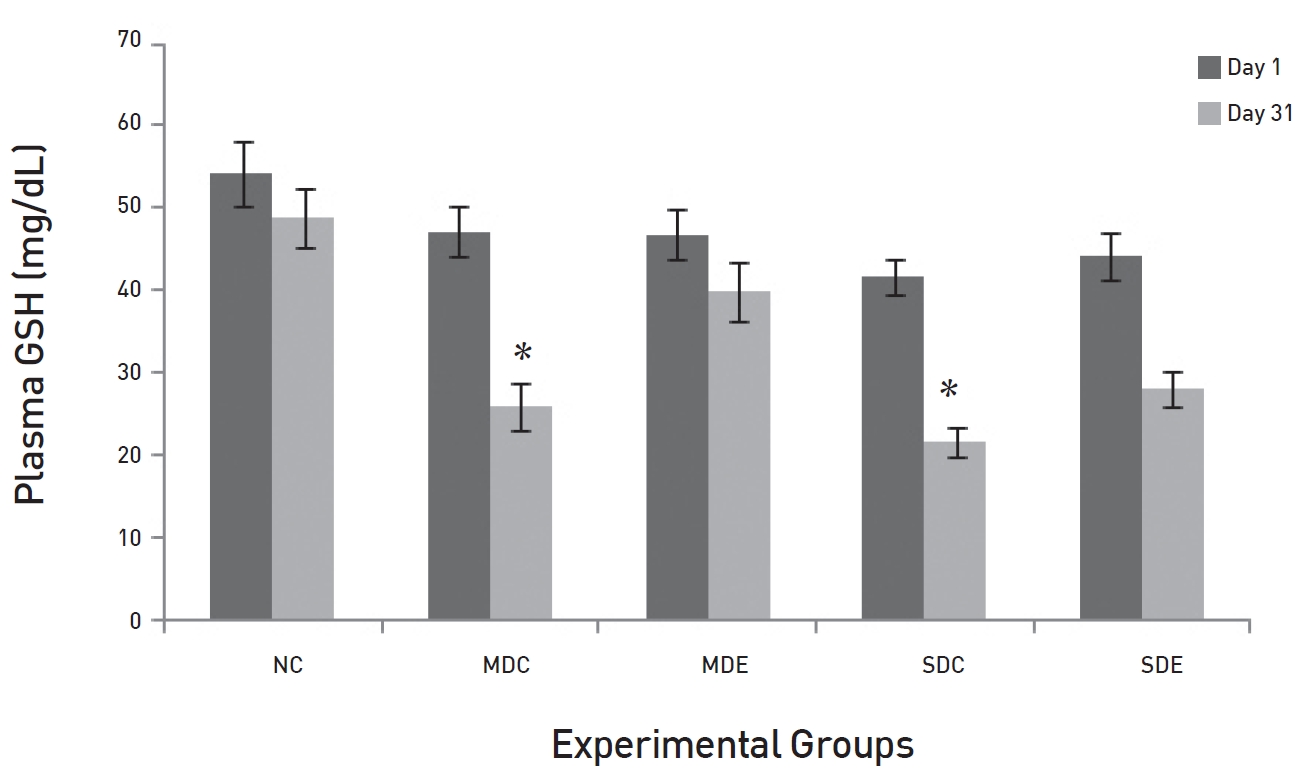
The effects of SRM on GSH in diabetic rats are demonstrated in (Fig. 8). The fig shows that the levels of GSH were maintained in the NC group up to day 31. Levels in the EX controls, MDC and SDC, on day 31 were significantly decreased compared to their baseline levels on day 1 (
At the beginning of the treatment, all the diabetic rats weighed between 230 and 280 g. By the end of the experiment, EX rats in the MDE group had maintained their BW when compared to the SDC and the SDE groups, in which weight loss was noticed.
The present study indicates that SRM has a significant effect on OGTTs conducted in normal rats. The most effective doses were 200 and 300 mg/kg BW. The OGTT curves peaked after 1 hour in the EX groups, just as in the NC. At the 3 hours after SRM treatment, a significant reduction was noted in the EX2 and the EX3 groups as compared to the levels in the NC group. This shows that SRM does not interfere with the absorption of glucose from the intestine. Glucose absorption has a normal time of 1 hour. The non-significant differences among the levels of glucose in the control and the EX groups also support this fact. The significantly low levels of glucose in the EX2 and the EX3 groups indicate the possible involvement of SRM with either insulin release or enhancement of its sensitivity, which might have caused the rapid clearance of glucose from the circulatory system as compared to the control and the EX1 groups. The present study also notes that SRM reduced the glucose levels at 2 hours after its administration in MD rats at a dose of 200 mg/kg and in SD rats at a dose of 300 mg/kg. The effect was more pronounced in the MD rats. Moreover, long-term administration of SRM to diabetic rats resulted in the normalization of glucose levels in MD rats, but not in SD rats. These results are consistent with previous finding [6, 8]. These results indicate that some compounds that enhance glucose clearance from the circulation either by increasing its transport and/ or by enhancing its usage at the cellular level may be present in the extract. The non-significant results in the SD rats might be due to the amount of SRM administered being insufficient to clear the high glucose load in the circulatory system.
The lipid profiles showed similar patterns. The levels of plasma TGs, LDL and cholesterol were very high in the MDC and the SDC groups, but low in the MDE group. In the SDE group, a decrease was noticed, but it was not significant. High levels of postprandial lipids and lipoproteins in the circulatory system are features of diabetes [12] and it happens because of the enhanced lipid absorption and increased production of chylomicron particles in TGs and decreased clearance from the circulatory system [13]. Persistent hyperlipidaemia occurs because of the reduced lipoprotein lipase (LPL) and hepatic lipase (HL)-mediated lipolysis of chylomicrons and very low-density lipoprotein (VLDL) and because of the reduced clearance of LDL in cases of severe diabetes [14]. Non-enzymatic glycosylation of apoprotein B of LDL interferes with specific LDL receptor binding and its transport, hence reducing the clearance of LDL cholesterol [15]. The overall reduction in the LDL level in the MDE group indicates the possibility of active transport of LDL, which could be due to the reduced glycosylation of the LDL molecule caused by glucose levels being normal in these groups. Hence, the clearance of glucose from the circulatory system due to the administration of SRM in MD rats has alleviated the diabetic condition and, hence, improved the dyslipidemic conditions.
Plasma HDL levels were very low in the MDC, SDC and SDE groups, but the levels of HDL were maintained in the MDE group. During diabetic conditions, the levels of TGs and LDL are usually very high with an associated decrease in the HDL level [16]. An increased transfer of cholesterol from HDL to TG-rich lipoproteins and the subsequent transfer of TGs to HDL have been reported in patients with diabetes [17]. Because of the hydrolysis of TG-rich HDL particles by HL, HDL particles are rapidly catabolized and cleared from the plasma. The normal glucose levels in the SRM-treated MDE rats might have reduced the rapid transport of TGs. The normal levels of TGs in the MDE rats also support this fact and could be the reason behind the rising levels of HDL in this group. In the case of SDE rats the opposite must have taken place due to the high glucose levels.
Persistent hyperglycaemia induces glycosylation of macromolecules, and especially of LDL, by a superoxide-dependent pathway and results in oxidative stress [18]. Prolonged oxidative stress can cause diabetic complications because of lipid peroxidation chain reactions [19]. MDA is the end product of lipid peroxidation; hence, the level of MDA is an indication of the degree of lipid peroxidation. In the present study, significant elevations in the levels of MDA were noticed in both the MDC and the SDC rats. The levels of MDA showed marked reduction in the MDE group where rats received SRM treatment. Here, the results showed non-significant differences from the baseline value. Thus, SRM appears not only to reduce glucose levels but also to suppress the oxidative stress that commences because of persistent hyperglycaemia. In the SDE group, the MDA levels were also reduced, but the reduction was not as significant as it was in the MDE group. GSH is a tri-peptide present in all mammalian cells and participates in many metabolic processes for the protection of cells against free radicals and toxic metabolites [20, 21]. The decrease in the levels of reduced GSH represents its increased utilization because of oxidative stress. A significant reduction was noticed in the control groups SDC and MDC. Treatments with SRM in the MDE group resulted in the level of GSH being maintained, but that was not seen in the SDE group; the failure of SRM to do so indicates a high degree of oxidative stress.
Our previous findings and the findings of other reports show that SR extracts, including methanol extracts, have strong free-radical scavenging activity and that they are rich in phenol content. Phenolic compounds are also reported to have anti-diabetic activities [22, 23]. The hypoglycaemic effect of phenols is linked with reduced intestinal absorption of dietary carbohydrates, modulation of the enzymes involved in glucose metabolism, improvement of beta-cell function and insulin action, and their anti-oxidative and anti-inflammatory properties [24]. SRM is also rich in phenols, but the results in the MD rats and the SD rats were not consistent. Possibly, the phenols that are present in SRM only have mild anti-diabetic effects. In the present study, diabetes was induced by using alloxan monohydrate. This compound is reported to damage B cells by generating oxidative stress, and SRM alleviated diabetic conditions. Possibly in the MD rats, the extent of damage might not have been that severe, so SRM with its strong free-radical scavenging properties managed to scavenge the free radicals generated by alloxan and helped the anti-oxidant system to restore its pre-diabetic status. The improvement in the oxidative stress in the MDE rats could be due to the phenol content of the SR extract and its free-radical scavenging activities.
In conclusion SRM ameliorates alloxan induced diabetes in moderately diabetic rats and is unable to produce similar effects in severely diabetic rats.
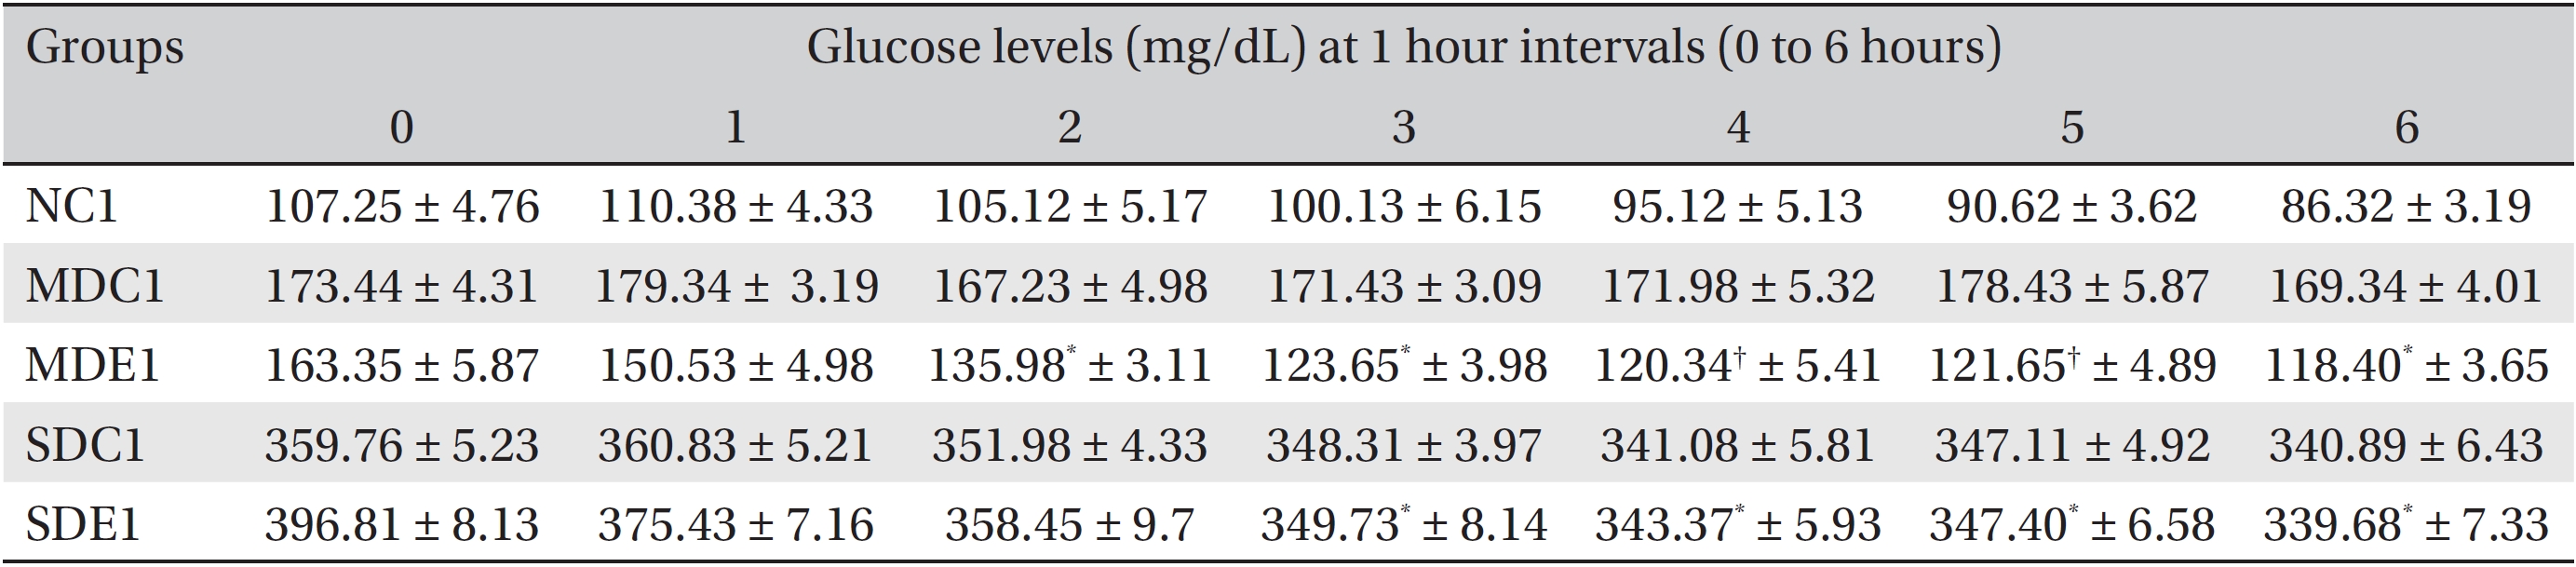
Effects of SRM on the glucose levels in MD and SD rats observed for 6 hours after its administration