This research was conducted to examine the changes in growth and production of Oryza sativa L. cv. Ilmi, which was developed to cultivate high yielding rice variety in the Southern plains of Korea. The seedlings of the rice were cultivated from May to October in 2012 under three different conditions: control, AC-AT, ambient CO2 + ambient temperature; AC-ET, ambient CO2 + elevated temperature; EC-ET, elevated CO2 + elevated temperature. The aboveground biomass, belowground biomass, the total biomass of the rice, and panicle weight per individual were the heaviest in the EC-ET. But, the number of grains per panicle and the weight of one grain was higher at the condition of AC-ET and EC-ET than that of AC-AT. The number of tiller was higher at the condition of AC-AT and AC-ET than that of EC-ET. However, there was no significant difference in the number of panicles per individual and the ripened grain rate among the control and global warming treatments. Crop yield was the highest in the EC-ET. This result means that the global warming condition should be considered in the selection of suitable paddy field for the limibyeo in the future.
The major cause of global warming is the elevated CO2 concentration as a result of human activities (Kobayashi 2006). The average temperature of the earth was increased by 0.6℃ over the last century and global warming is accelerating at a rate of 0.74℃ per annum (IPCC 2007). The Korean peninsula is not an exception for the climate change which is caused by global warming. The average CO2 concentration of Korean peninsula in 2012 is 394.5ppm. It is increased by 23.8 ppm from 370.7 ppm, the average CO2 concentration of 1999 (Korea Meteorological Administration 2010). The temperature was increased approximately by 1.7℃ over the past 97 years (1912-2009) (IPCC 2007).
On the other hand, the climatic value of crop fields has a close relationship with agricultural production. The production of crops in the temperate region increases if the temperature increases by 1-3℃. But the production decreases if the temperature increases beyond that range (IPCC 2007). Such climate change has a significant influence on the growth of crops. The climate condition has to adequately satisfy the growth phases of the crops because the initiation and growth of the crop’s flower or fruit can be affected by leading to decrease in the production of crops (Lee et al. 2008). Currently, the global warming is affecting the production of beans, rice, and wheat which are the main crops produced worldwide (Lobell and Field 2007) and it has a significant influence on the growth of rice, the staple food in the Northeast Asia (Jagadish et al. 2007, Lee and Lee 2008, Fan et al. 2010).
There are various research studies being carried out globally on the effect of elevated CO2 concentration and temperature on the growth and production of rice (Razzaque et al. 2009). The panicle and grain weight was increased by 23-72% due to the climate change (Imai et al. 1985). In addition, aboveground and belowground biomass increased during the growing period due to the elevated level of CO2 concentration (De Costa et al. 2003). However, the other researchers proved that the climate change decreases the growth and production of rice (Baker et al. 1992). Matsui and Omasa (2002) proved that elevated temperature deters straight head, flowering anthesis and production of panicles.
The effects of global warming on the production of rice are diverse and extent along with the rice variety. Therefore, the selection of rice variety, global warming conditions with elevated CO2 concentration, and the environment with treated temperature are essential for the experiment in order to predict the accurate effect of the climate change on rice.
Hence, this research was conducted to examine the changes in growth and production of
The rice variety selected for this experiment was
>
Cultivation and global warming handling
In May 2012, the rice (
The rice seedlings were kept in the tank at a water level of 3 cm afterwards. The seedlings were usually watered every second day with same quantity (1.5 L), but they were watered every day during the period of high transpiration. The soil used in the rice cultivation was obtained from the rice paddy fields of the Geum river basin which was dried in the shade. It was a sandy clay loam with high soil organic matter content (10%).
The warming experiment was conducted in the glasshouse where the light could enter directly. The glasshouse unlike chambers is not restricted by space and it can create a realistic natural environment for the plant growth by utilizing the natural light, photoperiod, and soil environment. Therefore, the glasshouse has an advantage of being able to examine more realistic responses from plants at elevated CO2 concentration and temperature (Kim and You 2010).
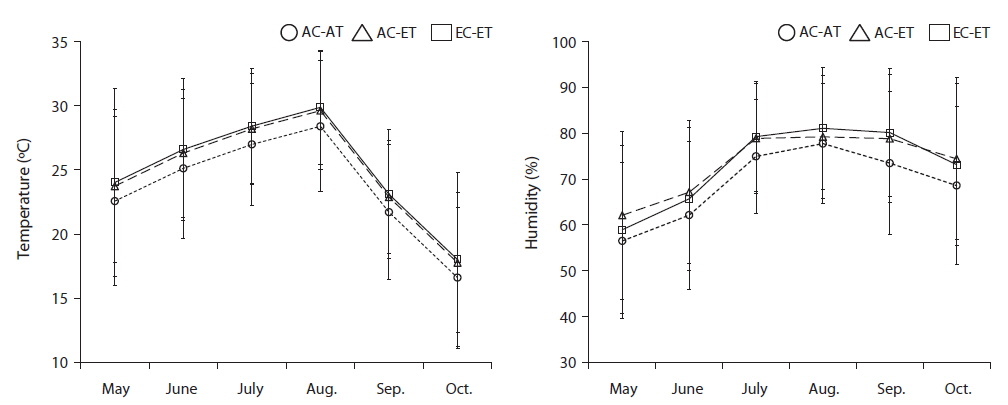
The control (ambient CO2 + ambient temperature as AC-AT) was reflected by present air CO2 concentration and temperature. Temperature of the treatment (ambient CO2 + elevated temperature as AC-ET) was maintained high about 1.5℃ than the control (AC-AT) by using the ventilator. Because, Korean Peninsula’s temperature has been increased by 1.7℃ for 97 years, from 1912 to 2009, and it is twice by global average temperature (Ministry of Environment 2012). CO2 concentration of the treatment (elevated CO2 + elevated temperature as EC-ET) was maintained by 750-800 ppm based on Global Warming B1 scenario (IPCC 2007). In the measured results for average monthly temperature, AC-AT was average 23.5℃, and the mean temperature in AC-ET and EC-ET was about 1.5-2℃ higher than the control. CO2 concentration of AC-AT and AC-ET was 360-400 ppm and EC-ET was 740-750 ppm (Fig. 1).
The CO2 of the EC-ET was released through a plastic tube which has two holes in it after installing two CO2 tanks in the glasshouse. The maintenance of CO2 concentration in the treatment was controlled by using environment measure system (LCSEMS; PARUS Co, Cheonan-si, Korea) (Lee et al. 2014). Also ventilation device (DVN-600B; Dongkun-Industrial Co, Incheon-si, Korea) was used for the temperature control of EC-ET.
>
Measurement of growth and reproduction
The ecological response was examined by measuring the weight of the

The statistical significance was tested by using analysis of variance (ANOVA) on the mean differences among the treatments in order to examine the different growth responses of the rice depending on the global warming treatment. The significance of the differences among the treatments was calculated by using the mean value of Fisher’s LSD according to post-hoc test.
The results were analysed by principal component analysis (PCA) using the character of mean values as the correlation coefficient in order to examine the overall ecological responses by
>
Growth and reproduction response
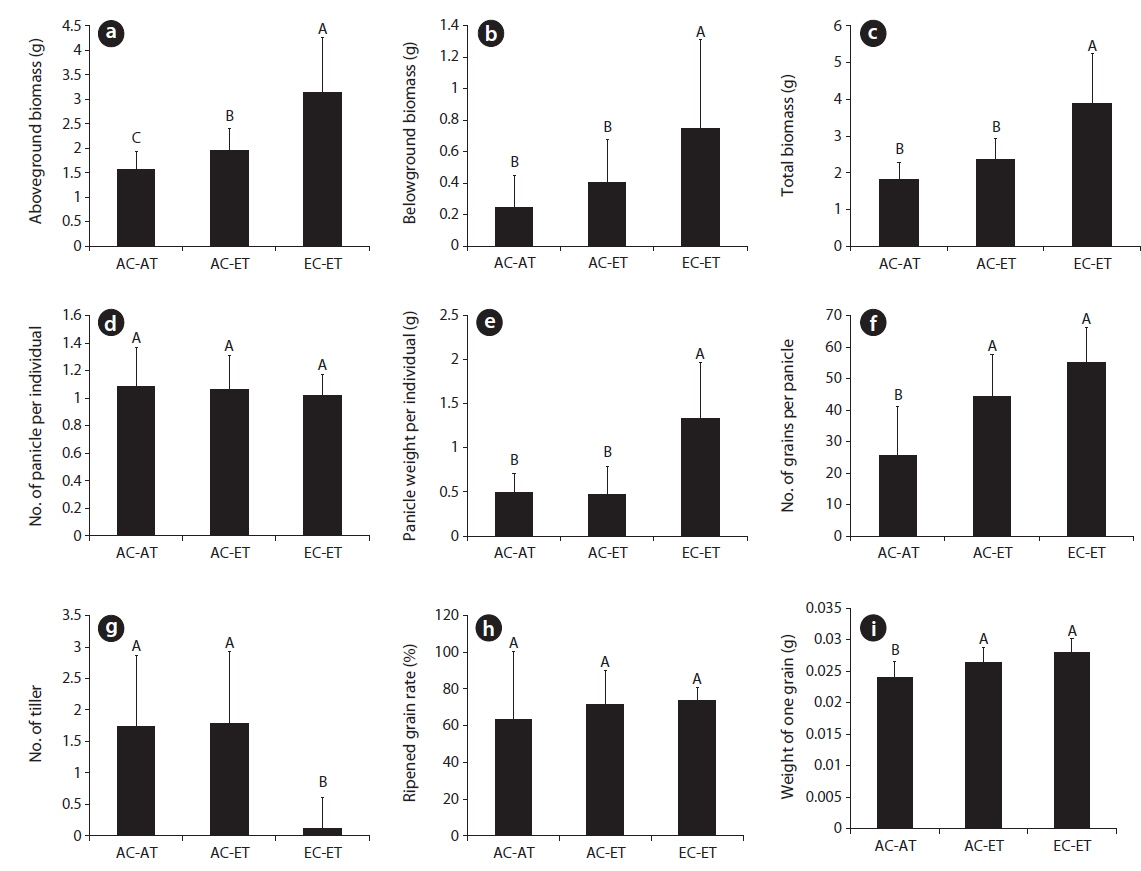
The aboveground biomass (g) was the highest in following order: EC-ET, AC-ET and AC-AT (Fig. 2a). The belowground biomass (g) and total biomass (g) were higher in EC-ET than in AC-AT and AC-ET (Fig. 2b and 2c). The aboveground biomass increased by 24.8% more than the AC-AT when only the temperature was elevated but there were no differences in the belowground biomass (g) and total biomass (g). The aboveground biomass (g) increased by 100.5%, belowground biomass (g) by 205.5%, and total biomass (g) by 114.7% than the AC-AT when both CO2 concentration and temperature were elevated.
The panicle weight per individual (g) was the highest in EC-ET (Fig. 2e). There were no differences in the panicle weight per individual in AC-ET, but it increased by 174% in EC-ET.
The number of grains per panicle (ea) and weight of one grain (g) were the heaviest in AC-ET and EC-ET (Fig. 2f and 2i). The number of grains per panicle (ea) and weight of one grain (g) increased by 72.2% and 10.4% in AC-ET. But they increased by 115.6% and 16.5% in EC-ET.
The number of tiller was the highest in AC-AT and AC-ET (Fig. 2g). The number of tiller showed no difference with the control in AC-ET. But it decreased by 93.5% in EC-ET.
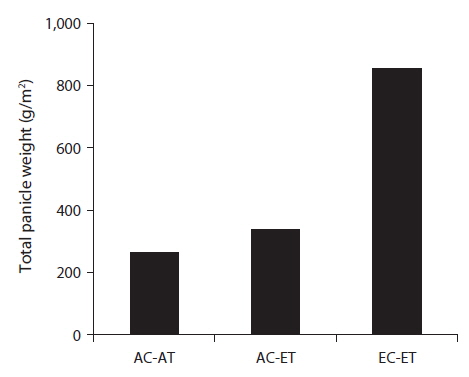
The number of panicles per individual (ea) and ripened grain rate (%) did not show much difference between the control and treatments treated with experimental warming (Fig. 2d and 2h). The total panicle weight was 263.4 g/m2, 336.9 g/m2 and 854.7 g/m2 in AC-AT, AC-ET and EC-ET (Fig. 3), respectively.
>
Principal component analysis
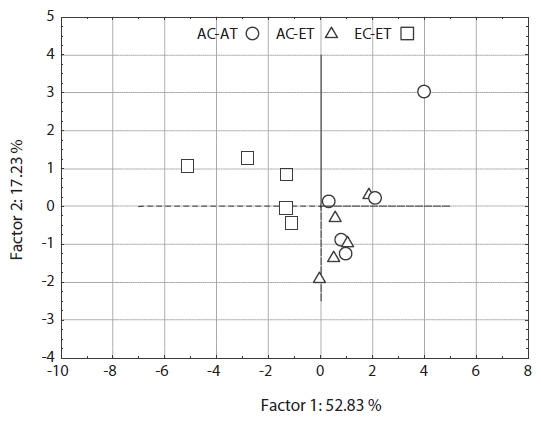
The result in the AC-ET showed the least variation, but the control and EC-ET showed a relatively wide distribution of individuals with regards to the overall response of
There were no significant correlations characteristics influencing the distribution of the arrangement method according to the global warming treatment of
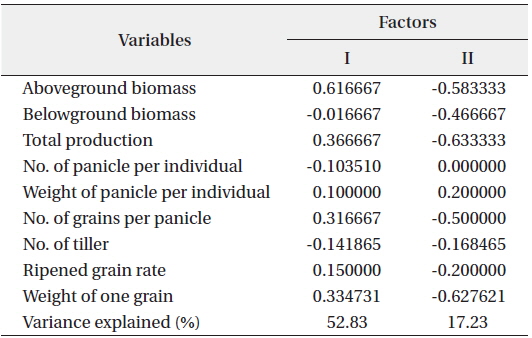
Correlation matrix of 9 ecological response variables with the first two principal component scores of principal component analysis (PCA) analysis
By examining the overall experiment, when only the temperature was elevated, the aboveground biomass (Fig. 2a) of
The total biomass (Fig. 2c) of ‘Ilmibyeo’ increased due to the increase in the aboveground (Fig. 2a) and belowground biomass (Fig. 2b) when both CO2 concentration and temperature were elevated. In same condition, the total biomass of ‘Dongjinbyeo’ increased by 18% (Thang 2008) and the total biomass of ‘Odaebyeo’ increased due to the increase in the aboveground and belowground biomass (Lee et al. 2014). However, there were no effects on the aboveground, belowground, and total biomass of ‘Saechucheongbyeo’ (Lee et al. 2014).
It seemed that partial and total biomass of ‘Ilmibyeo’ increased (Fig. 2) when both CO2 concentration and temperature were elevated because the production of organic nutrients and tropical crop’s photosynthesis increased due to higher CO2 concentration (Yang et al. 2006). Also, in the PCA, the AC-AT and AC-ET partially overlapped, but AC-AT and AC-ET did not overlap. One could see that
Thus, ‘Ilmibyeo’ will have a healthy growth response and grow well even when both CO2 concentration and temperature are elevated due to the climate change in the process of global warming and the rice varieties called ‘Odaebyeo’ and ‘Ilmibyeo’ cultivated in the Northerns and in the Southern regions may more grow than that called ‘Saechucheongbyeo’ cultivated in the central regions.
There were no difference in the number of panicles per individual among the control and global warming treatments (Fig. 2d) and the number of tiller was the highest in the AC-AT and AC-ET (Fig. 2g). The number of panicles are affected by the surrounding environment of the period when grains are produced from the time it is transplanted in the paddy fields (Lee and Lee 2008). It was observed in the present study that the number of panicles and tillers of
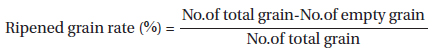
The number of grains per panicle is determined by the number of empty grains among the number of ripened grains and the weight of one grain is affected by the environmental conditions of the ripening period from the time when panicles develop (Lee and Lee 2008). It seems that the weight of one grain of
Also, the empty grains increase when the temperature becomes too high during the ripening period. It has been reported that the temperature range of 23-35℃ is suitable for the grain to ripe but the temperature above 35℃ causes low ripened grain rate due to high number of empty grains as grains do not ripe (Xiao et al. 2005). It can be interpreted that such results in this research were obtained because treated temperature was within the range (23-35℃).
The crop yield, in this research, was defined as the sum of all the panicle weight per individual. It is important to maintain the following four elements high in order to increase the crop yield because it is determined by the number of panicles per individual, the number of grains per panicle, the weight of one grain, and ripened grain rate (Park et al. 2006).
Generally, the elevation of CO2 concentration increases the crop yield of rice. But the number of panicles per individual was unrelated to the increase of the crop yield in this research (Fig. 2d) unlike the results (Baker et al. 1992, Yang et al. 2007, Thang 2008) which state that the reason for the increase of crop yield is due to the increase in the number of panicles.
There is a high mutual relation between the average temperature of six weeks before the heading period and the number of grains (Suzuki 1980, Lee 2010). If the average temperature during that period increases and CO2 concentration (Xiao et al. 2005), temperature during the panicle initiation stage is high, the number of grains decreases (Suzuki 1980, Lee 2010). However,
The control had 263.4 kg/10a, AC-ET had 336.9 kg/10a and EC-ET had 854.7 kg/10a when the result (Fig. 3) was used to calculate the weight (kg) per 10a, which is used as general agricultural and fishery statistics unit. It means that there was a 27% increase in kg/ha than the control when only the temperature was elevated and 224.5% increase in kg/ha when both CO2 concentration and temperature were elevated (Fig. 3).
According to the research, crop yield of rice is expected to decrease by less than 2% in the normal climatic environment and present crop yield will decrease by 20-30% if global warming continues causing the increase in temperature during the ripening period (Yun 1990, Yun et al. 2001). But, the increase in crop production under the global warming condition in this research showed a different result from what was originally expected. The contrasting result as such under the global warming condition provides a meaningful implication on the selection of cultivation regions of rice in the future.
The Korean peninsula has a temperate climate at present, but it is anticipated that it will shift to subtropical climate (Ministry of Environment 2012). As the crop period (period with average daily temperature of more than 15℃) increased from 25 days to 27 days due to the effect of global warming in the Korean peninsula, the cultivation region of early maturing rice moved from Northerncentral mid-mountainous areas and Northern inland plains to Central plains and Southern mid-mountainous areas which are the cultivation region of mid-maturing rice. In addition, the cultivation region of mid-maturing rice moved to the Southern plain which is the cultivation region of late variety and it is expected that the cultivation of early maturing rice can be attempted in the Northern mountainous areas beyond Northern limit line (Yun et al. 2001).
Moreover, this phenomenon is occurring in the other crops (Ministry of Environment 2014). The suitable harvest region of ‘Hallabong,’ which was only harvested in Jeju island in 1980s, has now moved North up to Gimje in Jeonllabuk-do, peach from Cheongdo, Gyeongsangbukdo has moved up to Paju, Gyeonggi-do, and grapes from Gyeongsan, Gyeongsangbuk-do has moved up to Yeongwol, Gangwon-do. Furthermore, the suitable harvest region of melon from Gokseong, Jeonllanam-do has also expanded to Yanggu, Gangwon-do (Ministry of Environment 2014). The crop map is changing completely as the climate of the Korean peninsula is changing (Ministry of Environment 2014). One can expect that there will be a big change according to the rice variety and cultivation method even though the rice can be cultivated in the entire region of the Korean peninsula as a high temperature crop (Lee et al. 2014).
At present, it is widely cultivated as a recommended cultivar in the Southern plains of Korea (Lim et al. 1996). Its yield was not decreased and its growth also was not affected by decreasing temperature (Lim et al. 1996). In addition, it is relatively strong against diseases but it is weak against pests (Lim et al. 1996). It seems that ‘Saechucheongbyeo’ and ‘Odaebyeo’ can be cultivated even further up in the North than the current region (Lee et al. 2014), and it will also become possible for ‘Ilmibyeo’, which was used in this research, to be cultivated further up in the Northern region than the current region. The global warming condition should be considered in the selection of suitable field for the rice variety in the future because such anticipations can be applied to a diverse range of rice varieties selected and cultivated according to different regions.
It is expected that the yield of ‘Ilmibyeo’ cultivated in the Southern regions will increase even more than the present yield if the temperature and CO2 concentration are elevated at the same time due to the global warming effect.