Ecological health/risk assessments in stream ecosystems have been partially conducted by several research approaches from micro-level biomarkers of DNA (Singh et al. 1988), cellular (Adams and Greeley 2000), physiological (Barbour et al. 1999) and histopathological assays (Adams 2002) to macro-level bioindicators of individual (Goede and Barton 1990, Anderson and Neumann 1996), population (Munkittrick et al. 2000) and community levels (Barbour et al. 1999). For these researches, three trophic levels of key organisms such as periphyton (primary producer), macroinvertebrate (primary consumer) and fish (top consumer) were used for the assessments, and fish indicators were most widely used in the world (Lang et al. 1989, Plafkin et al. 1989, Kelly and Whitton 1995, Lang and Reymond 1995, Kelly et al. 1998). Major limitation of these studies is that single indicator or single model was applied in most studies (Adams and Greeley 2000). The health assessments, thus, were partially evaluated in extreme levels of DNA level or community level rather than a general wide-range levels in the ecosystems.
Standardization and protocols of stream health assessments have nationally been adopted in United States Environmental Protection Agency (US EPA) and European Union (EU). US EPA developed a new methodology of stream health assessments using various biota including fish, which is Rapid Bioassessment Protocol (RBP) based on the high-levels of biological organization approach of fish community (Barbour et al. 1999, US EPA 2002). Similarly, Water Framework Directive (WFD) in the European Union (EU) also adopted the multi-metric bioassessment models using fish assemblages for an effective management and conservation (Water Framework Directive 2000). These bioassessment models become a worldwide methodology for health assessments of aquatic environments including Canada, France, United Kingdom, Australia, Japan and China, and so on (Karr and Dionne 1991, Oberdorff and Porcher 1994, Koizumi and Matsumiya 1997, Karr and Chu 2000). These studies of US EPA and EU were mainly based on macro-level researches of community-levels.
In the meantime, Adams (2002) pointed out that community- level assessment models show slow response against water pollution and can only identify the condition which pollution proceed over some serious levels as ecological significance. Thus, numerous stream health assessments have been fulfilled in the population (Munkittrick et al. 2000) and community levels (Barbour et al. 1999). Munkittrick and Dixon (1989) developed a biomonitoring framework using the population level responses and reviewed the responses of a wide variety of fish population changes in eutrophication, acidification, predation pressure and industrial wastes using published data. Particularly, fish population can be used to assess long-term damage with environmental modification, population growth, obesity and fish conditions using the indices such as length-weight relationship and condition factor (CF) for the understanding of population dynamics (Munkittrick and Dixon 1989). These indicators were applied to provide information on size distributions and energy flow (expenditure and storage), which can be used to assess the health of the fish populations (Munkittrick et al. 2000). Therefore, fish populations and communities were known as good indicators of stream ecosystem health assessment because they reflect varied anthropogenic disturbances, including nutrient enrichment (Finney et al. 2000, Attrill and Power 2002), and toxic pollution (Robinet and Feunteun 2002).
Despite of such numerous advantages in population and community-level assessments, still micro-level researches were required in the health assessments. The uses of only population or community-level could not identify the potential effects on physiological, cellular, and molecular levels of organisms. Adams and Greeley (2000) pointed out that inputs of industrial and urban wastewater had an effect on wide-range biological responses from low-levels of biological organization such as cells, tissues, organs, and individuals to high-levels such as populations and communities (Peakall and Walker 1994). Hence, biological responses of cellular, physiological, and molecular levels may not directly affect the health of population and community levels, but are potentially influenced on chemical pollutants and disturbance (Schmitt and Dethloff 2000, Triebskorn et al. 2001). Microlevel biomarkers have developed and proved to be a useful tool in identifying early biological changes caused by environmental pollutions. These biomarkers are defined as sensitive, measurable, xenobiotically induced in biochemical processes such as enzyme activity (Peakall and Shugart 1992). In addition, the use of biomarkers provides various information that cannot be obtained from chemical analysis of pollutants and reflects impacts of chemical mixtures for long exposure periods (Lam and Gray 2003). Also, this approach discerns pollutant impacts in early time after emission has started, and responds to low concentration value of pollutants (Van Gestel and Van Brummelen 1996). Therefore, the low-level approach has been often used as a pre-warning or early-warning tool for environmental supervision in aquatic ecosystems and applied extensively to polluted urban streams (Lam and Gray 2003).
These biological responses of low-level biomarkers may not directly affect the health of population and community (Schmitt and Dethloff 2000, Triebskorn et al. 2001). Therefore, for stream health assessment, it is necessary to develop the integrated stream health assessment approach from the DNA-level biomarkers to communitylevel bioindicators in aquatic ecosystem assessment (Karr 1981, Gore 1985, Brookes and Shields, 1996). Because these integrative health assessment includes biomarkers and bioindicators, it has various advantages such as worthwhile information that cannot be obtained from chemical analysis of pollutants, effects of chemical mixtures over long periods (Lam and Gray 2003), and the integrated effects of various environmental stressors on the health of individuals, populations, and communities (McCarty et al. 2002, Van der Oost et al. 2003). Moreover, these assessments reflected from the long-term response of bioindicators such as individual, population and community level parameters to the short-term responses of various biomarkers such as molecular, cellular, physiological, histopathological parameters. Therefore, it is possible to provide the pre-warning alarm systems for the aquatic ecosystem health assessments (Lam and Gray 2003, Wepener et al. 2005). In other worlds, this new integrative methodology can be used as a warning tool for predicting and diagnosing the overall ecological health of urban streams, which are largely influenced by toxic chemicals and nutrient enrichment.
The objectives of this research were to assess integrative ecological stream health using both biomarkers of blood tissue and histopathological parameters and bioindicators of individual, population and community parameters in two different streams.
>
Sampling sites and point sources
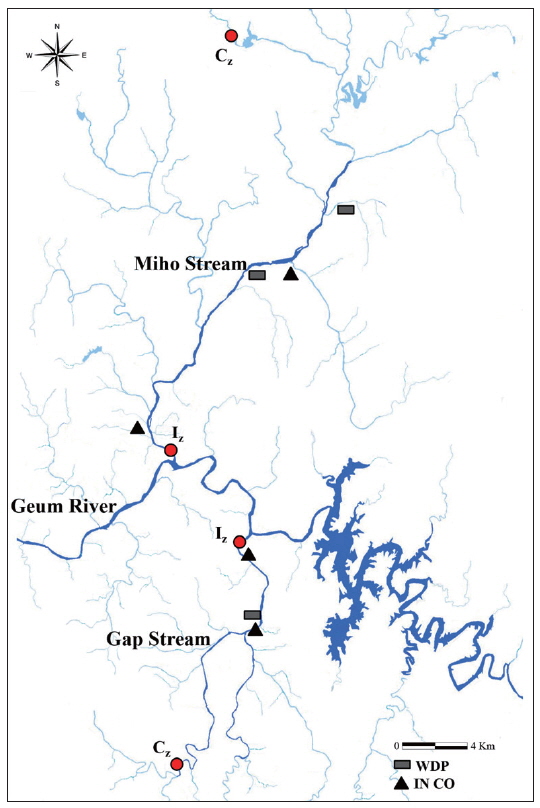
The sampling was conducted every month at two urban streams of Gap Stream (GS) and Miho Stream (MS) during 2013 to 2014 (Fig. 1). Gap Stream is one of main tributaries in Geum River watershed and located in the middle of Daejeon city. Two sampling zones of upstream (control zone, Cz) and downstream regions (impacted zone, Iz) were selected depending on the locations of point sources within the watershed. The Cz is mainly surrounded by forest (> about 65 %), whereas the Iz is largely influenced by Daejeon industrial complex and wastewater disposal plant (WDP). The effluents from the WDP discharged 9 × 10⁵ m3/day and went to the Iz of Gap Stream directly. Miho Stream is also one of main tributaries in Geum River watershed and is located in the Cheongju city of North Chungcheong province. In the Miho Stream, the Cz is surrounded by forest (> 55.5%), whereas the Iz is largely influenced by the complex for agriculture industry complex, WDP with effluents of 2.8 × 10⁴ and 8 × 10³ m3/day from Cheongju and Naesu, respectively.
>
Sampling methods and sampling gears
Fish sampling, based on the catch per unit effort (CPUE; Ohio EPA 1989), was conducted at the sampling sites and all habitats of riffle, run and pool were included in the sampling zones. Stream distance sampled was 200 m and the sampling time passed was 60 min. The fish was captured using sampling gears such as cast net (mesh size: 7 × 7 mm) and kick net (mesh size: 4 × 4 mm). Fish species were identified using keys of Nelson (1994) and Kim and Park (2002), examined for external abnormalities (deformities, erosion, lesion and tumors) based on the criteria of Sanders et al. (1999), and classified into the order of trophic guild as omnivores, insectivores, carnivores and herbivores and tolerance guild as tolerant, intermediate and sensitive species, based on the previous regional studies (An et al. 2004). Sampled fishes returned to their natural habitats except two habitat-type species,
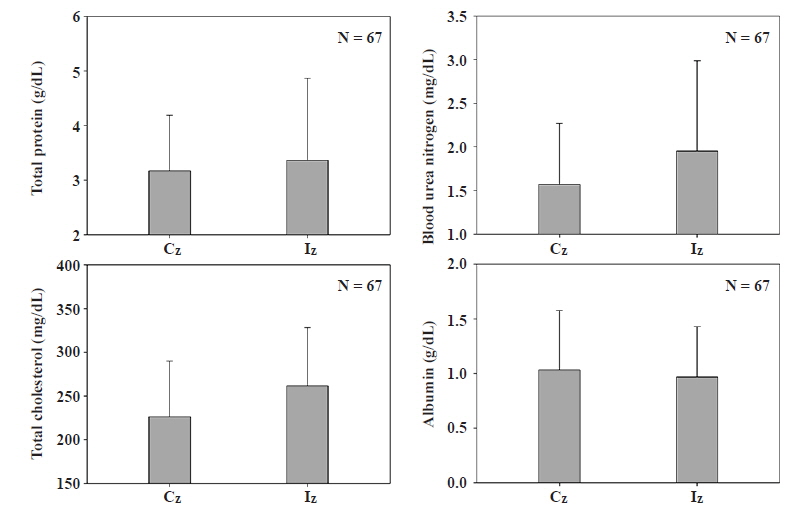
After the fish sampling, the fishes were befuddled in the ice, total length and weight were measured, and then blood samples for analysis of blood chemistry were prepared. Blood samples (30 μL) were obtained from caudal artery of two sentinel habitat-type fishes by incision of the caudal peduncle using capillary tubes. The blood samples were analyzed by Automated Biochemical Analyzer (SpotchemTM EZ, ARKRAY, model SP-4430, Japan), and the analyzed parameters were total protein (TPro), blood urea nitrogen (BUN), total cholesterol (TCho), and albumin (Alb).
>
Total mercury analysis of fish tissues
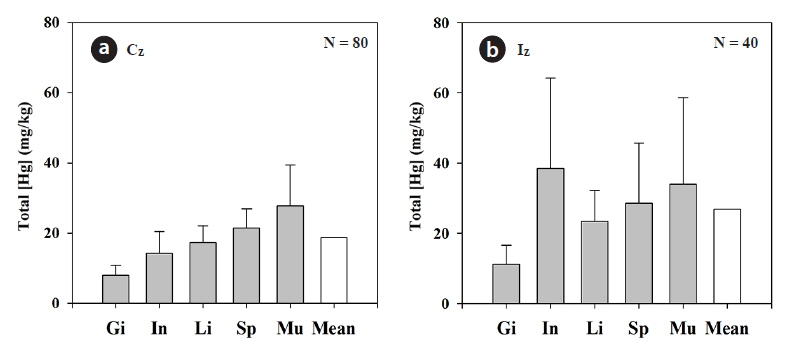
Concentrations of total mercury (total [Hg]) were analyzed from fish tissues (gill, intestine, liver, spine and muscle) by Direct Mercury Analyzer (DMA-80; Milestone Inc., Italy, US EPA Method 7473). The samples of gill (Gi), intestine (In), liver (Li), spine (Sp) and muscle (Mu) were initially dried in the oxygen stream passing through a quartz tube located inside a controlled heating coil under the condition of oxygen supplies as a carrier gas to each cylinder. The combustion gases were further decomposed on a catalytic column at 750℃. Mercury vapor was collected on gold amalgamation traps and subsequently desorbed for quantification. Thus, the mercury levels were determined using a single beam spectrophotometer with two sequential, flow-through measurement cells under the condition of 254 nm. The light source for the spectrophotometer was a low pressure mercury vapor lamp and the silicon UV photo-detector was used for the analysis.
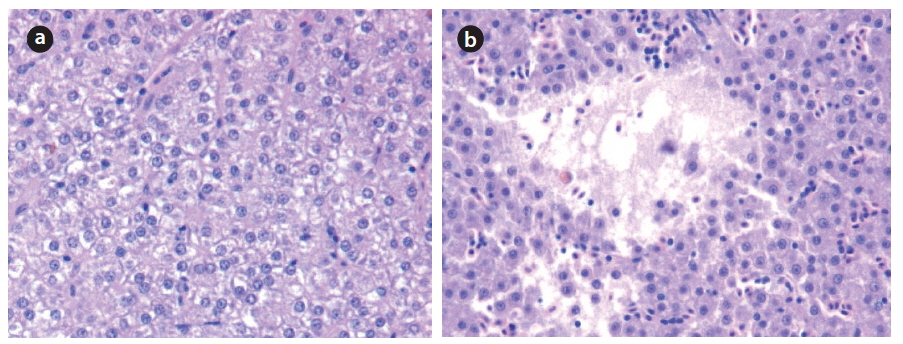
Histopathological analysis of fish liver tissue was conducted by the paraffin methods of Mela et al. (2007). After the liver tissue samples were fixed with 4% paraformaldehyde solution, the samples were treated with ethanol, xylene and paraffin, in turn. And then, liver tissue in paraffin wax was cut into a thickness of 4 μm. The cross section of liver tissue was fixed on slide glass, and each section was stained with hematoxylin-eosin (H&E).
Spatial patterns of total nitrogen (TN), total phosphorus (TP), biological oxygen demand (BOD), and chemical oxygen demand (COD) during 2012 to 2014 were analyzed using the data obtained from the Ministry of Environment, Korea (MEK).
Species Biotic Index (SBI) was based on a fish assemblage and the tolerance score of each fish species. Tolerance ranks on each fish species were obtained from the approach of Species Biotic Index (An and Kim 2007). The fish tolerant scores (FTSs) for all other species distributed in Korea were used for analysis. The equation of SBI is as follows;
Values of SBI = Σ ni * ti / N [N = total number of individual; ni = total number of each species; ti = tolerance value of each species]
Each value was categorized as 7 criteria, which is based on the rank values of Hilsenhoff (1988). The ranks of 0.00 - 3.75, 3.76 - 4.25, 4.26 - 5.00, 5.01 - 5.75, 5.76 - 6.50, 6.51 - 7.25, and 7.26 - 10.00 were classified as “Excellent”, “Very good”, “Good”, “Fair”, “Fairly poor”, “Poor” and “Very poor”, respectively.
>
Population recruitment analysis
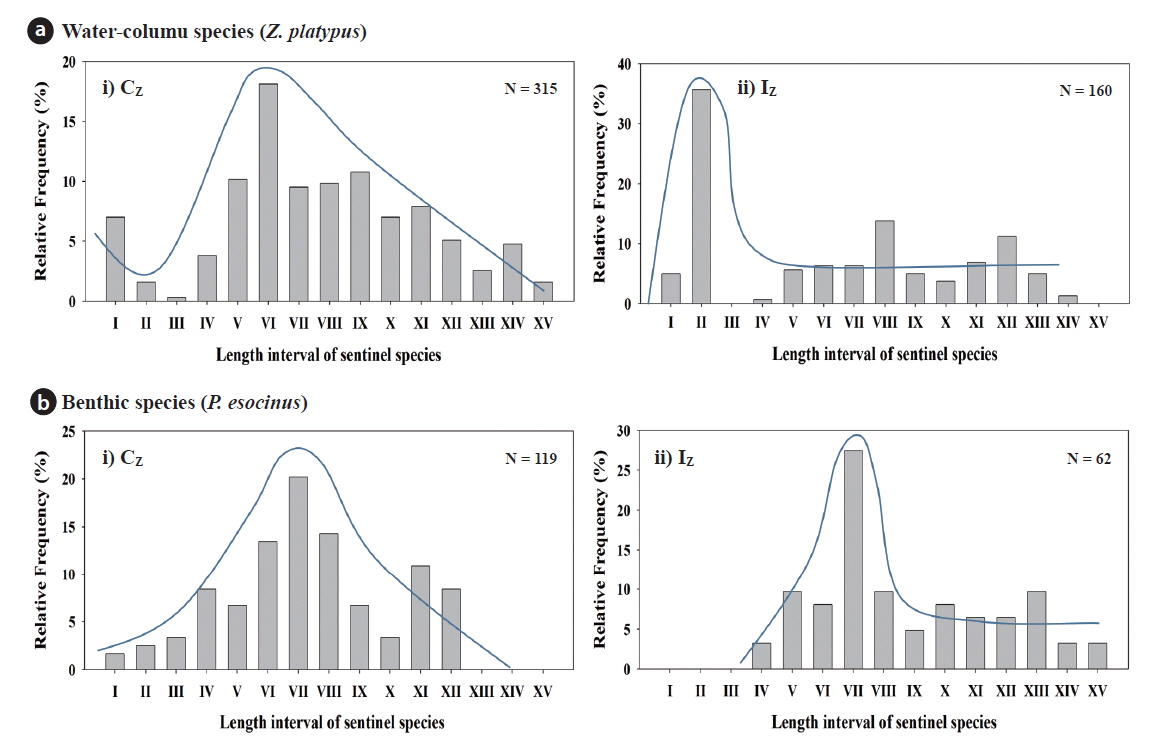
Frequency of size distribution of two habitat-type species was analyzed and categorized using a total length of fish. Two species of
Water-column species (Z. platypus) I : 21 - 30, II : 31 - 40, III : 41 - 50, IV : 51 - 60, V : 61 - 70, VI : 71 - 80, VII : 81 - 90, VIII : 91 - 100, IX : 101 - 110, X : 111 - 120, XI : 121 - 130, XII : 131 - 140, XIII : 141 - 150, XIV : 151 - 160, XV : 161 - 170
Benthic species (P. esocinus) I : 41 - 50, II : 51 - 60, III : 61 - 70, IV : 71 - 80, V : 81 - 90, VI : 91 - 100 VII : 101 - 110, VIII: 111 - 120, IX : 121 - 130, X : 131 - 140, XI : 141 - 150, XII : 151 - 160, XIII : 161 - 170, XIV : 171 - 180, XV : 181 - 190
>
Stream Health Assessment Index
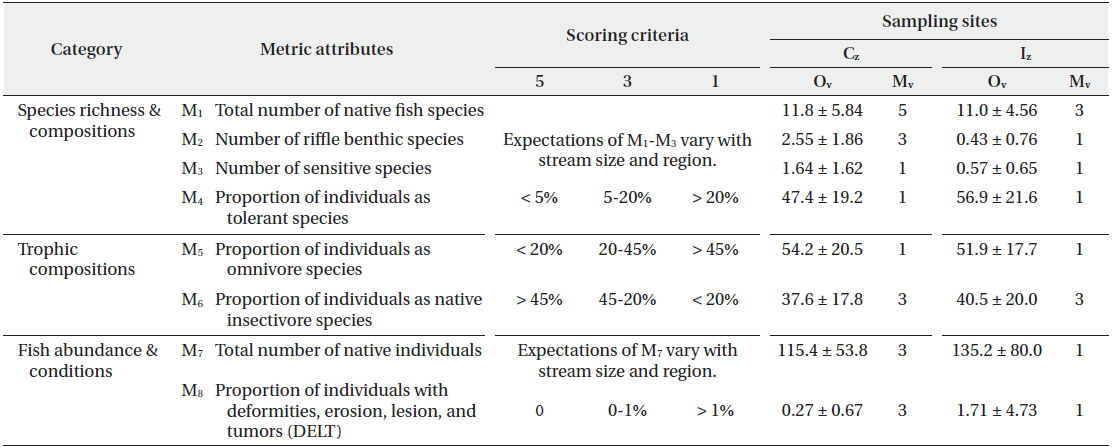
Stream Health Assessment (SHA) index, based on the Index of Biological Integrity (IBI; Karr 1981, Barbour et al. 1999), was developed on the basis of regional application (An et al. 2006) and used for community-level health assessment. The metrics attributes (M) were consisted in three major groups as ecological characteristics by species richness and composition (M1 - M4), trophic composition (M5 - M6), and fish abundance and conditions (M7 - M8). Each metric were scored 1, 3 or 5 point, respectively. These scores were then summed to obtain a site-specific model value that ranged from 8 to 40, and judged as 5 categories; excellent (36 - 40), good (28 - 34), fair (20 - 26), poor (14 - 18) and very poor (≤ 13).
For the data analysis of biomarkers and bioindicators, independent two sample t-test was conducted for sample comparison between sampling zones or two habitat-type species. Simple linear regression analysis was conducted to examine the relationships among the environmental factors. Statistical analyses were performed at the significant level of
Total protein (TPro), blood urea nitrogen (BUN), total cholesterol (TCho), and albumin (Alb) were measured for blood chemistry analysis as shown in Fig. 2. Content of TPro was 3.17 ± 1.0 g/dL in the Cz and 3.36 ± 1.5 g/dL in the Iz. BUN level was 1.57 ± 0.7 mg/dL in the Cz vs. 1.95 ± 1.0 mg/dL in the Iz. In the meantime, content of TCho was 226.3 ± 63.7 mg/dL in the Cz, 261.8 ± 66.6 mg/dL in Iz, while the content of Alb was 1.03 ± 0.5 g/dL in the Cz and 0.97 ± 0.5 g/dL in the Iz. The content of TPro is a good indicator for total amount of proteins in the fish blood, and the content of Alb indicates total amount of proteins synthesized in liver, thus, both two blood parameters generally show identical patterns which are low value in the blood during malnutrition (Gopal et al. 1997). However, in this study, TPro appeared higher in the Iz than the Cz and lower Alb in the Iz. Generally, both indices were expected to show identical patterns, but they showed different trends and this can be analyzed as better nutrition and better liver function because of higher value of Iz in the parameter of TPro (Rosenoer et al. 1977). Nonetheless, it does not seem that eutrophication of Iz brings positive influence on all the nourishment and liver function, according to the blood chemistry values of Alb. The case of BUN, is also used frequently as a good indicator for kidney malfunction and liver function, indirectly. BUN is urea nitrogen in the blood, which is produced from protein decomposition, and it indicates health of kidney and liver which are related to nitrogen waste elimination of fish. Higher values of BUN in the Iz than Cz indicate increases of BUN due to decreased amount of nitrogen eliminated from the reduced function of kidney and liver compared to the Cz as well (Adams et al. 1996). Also, TCho is used as an index of nutrition intake and metabolism (Adams and Tremblay 2003). TCho appeared higher in the Iz than Cz which indicates high fat content in the blood cells, active nutrition intake and high metabolism. Nevertheless, there were no clear differences in blood chemistry between the Cz and Iz.
>
Total mercury contamination of fish tissue and the histopathological analysis
Heavy metal concentrations of total mercury (total [Hg]) were analyzed from five different tissues of gill (Gi), intestine (In), liver (Li), spine (Sp) and muscle (Mu). Total mercury, based on the mean values of the five different tissues, was 1.4 fold higher in the Iz than in the Cz (Fig. 3). Especially, statistically significant differences between Cz and Iz were observed in the tissues of intestine (In;
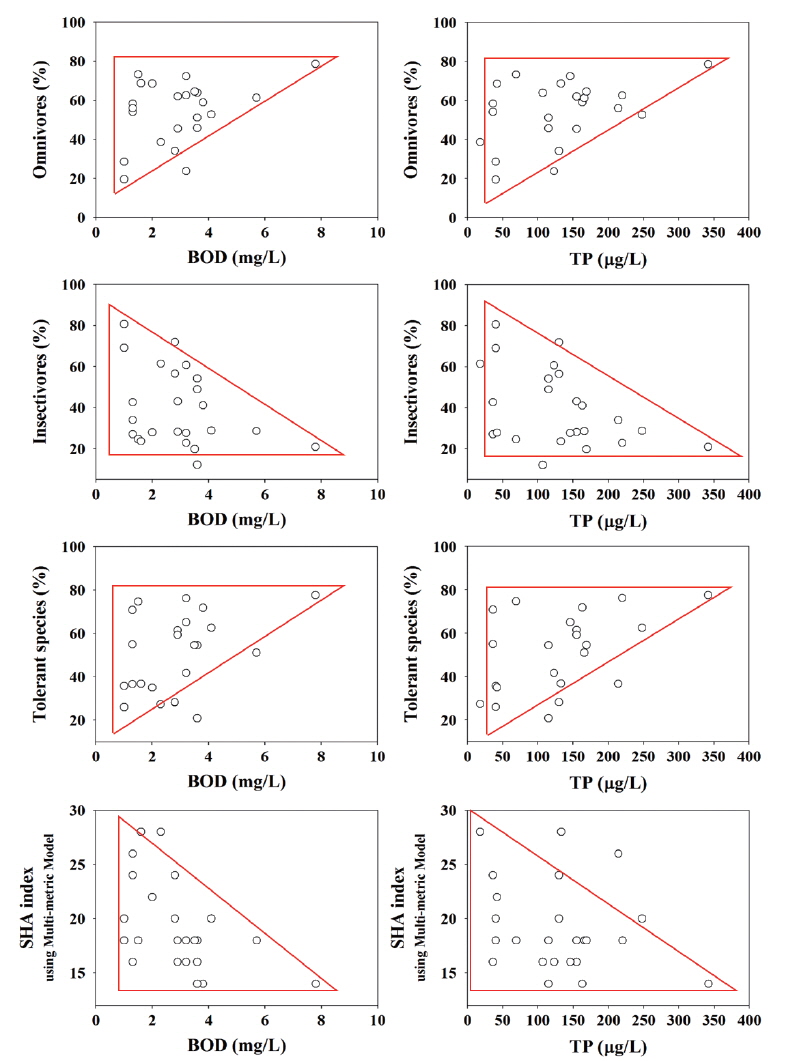
Water chemistry directly influenced the trophic compositions and fish tolerance. As water quality in different variables get worse, the relative proportions of omnivores and tolerant species tended to increase, but the relative proportions of insectivores and sensitive species tended to decrease in the urban streams (Fig. 5). Total phosphorus (TP) increased from 0 to 350 μg/L, and the proportions of omnivores and tolerant species approximately increased from 20% to 80% depending on the TP concentrations. Especially, the highest TP values were observed in the Iz, which had high proportions of omnivores and tolerant species. Previous studies (Karr 1981, US EPA 1991, Barbour et al. 1999) reported that nutrient enrichment (N, P) and organic matter pollutions cause large increases in total number and species of omnivores and tolerant species. Nitrogen and phosphorus enrichments were evident in the Iz of both Gap Stream and Miho Stream. The increase of BOD from 0 in the Cz to 8 mg/L in the Iz caused increases of omnivores from 20% in the Cz to 80 % in the Iz.
>
Species Biotic Index as a species-level indicator
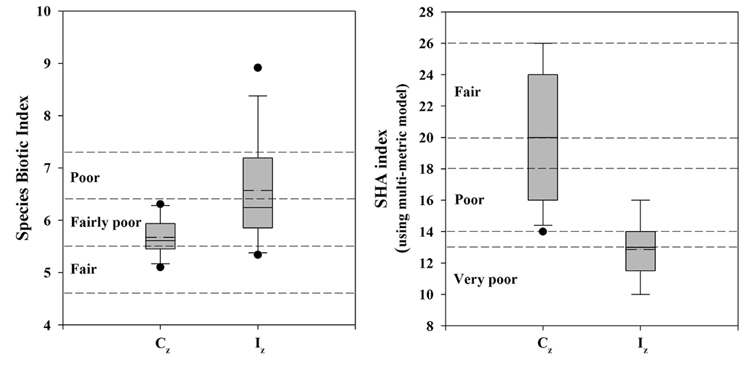
Stream ecosystem health was analyzed in the species-level using a SBI. Values of SBI were 5.67 ± 0.35 in the Cz and 6.57 ± 1.02 in the Iz (Fig. 6). Thus, ecological health, calculated as a sum of each species’ tolerance value, was ranked as “fair condition” in the Cz and “poor condition” in the Iz. SHA index, based on multimetric IBI model, showed that values of SHA index were 20 in the Cz and 13 in the Iz. This species-level result of SBI was consistent with the community-level result of stream health assessments of IBI (Table 1 and Fig. 6). Both SBI value and SHA index showed significant difference (
[Table 1.] Stream Health Assessment (SHA) index* based on fish assembly

Stream Health Assessment (SHA) index* based on fish assembly
>
Population recruitment analysis and community-level stream health
Population recruitment analysis of water-column species and benthic species indicated that population size frequency showed normal distribution in the Cz but skewed distributions in the Iz. Both species showed normal distribution in all size frequency intervals except for two classes (II and III) in the Cz (Fig. 7). In contrast, skewed distribution was in evident in the Iz, so the midsize classes of VI or VII were the highest. In the watercolumn species, the maximum value of Cz was 18.1% in the VI class and the minimum value was 0.3% in the III class, while the maximum of Iz was 35.6% in the II class, and there were no individuals in the interval III and XV. In benthic species, the maximum value of Cz was the 20.2% in the VI class, while the maximum of Iz was 27.4% in the VII class and there were no individuals in the intervals from I to III class. Our results suggest that chemical degradations of organic matter pollution and nutrient enrichments resulted in recruitment failure of young-stage individuals from the class I to III (Gibbons and Munkittrick 1994). Stream health assessment (SHA) index, based on multiple fish metrics, showed that several metric values of the model were lower in the Iz, compared to the Cz (Table 1). Mean model values (Mv) was 20 in the Cz, which was diagnosed as a “fair condition” in the health. In contrast, the mean of Mv was 12 in the Iz, indicating a “very poor condition”. Thus, five model metrics of native fish species (M1), riffle benthic species (M2), total number of native individual (M7) and the abnormality (M8) were higher in the Iz than in the Cz. These results agree with the population recruitment analysis, indicating that ecological health was impaired due to the chemical pollution and habitat degradations (Klemm et al. 1993, An et al. 2001, Bae and An 2006).
In this study, stream impact assessments were conducted in urban aquatic ecosystems using multiple biomarkers and bioindicators of blood chemistry, histopathological tissue, species-level, population-level and community-level parameters. Blood chemistry analysis of fish cells indicated that contents of total protein, blood urea nitrogen, and total cholesterol were higher in the impacted zone than the control. Also, heavy metal analysis of total mercury, based on five different tissues of gill, intestine, liver, spine and muscle, were 1.4 fold higher in the impacted zone than in the control and histopathological changes were not shown in the control. In contrast, cell necrosis and degeneration in the histopathological liver analysis were evident in the impacted zone. Previous studies of Adams (2002) reported that cell necrosis and degeneration are closely associated with chemical toxicants such as PAHs, PCBs, and agricultural pesticides. Specieslevel analysis, based on species biotic index, showed that high values of SBI were evident in the impacted zone, indicating chemical influences by nutrients, organic pollutants and xenotoxicants. Population-level bioindicator, based on size-fraction, showed a reproductive failure of small size population (I - III), especially in the impacted zone. Similarly, community-level bioindicator using the multimetric model of SHA indicated that urban pollution has a negative relationship with biological integrity of streams. These biomarkers and bioindicators reflected the chemical degradations in the impacted zone. Our approaches using multiple biomarkers and bioindicators may be used as a key tool for identifying the effects of urban streams in terms of physical habitat health, chemical health, and biological health and provide important suggestions for stream restoration in the impacted streams.


![Measurements of total Hg concentration (total [Hg]) in each tissue in the sampled streams. Gi, gill; In, intestine; Li, liver; Sp, spine; Mu, muscle.](http://oak.go.kr/repository/journal/16545/STHHCL_2015_v38n3_307_f003.jpg)