Eutrophication mainly caused by nitrogen and phosphorus enrichment has been shown to improve the primary productivity and quicken the propagation of algae (Prepas and Charette 2003, Paerl and Otten 2013). Eutrophication has damaged the function and utility of water bodies, and a large number of management and ecological restoration projects have been conducted to change the widespread eutrophication situation in China (Qin 2007, Qin et al. 2007). One of the most important phenomena resulting from eutrophication is algal blooms, which induce water anoxia, foam, and many other negative impacts (Paerl 1988).
Algal bloom mainly refers to the fast growth and accumulation of phytoplankton (Paerl et al. 2001). There have been many algal blooms in China, such as the blooms in Lake Taihu and Lake Dianchi caused by
The formation of algal blooms and especially cyanobacterial blooms are the result of many interacting ecological factors (Paerl 1988, Oliver and Ganf 2000, Chen et al. 2003), e.g., physiological features (Oliver and Ganf 2000), climatic factors (Paerl and Huisman 2008), nutrients (Prepas and Charette 2003, Wang et al. 2010), and selective grazing by zooplankton (Wang et al. 2010). The roles that these factors play during the process are still unclear, and our understanding of the mechanisms is still rudimentary.
However, studying the cyanobacterial bloom process and the influencing factors via field surveys is difficult. On the other hand, it is not easy to replicate the bloom formation process with laboratory experiments using axenic cultured algae. Many algae in laboratory axenic incubations only exist as single cells instead of colonies, which is different from the morphology in the field (Mikheeva and Kruchkova 1980, Lürling and van Donk 1997).
In order to understand the mechanisms of cyanobacterial bloom formation, many
If the algal bloom formation process can be achieved in a controlled environment, the study of this process would be greatly enriched. As cyanobacterial blooms preferentially occur in warm seasons (Paerl and Huisman 2008), a greenhouse can provide the appropriate conditions for the examinations. Our former experiment induced a
With the widespread eutrophication, many landscape waters also became eutrophic as nutrients concentrations increased and phytoplankton proliferated significantly. Although these waters did not affect people as much as the large lakes did, how these waters will respond to climate change and elevated eutrophication remains unclear. With our survey to many small landscape waters in China, we found the water showed Chlorophyta dominance or both cyanobacteria and Chlorophyta dominance.
Previous studies indicate that increased temperatures can selectively promote cyanobacterial blooms, specifically
Our former experiments performed with different water sources (Wang et al. 2010, 2011) found that the dominant algae after nutrients enrichment changed under different scenarios. To further study the switch from Chlorophyta dominance to other algal dominance, a nutrient enrichment experiment was conducted in a greenhouse with water from a small landscape pond with Chlorophyta dominance. This will provide additional data for the explanation of cyanobacterial bloom formation as well as new methods for future study on the mechanisms of cyanobacterial bloom formation.
Water was collected from a ~20 m2 circular eutrophic pond located at the Fishery Machinery and Instrument Research Institute, Chinese Academy of Fisheries Sciences in Shanghai, China. This pond is located in a subtropical climate, contained abundant phytoplankton, and was stocked with golden carp (
No special feeding was provided for the carp, and the food web in the pond was mainly comprised of phytoplankton, zooplankton, and carp. The depth of the pond is approximately 40 cm, with a Secchi depth of about 25 cm during the experimental period. The bottom of the pond was pelitic. The pond is in the center of a lawn and is equipped with a fountain and decorative rocks. Tap water is used as a water source for the pond.
At the beginning of the experiment, the chlorophyll
The initial zooplankton was surveyed. The dominant zooplankton was Cyclops of copepodand its larvae (Shen 1979), with a total density of 12.5 ind./L.
>
Experimental design and monitoring
The experiment was conducted using transparent borosilicate glass jars with a volume of 5.0 L (16.0 cm diameter and 32.0 cm high) in a 182 m2 greenhouse. The experimental period was during the summer from 22 June to 10 July 2011. A bioassay approach was used that was similar to that of Paerl and Bowles (1987), although our study was not
On the morning of 22 June, the pond water was collected in a large container and gently mixed to ensure an even distribution of phytoplankton. Then, the water was divided amongst the 6 jars. The sunlight was so strong that the glass roof of the greenhouse was covered with light grey cloth. The shading coefficient of the cloth was approximately 80%.
The jars were divided into treatment (+NP) and control groups which each had three replicates. There was no nutrient enrichment in the control, and nutrients were enriched in the treatment group. Nutrients were added thrice during the course of the experiment: at the beginning (day 0), 28 June (day 6), and 4 July (day 12). Enrichment of nutrients on day 0 included organic matter (thick liquid of decomposed
The thick liquid of organic matter was obtained from the decomposition of
Our preliminary experiment found that the zooplankton proliferated substantially, although they were filtered away at the beginning. In order to remove as much zooplankton and as little phytoplankton as possible at the beginning, a 125 μm nylon mesh was used to separate the zooplankton according to the technique of Vanni and Temte (1990). The filtration rate for the phytoplankton was lower than 1% (according to a comparison between the chlorophyll
The weather during the experiment was recorded. Water temperature; TN, TP, DTN, DTP, and SRP; chlorophyll
Weather conditions were recorded daily, and water temperature was measured at 08:30 h and 14:00 h daily. TN, TP, DTN, and DTP concentrations were measured every 6 days. SRP, Chl-
Water temperature was measured using a mercury thermometer held at approximately 5 cm depth. Water for analysis of DTN, DTP, SRP, and Chl-
Chl-
Most cells were observed at 400× magnification via light microscopy (Olympus CX31; Olympus, Japan), while large algal cells were observed at 100× magnification. Cells were mainly identified to the genus level as referenced by morphologies (Chen et al. 2002, Hu and Wei 2006). Algal volumes were calculated based on cell density and cell size measurements. Calculation of the cells volumes was according to their shapes, and the length, height, and diameter measurements were obtained to calculate the volume. The cells with irregular shapes were decomposed to some approximately regular geometry, and then the sum value was calculated as the total volume. At least 30 algal units were measured to obtain the average cell volume for each genera or species. The conversion to wet weight biomass assumed that 1 mm3 of volume was equivalent to 1 mg of wet weight biomass.
A 112 μm nylon mesh was used to filter all the remaining water for zooplankton sampling at the end of the experiment. The zooplankton samples were preserved with 1% Lugols solution and 4% formalin (final concentration). Identification of zooplankton was according to references (Shen 1979, Zhang and Huang 1991). For the enumeration, two replicate aliquots were placed in 1.0 mL plankton counting chambers under 100× magnification (Zhang and Huang 1991). The identification was mainly to the genus level.
Responses of nutrients, Chl-
>
Phytoplankton community composition and changes
The phytoplankton in the treatment proliferated substantially during the experiment. The total wet weight of the phytoplankton and the wet weight of different phyla of the control are shown in Table 1, and the wet weight of the 5 dominant genera by wet weight are shown in Table 2. The total wet weight of the phytoplankton and the wet weight of different phyla of the treatment are shown in Table 3, and the wet weight of the 5 dominant genera by wet weight are shown in Table 4.
[Table 1.] Algal wet weight of total and of different phylum in the control (means ± SD) (mg/L)

Algal wet weight of total and of different phylum in the control (means ± SD) (mg/L)
[Table 2.] The 5 dominant genera of the control by wet weight (means ± SD) (mg/L)

The 5 dominant genera of the control by wet weight (means ± SD) (mg/L)

Algal wet weight of the total and of different phylum in the treatment (means ± SD) (mg/L)
[Table 4.] The 5 dominant genera of the treatment by wet weight (means ± SD) (mg/L)

The 5 dominant genera of the treatment by wet weight (means ± SD) (mg/L)
As Table 1 shows, the total wet weight in the control fell during the experiment in comparison with the initial value, and Chlorophyta was dominant for the entire period. The 5 dominant genera were also Chlorophyta, including
Table 3 shows that the dominant phyla in the treatment during the experiment were Chlorophyta and Cyanophyta. Chlorophyta were dominant during the early stage, while Cyanophyta dominated from day 9 onward. Table 4 shows that the dominant genera in the treatment during the early stage were
ANOVA results indicated that the total wet weight and the wet weight of Cyanophyta in the treatment were significantly higher than in the control (

Results of the tests of between-subjects effects of repeated-measures ANOVA for comparison of nutrient concentrations and algal biomass
>
Composition and density of large zooplankton at the end of experimental period
The composition and density of large zooplankton at the end of the experiment are shown in Table 6. The dominant copepod was Cyclopoida, and the dominant Rotifera was
[Table 6.] Composition and density of zooplankton at the end of the experiment (means ± SD)

Composition and density of zooplankton at the end of the experiment (means ± SD)
T-test analysis results showed that the density of copepods in the treatment was significantly higher than in the control (
>
Planktonic Chl- a responses to nutrients
Changes in planktonic Chl-
The changes of mean ± S.D. in TN, TP, DTN, DTP, TN/TP, and DTN/DTP for the control and treatment are shown in Fig. 2, and the changes of SRP are shown in Fig. 1. Repeated measures ANOVA results showed that TN, TP, DTN, DTP, and SRP in the treatment group was significantly higher than in the control group (
>
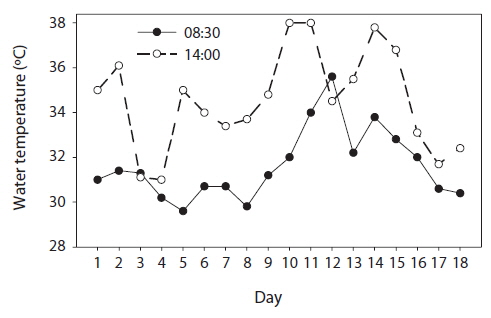
Weather conditions and water temperature
The weather during the experimental period was generally sunny or cloudy, except for 4 July (day 12) which was cloudy and rainy. The mean water temperature in the jars at 08:30 h and 14:00 h was 31.6℃ and 34.6℃, respectively (Fig. 3).
Resource competition between different phytoplankton is mainly for nutrients, and nutrient concentrations are a key factor affecting phytoplankton community composition (Steinberg and Hartmann 1988). This can be deduced from the succession of phytoplankton to bloomforming cyanobacteria dominance. Harmful cyanobacterial bloom was inclined to form when the nitrogen and phosphorus nutrient was supplied to satisfy the proliferation need of algae (Richardson 1997, Prepas and Charette 2003, O’Neil et al. 2012). However, it is not necessary for the eutrophic water bodies with high concentrations of phytoplankton that exhibit cyanobacterial blooms (Wang et al. 2004). In this experiment, nutrient enrichment in the treatment induced the switch from Chlorophyta dominance to Cyanobacteria dominance in only 9 days (Table 3 and 4). This shows that nutrient enrichment affected the algal succession markedly. This is similar to the results of our previous experiments (Wang et al. 2010, 2011), in which cyanobacterial blooms were experimentally stimulated outdoors from water bodies initially free of such blooms. Cyanobacterial bloom in natural water usually occurs with eutrophication (Steinberg and Hartmann 1988, Richardson 1997, Prepas and Charette 2003, Qin et al. 2006, O’Neil et al. 2012), which agrees with the natural phenomena in which few cyanobacterial blooms formed in oligotrophic waters.
This experiment illustrated that a
There are additional
Besides the concentration of nutrients, nitrogen to phosphorus ratios also affect the phytoplankton community composition. It has been discussed in the literature that the TN to TP ratio (TN/TP) can affect the algal composition markedly (Schindler 1977, Liu et al. 2011) and when TN/TP < 29:1 the bloom-forming algae would dominate (Smith 1983). However, some results of research do not agree with the hypothesis. When TN/TP was much larger than 29:1, cyanobacteria dominance has also been observed (Shindler et al. 1980, Harris 1986, McQueen and Lean 1987). Furthermore, cyanobacterial blooms formed in water with relatively low TN/TP values as well. This suggests that low TN/TP values are a consequence of cyanobacterial bloom formation instead of its prerequisite (Xie et al. 2003). In this experiment, the TN/TP and DTN/DTP values in the control were all lower than 29:1, which were larger than those in the treatment, and the dominant algae in the control were Chlorophyta (Table 1 and 2). The TN/TP and DTN/DTP values in the treatment were near 7:1 as it was subjected to nutrient additions of N/P = 7:1, and cyanobacteria dominance formed in the treatment. This indicates that the different TN/TP and DTN/DTP values were not causal factors for the algal difference between the treatment and the control. This result agrees with the opinion of Trimbee and Prepas (1987). Therefore, one of the main causes for the dominant algae switch in this experiment is the concentrations of nutrients.
Besides nutrient concentrations, the feeding from zooplankton was also a causal factor for algal biomass and composition (Geller and Müller 1981, Pace and Cole 2000). The copepod density in the control was significantly lower than in the treatment, while there were no significant difference between the density of Rotifera, copepod larva, and the total zooplankton density (Table 6), suggesting that rotifers were not the main reason for the algal dominance difference between treatments.
Sommer et al. (2001) found that copepods mainly limited the large phytoplankton in a mesotrophic lake. The
With global warming and water eutrophication, natural water which is rich in phytoplankton will be inclined to shift to cyanobacteria dominance or severe algal blooms. Research has shown that climate factors including solar radiation time and water temperature affected the formation and time duration of cyanobacteria blooms (Liu et al. 2011, Zhang et al. 2012), and earlier and warmer springs increase cyanobacterial (
Different cyanobacteria bloom or dominate. Our previous experiments also provided some examples (Wang et al. 2010, 2011), e.g., a switch from
Filamentous cyanobacteria dominance due to eutrophication is common in the Northern Hemisphere (Ernst et al. 2009). Van den Wyngaert et al. (2011) believed that
Research on the relationship between nitrogen fixers and carbon has shown that nitrogen fixers are inclined to appear in carbon rich sea water (Moisander et al. 2012). However, we do not know whether the
The dominant algae switched from Chlorophyta to Cyanobacteria quickly after nutrient enrichment, although no
Field studies and seasonal correlations of the cyanobacteria dominance and water temperature show that cyanobacteria bloom formation preferentially occurs in water with high temperature (Reynolds 1984, Sommer et al. 1986). Foy et al. (1976) concluded that the temperature optima of cultures of
Cellular processes of many phytoplankton are temperature dependent, and their rates accelerate exponentially with increasing temperature with maximal values occurring between 25 and 40 ℃ (Reynolds 1984). In this experiment, there were no treatments that varied water temperature to further show the effects of temperature. However, the high water temperature, which is suitable for the fast cellular acceleration, in combination with other factors such as nutrients and light, promotes the green algae dominance quickly switching to cyanobacteria dominance after nutrient enrichment. There must be additional factors affecting the process leading to
This study provides a quick and simple method for cyanobacteria dominance (or bloom) formation
In approximately 9 days, initial Chlorophyta dominance was converted to cyanobacteria dominance after nutrient enrichment with elevated water temperature. This provides a simple way for studying the roles of different environmental factors that affect algal bloom formation.