This study was undertaken to suggest an effective fisheries resources management system by using stock assessment and potential yield analyses of crucian carp population in the mid-upper system of the Seomjin River. Fieldwork was conducted seasonally from 2008 to 2009 in the mid-upper system of the Seomjin River. The stock assessment was carried out by the swept area method and the potential yield was estimated by improved fisheries resource potential estimation system based on the Allowable Biological Catch. Also, the yield-per-recruit analysis was used to review the efficient management implication of the resource, Carassius auratus. As a result, the age at first capture (tc) was estimated as 1.468 year, converted body length (BL) was 10.8 cm. Meaning the current fishing intensities, the instantaneous coefficient of fishing mortality (F) was 0.067 year-1, and the yield-per-recruit analysis showed that the current yield per recruit was estimated to be 15.999 g with F and tc. The instantaneous rate of fishing mortality that provides for Allowable Biological Catch (FABC) based on the current tc and F was estimated as 0.618 year-1. Therefore, the optimum fishing intensities could be achieved at the higher fishing intensity for Carassius auratus. The calculated annual stock of C. auratus was estimated as 7,608 kg, and the potential yield was estimated as 343 kg with tc and F at the fixed current level. Using yield-per-recruit analysis, if F and tc were set at 0.618 year-1 and 2 year, the yield per recruit and total allowable catch would be predicted to increase to 62 g and 2,531 kg by about 3.9 times and 7.3 times, respectively.
Fish population as a top predator of the aquatic food web plays a major role in aquatic systems and is also of great economic importance (Kalff 2002). Their dynamics have a large influence on the others aquatic organisms; especially, commercial fish species have a direct bearing on the changes of fisheries resources. Therefore, it is essential to manage the fish population systematically and scientifically for efficient utilization of fisheries and eco-system sustainability.
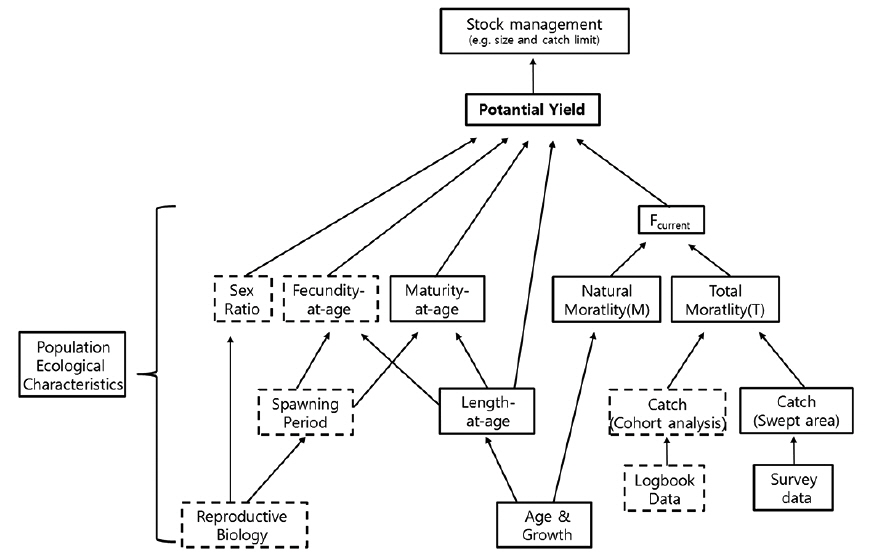
The fisheries resources management in freshwater of Korea had relied on technical measures. These technical measures included restriction of mesh or setting size, boat licenses, closed fishing areas/seasons, and gear limitations (Kim 2008). Recently, to manage their fisheries, some governments, including Korea, Japan, USA, Australia, and Mexico, adopted a newer fisheries management measure (e.g., output control) based on potential yield and stock assessment in seawater (Lopez-Martinez et al. 2002, Ryu et al. 2005, Lee et al. 2009, Griffiths 2010, Lee et al. 2011). This management measure requires stock assessment methodologies for estimating potential yield (Zhang and Lee 2001). The Potential Yield (PY) will represent an appropriate harvest rate that is applied to a current fish stock size estimated. Ideally, the PY will produce a biologically average yield over the long term and avoid overfishing during periods when the stock is low. Therefore, PY is essential for sustainable utilization and effective management of the stock (Fazli et al. 2009). To properly estimate PY, it is essential to obtain accurate information of target species such as the ecological population characteristics, optimal levels of catch and fishing effort, biomass and age at first capture (Jang et al. 2010, 2011b).
Crucian carp (
The specific aims of this study are as follows: (i) to assess annual the stock of crucian carp in the mid-upper system of the Seomjin River, (ii) to estimate the potential yield that is considered the Allowable Biological Catch (ABC), and (iii) to investigate and evaluate the fishing intensity at the current level using yield-per-recruit analysis.
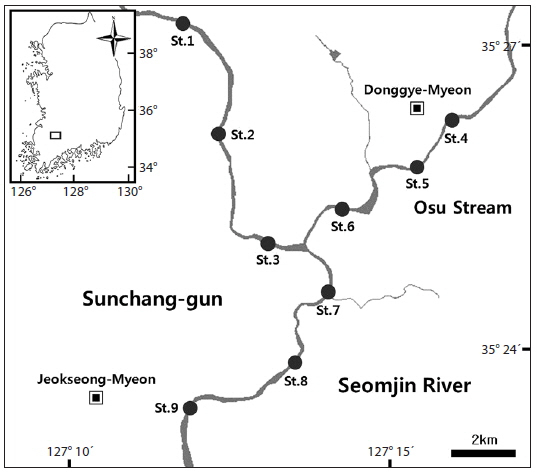
Sampling areas were located in the mid-upper system of the Seomjin River (Fig. 1). This area was relatively not disturbed by the artificial environmental factors, and commercial catch activities were strictly prohibited. It has been reported that there are many various species in this area (Jang et al. 2009). Sampling was carried out at 9 sites from August 2008 to April 2009 seasonally, considering fish habitat, water depth, and other factors (Fig. 1). All Sampling type were selected the random block sampling.
Study on potential yield and biomass of crucian carp could facilitate sustainable utilization of fisheries resources in the way that stock diagnosis enable the quantitative assessment and variation prediction of biomass. The method for estimating stock followed the “swept area method” (Pezzuto et al. 2008, Shin 2009). This restricts the sampling area using seine net (mesh of 10 × 10 mm) and specimens were collected by cast net (mesh of 7 × 7 mm; π × 1.2 m2 = 4.5 m2), fyke net (mesh of 30 × 30 mm; 500 m2), and divers. The divers were sent in to search the ground-fish of deepwater. A total of 402 fish were collected and the catch was 75,233 g.
In the field, collected specimens were measured up to the nearest 1 mm (total length, TL; body length, BL) and up to the nearest 0.1 g (body weight). Date of collection, length and weight of each specimen were recorded. All specimens were identified according to Choi et al. (1990) and Kim and Park (2002). After identification of species, specimens were randomly selected and transferred to the laboratory for analysis. To analyze age determination, the scales were removed from 93 species at the interval of 10 mm body length. The catch data were applied as input data for estimating stock (Table 1).
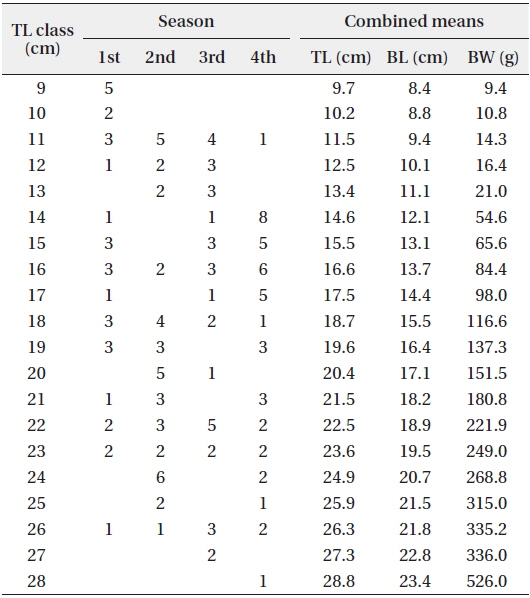
Catch in number at total length (TL) of crucian carp in the midupper system of the Seomjin River
The method for estimating stock followed the “swept area method”, the following equation was used (Pezzuto et al. 2008, Shin 2009).

where B is the biomass, is an average density (individuals/m2) , is the target species of average weight (g) , A is the area of investigated waters (m2), and q is a catchability. The estimated values of average density and average weight were 0.018 ± 0.001 indviduals/m2 and 187.1 ± 11.2 g, respectively. The catchability was calculated by the assumption that import and export of fish in restricted area by the seine net were equal each to each and all specimens should be caught in sampling area. The area of investigated waters and fishing ground were calculated by Rural Agriculture Water Resource Information System (https://rawris.ekr.or.kr). They were calculated at approximately 22,347 m2 and 2,259,900 m2, respectively.
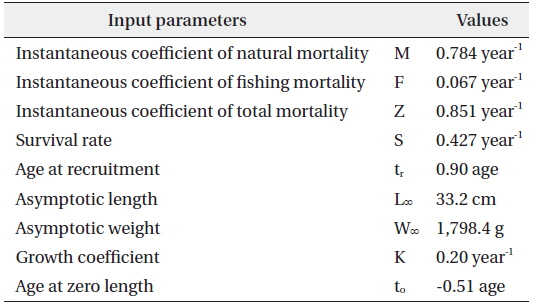
In this study, parameters of population ecological characteristics that were estimated from the prior research were applied as input data. In the previous study, age structure of crucian carp has been assessed by otolith. Biological parameters for crucian carp are summarized in Table 2 (Jang et al. 2011a).

Parameters estimates used in yield-per recruit and Potential Yield for crucian carp in the mid-upper system of the Seomjin River
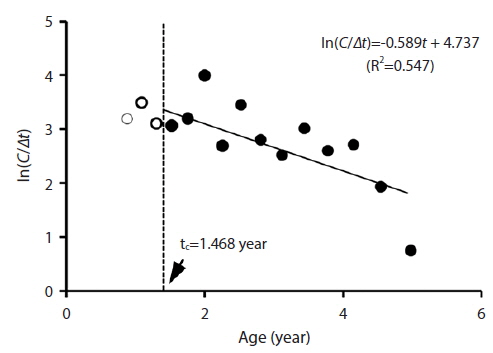
In general, tc of a stock was estimated directly from fishing experiments either by attaching a small-meshed cover over the cod-end or from the size composition of the catches of nets of smaller meshes caught at the same time and place (Gulland 1983). Pauly method, based on a length-converted catch curve, was used because of the lack of information on fishing experiment. The method involves the following assumption: instantaneous coefficient of total mortality (Z) is same in all age group. When Z was estimated by linearized catch curve, data under age at full recruitment was not used. Virtual catch in number under age at the full recruitment was estimated by extrapolation method. Therefore, it calculates the gap between actual catch in number and virtual catch in number, at all ages. The value of gap means compositive effect between recruitment and setting mesh size (Zhang 2010). In this study, age at first capture was estimated by Pauly method (Pauly 1983, 1984).
>
Optimal fishing intensity and optimal age at first capture
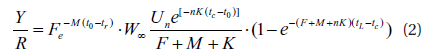
To determine the optimal fishing mortality and the optimal age at first capture, the following equation was used (Beverton and Holt 1957).

where asymptotic weight (
The Potential Yield (PY) that was defined as the allowable biological catch (ABC) provides an optimal catch level about fisheries resources exploited or unexploited in specified areas. To estimate the PY, this study was undertaken using the improved Fisheries Resources Potential Estimation System (FRPES) (Zhang and Na 2006). It was composed of a five-tier-classification system, which was modified from the six-tier-system used under the US Fisheries Management Plan for the North Pacific groundfish fisheries (NFMS/AFSC 1998). The estimation of FABC (instantaneous rate of fishing mortality that provide for Allowable Biological Catch) of stock in Fisheries Resources Potential Estimation System must take into consideration the quantity and quality of information available and the exploitation history of fisheries resources. For tier 1-3, FABC was determined, and the following equation was used to determine PY.

where

where B is the estimate of biomass. The study was adapted to the 3rd tier classification (Zhang and Lee 2001).

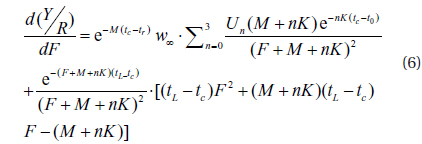
An estimate of F0.1, which means the fishing mortality corresponding to 10% of the slope at the origin when no fishing occurs, was based on the following equation differentiated from the yield per recruit (YPR) equation of the Beverton and Holt (1957).
The age at first capture (tc) of crucian carp was estimated to be 1.468 year from the length converted catch curve of the Pauly method (Pauly 1984). Body length that was converted by estimating tc was calcurated as 10.8 cm (Total length 13.1 cm). Crucian carp was known to grow to 14-16 cm in total length during whole 1 year (Son and Song 2006), but, in this study, the results were somewhat differ (Fig. 2).
>
Optimal f??ishing intensity and optimal age at first capture
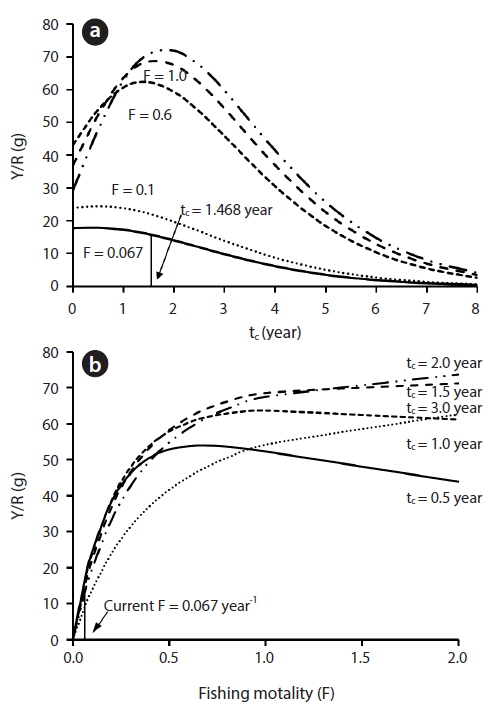
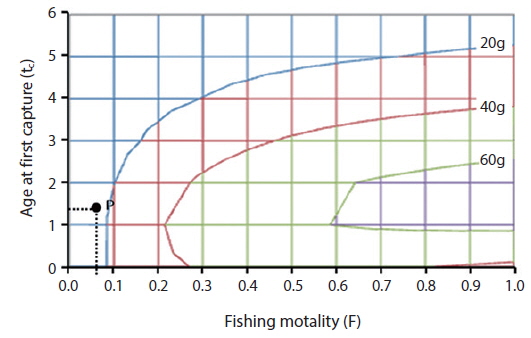
Fishery impact has traditionally been assessed using yield-per-recruit (YPR) analysis (Baranov 1914). YPR is estimated for different fishing mortality rates and different ages at entry to fishery (Allen 2001). Yield isopleth is developed to afford a visual representation of the influence of fishing mortality and age at entry on YPR. This analysis, which represents the tradeoff between growth and natural mortality, can be used to identify whether fish have been caught before their full growth potential (i.e., while their growth rate is still higher than natural mortality) (Wang et al. 2009). The management implications can apply the yield isopleth to help determine the relevant mesh or setting size and fishing effort.
The estimates of YPR against fishing mortalities (F) and tc for crucian carp are summarized in Fig. 3. Yield isopleths of crucian carp were constructed to examine the response of yield-per-recruit estimates to changes in tc and F (Fig. 4). The current average yield-per-recruit (with F = 0.067 year-1, and tc = 1.468 year) was 15.999 g per recruit, indicating that the fishery was operating below the maximum-yield-per-recruit at 75.617 g, when tc was 2.0 year. Fixing tc at the current level, maximum-yield-per-recruit was 70.903 g when F increased more than 1.890 year-1, but this F was out of range of the maximum-yield-per-recruit line. Fixing F at the current level when tc decreased to 0.359 year, maximum-yield-per-recruit was 17.876 g which resulted in an increase of 11%, i.e., 1.88 in yield-per-recruit.
Reference points such as Fmax and F0.1 have often applied to evolve fisheries management implications. Table 3 delineated Fmax and F0.1 values from age 1 to 5 of crucian carp, which were calculated from the Beverton and Holt model. The current instantaneous coefficient of fishing mortality (F) did not exceed biological reference points. When tc was 2 year, the yield-per-recruit was the highest at Fmax and F0.1 of 75.067 g and 59.346 g, respectively. Fmax and F0.1 decreased until 5. The yield-per-recruit corresponding to each Fmax value increased to age 2 but the yield-per-recruit gradually declined after the age 2. Several researchers have supported designating Fmax as target reference points and F0.1 as a threshold reference point in order to obtain near optimal yields while guarding against stock collapse (Fazli et al. 2009). The result of the base YPR analysis in the study with tc of 1.468 year suggests that the annual fishing intensity of crucian carp in the mid-upper system of the Seomjin River is lower than the target reference point Fmax as well.
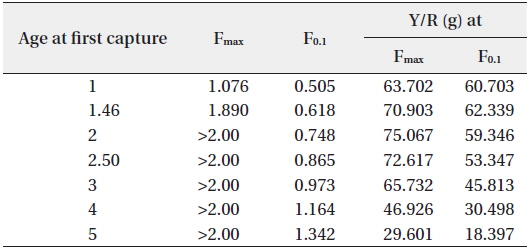
Yield per recruit (Y/R) of crucian carp, in the mid-upper system of the Seomjin River under harvest strategies corresponding to Fmax and F0.1
>
Stock assessment and potential yield
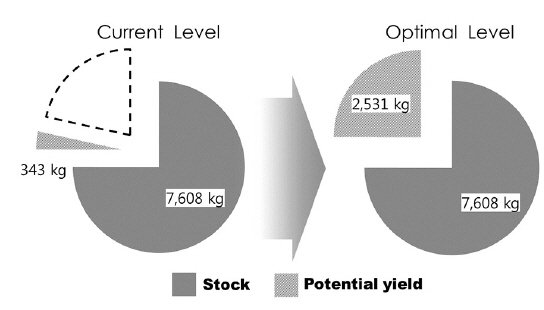
Study on potential yield and biomass of crucian carp could facilitate sustainable utilization of fisheries resources in the way that stock diagnosis enabled the quantitative assessment and variation prediction of biomass. This study calculated biomass using the Swept area method. The annual biomass of cruician carp was estimated as 7,608 kg and biomass per unit area was 3.37 g m-2. The biomass per unit area was not relatively more plentiful than the result of preceded researchthat was performed in lake Namyangand estimated the result as 4.68 g m-2 (Jang et al. 2008). For estimating PY, information on dependable annual biomass, F0.1, and M for crucian carp plus environmental factors affecting recruitment is required. If instantaneous coefficient of fishing mortalities (F) was set at current level, PY was estimated as 343 kg. However, in order to manage fisheries resources of crucian carp population efficiently, PY would be predicted to increase to 2,531 kg, provided that the FABC was set at 0.618 year-1 as derived from the estimated F0.1 for crucian carp (Fig. 5). Also, yield per recruit would increase to 62 g. Considering the current stock status of crucian carp, we suggest the following method based on our result in order to sustain the maximum sustainable yield of crucian carp population in the mid-upper system of the Seomjin River.
First, make a restriction on minimum fishing body length at 11 cm and over.
Second, maintain a fishing intensity of 10 times level at the current.
To establish the ecological sustainability of fish harvest, the PY estimated must be compared with actual catch figure. If total catch exceeds the PY level, fisheries resources obviously are not sustainable. Thus, Estimation of PY value must use to the threshold point, not the target reference point (Caddy and Mahom 1995). If PY values were applied to target reference level, it will occur for overfishing and collapse of fisheries.
A limited knowledge of the fisheries resources ecology of some freshwater fishes has led to overexploitation and inadequate management in freshwater (Dankel et al. 2008). Varied knowledge of the fisheries resources ecology may help establish appropriate management implication for freshwater fishes, and increasing fishery and biological information may enable a higher level evaluation to be carried out (i.e., quantitative stock assessment) (Zischke 2012). In order to suggest an effective fisheries resources management system, this study was undertaken using stock assessment and potential yield analyses of crucian carp population in the freshwater ecosystem of Korea for the first time.
Study on potential yield and biomass of crucian carp could facilitate sustainable utilization of fisheries resources in the way that stock diagnosis enables the quantitative assessment and variation prediction of biomass. The annual biomass of cruician carp was estimated as 7.6 t (1t = 1,000 kg) in the mid-upper system of the Seomjin River. PY would be predicted to 2.5 t, and this value can be used to establish the allowable biological catch for fisheries resources management. In order to manage fisheries resources of crucian carp population efficiently, if age at first capture (tc) and instantaneous coefficient of fishing mortalities (F) were set at 2 year and 0.618 year-1, the yield per recruit and total allowable catch would be predicted to increase to 62 g and 2,531 kg by about 3.9 times and 7.3 times, respectively.
Crucian carps (