The chances of accidental exposure are augmented as the application of ionizing radiation increases in various fields. Such accidental exposures may occur at nuclear power plants, laboratories, and hospitals. Cytogenetic assays have been used for estimating radiation dose in the situation of the accidents. The micronucleus assay has several advantages over the other cytogenetic methods as it is simple and fast. The present study aimed at investigation of the micronuclei frequencies in cytokinesis-block cells in human blood lymphocytes after γ-irradiation and at establishment of a standard dose response relationship. The samples of peripheral blood were obtained from 6 different donors aged between 24 and 30 years old. The bloods were irradiated in vitro with 0-5 Gy. A linear quadratic dose-response equation was obtained by scoring the micronuclei in binucleated cells; y = 27.87x2 + 46.13x + 2.08 (r2 = 0.99). Irradiation caused a significant decrease in the nuclear division index. Necrotic and apoptotic cells increased in number after irradiation in a dose-dependent manner. In conclusion, the conventional cytokinesis-block micronucleus assay has proven to be the great technique in biological dosimetry. Dose-response calibration curve derived from CMBN assay could be used to estimate the exposure dose during a radiological emergency.
Radioactive materials and sources of ionizing radiation are widely used in medicine, industry, scientific research, and other fields (Gonzalez 2007). However, the rise in the use of radiation sources increases the risk for radiation exposure. All over the world, there have broken out 411 radiation accidents since 1944, causing injuries of more than 133,000 people (Ricks et al. 2000). Recently, on 11 March 2011, the Fukushima Daiichi nuclear power plant accident in Japan was the largest nuclear disaster since the Chernobyl accident of 1986 (Boice 2012, Tsubokura et al. 2012). Exposure to a significant dose of radiation negatively affects living cells in the body ranging from DNA damage to cell death. Ionizing radiation can give damage to human tissues in several ways. Some of the exposed cells may mutate to lead illnesses such as cancer (Wolbarst et al. 2010). In case of radiation emergencies, it is of importance to estimate the exposure dose in persons for several reasons. Physical dosimeters like film badges may be unavailable at the time of radiological accident. Biological dosimetry is suited for estimate radiation dose in the situation of these accidents (Ainsbury and Barquinero 2009). The methods of biological dosimetry encompass a wide range of cytogenetic analyses, such as micronucleus (MN), dicentric (DC), and premature chromosome condensation (PCC) assays. The micronucleus assay has many advantages over the other ones since it is rapid and requires less specialized expertise, and accordingly it can be applied to monitor a big population (Streffer et al. 1998). The cytokinesis-block micronucleus (CBMN) assay is a suitable method for MN measurement in cultured human as well as mammalian cells. In the CBMN assay, lymphocytes are chemically stimulated to proliferate in culture, followed by cytokinesis-block with cytochalasin-B (Cyt-B). As a result, nuclear divisions without cytokinesis (division of the cells) occur, and extranuclear chromatin particles (MN) are generated in binucleated cells (Fenech 2007).
Biodosimetric assays heavily rely on calibrations to dose-response curves established from the in vitro analyses (Amundson et al. 2001). The present experiment aimed at the investigation of the MN frequency in cytokinesis- block cells after exposure to various doses of γ-rays in human blood lymphocytes and at the establishment of a dose-response relationship that would be appropriate for the current conditions of our laboratory.
>
Blood collections and radiation exposures
Human peripheral blood was obtained by venipuncture from healthy donors (24-30 years old male and female donors, non-smokers). Blood (10 mL) from each donor was placed in vacutainer tubes (BD, Franklin Lakes, NJ, USA). Six mL of heparinized whole blood was divided into 6 containers; one group as the control and the others as experimental groups for exposure to 1, 2, 3, 4 and 5 Gy of γ-rays (0.2, 0.4, 0.6, 0.8, and 1 Gy/min, respectively). The absorbed dose was shown as the unit ‘Gy’ meaning the amount of energy deposited in mass of material by ionizing radiation (1 Gy = 1 J/kg). The sample containers were immediately irradiated with increasing doses of radiation from a 60Co isotopic source (42.6 TBq; AECL, Chalk River, Canada at the KAERI) at room temperature.
>
Cytokinesis-block micronucleus assay
The CBMN assay was carried out according to the cytogenetic procedure (International Atomic Energy Agency 2011). A half milliliter of blood was added to 4.5 mL culture medium (RPMI-1640; Cellgro, Manassas, VA, USA) supplemented with 10% fetal bovine serum (Cellgro), 100 UI/mL penicillin and 0.1 mg/mL streptomycin (Cellgro). Next, 100 μL of phytohemagglutin (PHA-M; Sigma-Aldrich, St. Louis, MO, USA) was added to stimulate lymphocyte proliferation. The blood samples incubated in 25 cm3 cell culture flask (Corning, Corning, NY, USA) in a humidified 5% CO2 incubator at 37℃ for 24 h. Following incubation, 20 μL Cyt-B (Cytochrome B; Sigma-Aldrich) was added to each sample. This culture was maintained for 48 h to block cytokinesis and to induce binuclear cells. After PHA stimulation for 72 h, cells were harvested by centrifugation (180
The stained slides were evaluated under a microscope (Olympus BX-50; Olympus Optical Co., Tokyo, Japan) at 400 fold magnification. For each sample, 1,000 binucleated (BN) cells were scored for micronuclei frequency, and 500 lymphocytes (mono-, bi- and poly-nucleated cells) were used for the assessment of cell proliferation.
Detailed scoring criteria in the CBMN assay have been well described in the literature (Fenech 2000, International Atomic Energy Agency 2011).
The cytokinesis-block BN cells that may be scored for MN frequency should have the following characteristics:
(a) The cells should be BN. (b) The nuclear membrane of a BN cell should be complete and be situated within the same cytoplasmic boundary. (c) The nuclei in a BN cell should be almost the same in size and staining intensity. (d) The nuclei in a BN cell may be connected by one or more fine nucleoplasmic bridges, which are not wider than 1/4th of the nuclear diameter. (e) The nuclei in a BN cell should not be overlapped with each other. (f) The cytoplasmic membrane of a BN cell should be intact and clearly distinguishable.
MN is distinguishable because they are smaller than the main nuclei. The following characteristics are in common for MN:
(a) The diameter of MN in human lymphocytes usually varies between 1/16th and 1/3rd of the mean diameter of the main nuclei, which corresponds to 1/256th and 1/9th of the area of one of the main nuclei in a BN cell, respectively. (b) MN is non-refractive and can therefore be readily distinguished from artifacts such as staining particles. (c) MN is clearly neither connected nor overlapped with the main nuclei. (d) The boundary of MN should be distinguishable from the nuclear boundary. (e) MN usually has the same staining intensity as the main nuclei but occasionally staining may be more intense.
These cell types have the following features:
(a) Mono-, bi-, and multi-nucleated cells are viable cells with an intact cytoplasm and normal nucleus morphology containing one, two, and three or more nuclei, respectively. (b) They may or may not contain one or more MN or nuclear buds (NBUD), and in the case of bi- and multi-nucleated cells they may or may not contain one or more nucleoplasmic bridge (NPB).
Scoring should be avoided amongst necrotic and apoptotic cells.
Statistical analysis of the experimental data was done using Microsoft Office Excel 2007 and PASW Statistics 18 (SPSS Inc, Chicago, IL, USA). The data were fitted on to a linear quadratic equation Y = ax2 + bx + c to establish a dose-response curve. The differences between the control and the exposed groups for nuclear division index (NDI) were analyzed for the significance by means of the paired t-test. The NDI was calculated by scoring the number of main nuclei in cell.
The experiments including collection of blood samples from the voluntary donors were started before onset of the Bioethics and Safety Act of Korea (23 March 2013). However, all the procedures regarding this study were based on obtained consent and followed the legal and regulatory requirements for human experimentations.
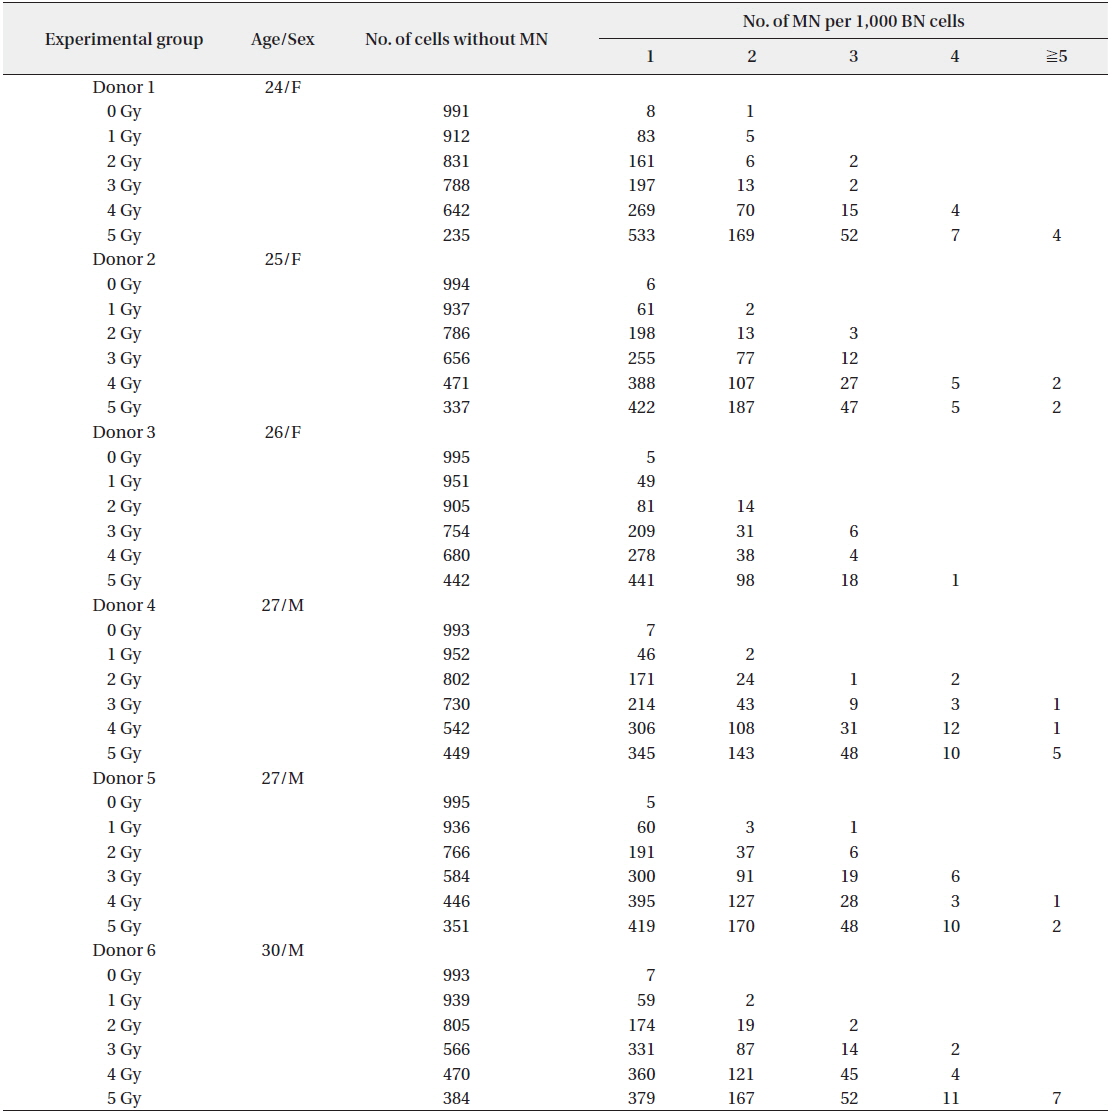
The dose rate was determined by Fricke dosimetry (Holm and Berry 1970). The frequencies of MN in BN cells induced by irradiation with 0−5 Gy are shown in Table 1. The results of the measurement of MN yields in 1,000 cells from each of 6 donors were presented. The number of normal BN cells without MN was dose dependently decreased.

MN per 1,000 BN cells (cytokinesis-blocked lymphocytes) following irradiation of human peripheral blood from 6 donors
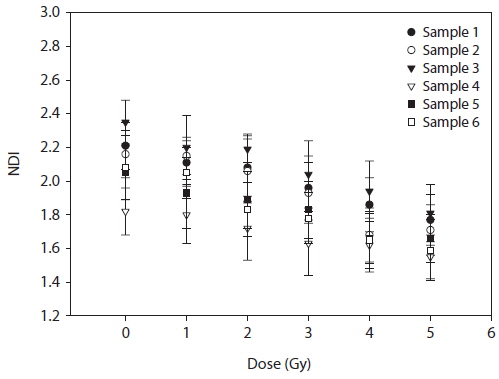
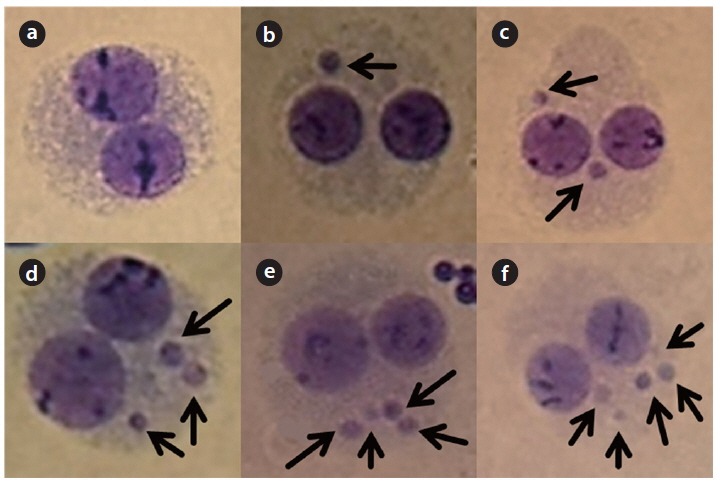
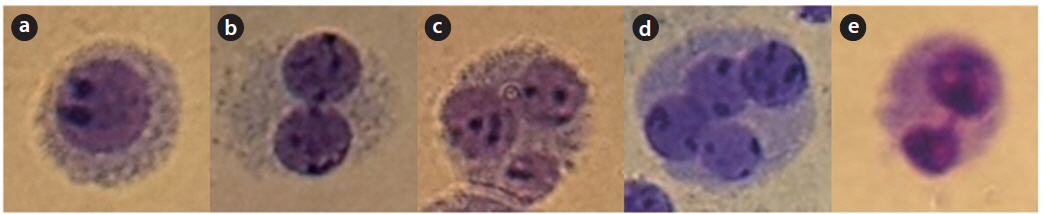
The frequency of total MN increased in a dose-dependent manner. In particular, up to 6 micronuclei were found in cells irradiated with 5 Gy of γ-rays (Fig. 1). A decrease of the NDI was detected with increasing radiation doses (Fig. 2). In comparison with the control value, MN increased 8.61, 31.75, 74.89, 87.45, and 51.91 fold higher after treatment with 1, 2, 3, 4, and 5 Gy, respectively.
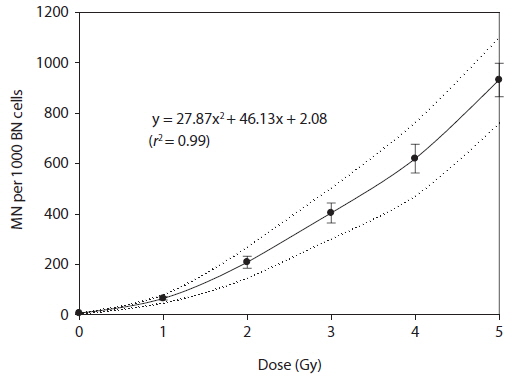
A dose-response of micronuclei frequency (MN per 1,000 BN cells) was best fitted to linear quadratic equation resulting in Y = 27.87x2 + 46.13x + 2.08. The dose-response curve was reported with 95% lower and upper confidence limits (Fig. 3).
The lymphocytes with one or more nuclei were observed in 1,000 viable cells (Fig. 4). The NDI values were calculated from the data obtained though cell scoring (Table 2). These data showed significant difference among the non-irradiated and the irradiated groups.
[Table 2.] Average values of nuclear division index (NDI)

Average values of nuclear division index (NDI)
This study describes the basic work needed for the establishment of a biological dosimetry. In vitro calibration curves are needed to use these methodologies for dose estimation, and each laboratory must obtain its own data because differences among laboratories or centers have been published. As reported earlier in the literature, the MN frequency and NDI in this study showed significant changes with radiation dose. The background MN frequency of this study was 2.08, which was in a fairly good agreement with the value reported in the IAEA EPR-biodosimetry manual (International Atomic Energy Agency 2011). According to IAEA manual, the background MN frequencies range from 0 to 40 per 1,000 BN cells. The dose-response calibration curve derived from the CMBN assay could be used to estimate the exposure dose during a radiological emergency. This study will be the foundation for biological dosimetric analysis with additional research methods such as DC, translocation, and PCC assay. In contrast with DC assay, the fairly radiationspecific analysis, MN assay can be induced by a wide range of confounding factors including smoking, living in heavy air pollution, and exposing to clastogens (Hogstedt and Karlsson 1985, Stenstrand 1985, Prosser et al. 1988). Therefore, further studies according to age, gender, and smoking status are required.