검색 전체 메뉴
PDF
맨 위로
OA 학술지
강원도 홍천강의 조류군집과 생물학적 지수에 의한 수질 평가 The Water Quality Assessment based on the Algal Communities and Biotic Indices in Hongcheon river, Gangwon-do
ABSTRACT

This research has studied the physicochemical environmental factors and communities of epilithic diatom and phytoplanktons at Hongcheon river from December 2011 to September 2012. In case of TN, the result was hypertrophic, and for TP, it ranged from mesotrophic to eutrophic. As for BOD, Hongcheon river was rated level II or better, according to the water quality level; values were found to be below 3mg/L at most sites. Total of 83 and 114 taxa of epilithic diatom and phytoplanktons respectively, were found during the research. When assessed using the TSI, it ranged from oligomesotrophic to eutrophic. In case of DAIpo, it ranged from 64.1 to 99.5, and TDI ranged from 51.5 to74.0. These results signify good water quality, level B or better, for Hongcheon river. P-IBI was rated moderate to low, which showed higher pollution than other indices. Among the biological water quality measures analyzed in the Hongcheon river study, DAIpo best matches TDI and BOD, while TDI showed greater pollution. Therefore, P-IBI appears to be inappropriate when assessing the domestic small rivers and lakes.


KEYWORD
DAIpo , epilithic diatom , Phytoplankton , P-IBI , TDI , TSI
  • 1. Introduction

    우리나라의 하천 및 호소 주변 토지이용은 농지나 위락시설로 이용되기 때문에 영양물질의 유입과 오염에 취약하며, 이에 따라 하천 및 호소의 부영양화가 초래된다(Lee et al., 2002). 이는 식물플랑크톤의 대발생을 일으키며, 종에 따라 독소 및 악취를 발생시키고, 산소고갈로 인해 생물의 폐사로 이어지기도 한다(Reynolds, 1984).

    수질평가는 이화학적 수질과 함께 생물학적 수질을 평가하는 것이 수계의 생물학적 건강성을 잘 나타낼 수 있는 방법이다. 부착조류를 이용한 생물학적 평가는 Diatom Assemblage Index to organic water pollution (DAIpo) (Watanabe et al., 1990)와 Trophic Diatom Index (TDI) (Kelly and Whitton, 1995)가 대표적이며, 이를 이용하여 국내에서도 많은 연구가 선행되고 있다. 그러나 부착조류를 이용한 생물학적 수질평가는 수심이 깊은 강이나 호소에서는 적용성이 떨어지는 단점이 있다.

    부착조류와 마찬가지로 식물플랑크톤은 수생태계의 1차 생산자로써 먹이망의 기본이 되며, 수질 변화에 민감하다. 따라서 식물플랑크톤의 정량적 분석은 수질 평가에 좋은 자료로 이용될 수 있다(Stoermor and Ladewski, 1978). 또한 식물플랑크톤의 우점종을 생물지표종으로 선정하여 수계의 영양상태를 간접적으로 평가할 수 있다(Reynolds, 1984; Yang and Dickman, 1993). 그러나 부착조류에 비해 식물플랑크톤을 이용한 생물학적 수질평가에 대한 연구는 미비한 실정이다(Borics et al., 2007).

    Karr (1981)에 의해 제안된 IBI (Index of Biotic Integrity)는 수생태의 생물학적 안정성을 평가하는데 널리 사용되는 통합지수이며(Wu et al., 2012), 어류, 저서성대형무척추동물, 부착조류를 사용한다. 그러나 IBI는 유량이 많은 강이나 호소에는 적용하기 힘든 단점이 있으므로 Wu et al. (2012)은 IBI를 바탕으로 식물플랑크톤만을 이용한 생물학적 안정성 평가인 P-IBI (Phytoplankton Index of Biotic Integrity)를 제안하였다. 식물플랑크톤은 수환경에 평가에 중요한 지표로 사용될 수 있다(Cabecinha et al., 2009; Domingues and Galvao, 2007). 따라서 식물플랑크톤을 이용한 생물학적 수질평가인 P-IBI는 호소의 생물학적 수질과 안정성을 평가하는 중요한 자료가 될 수 있다.

    본 연구에서는 홍천강 일대의 이화학적 환경요인과 계절 별 식물플랑크톤 및 부착조류의 군집분포를 분석하였다. 수질의 영양단계를 평가하는 TSI (Trophic Status Index)와 부착규조류 지수인 DAIpo와 TDI를 산출하고, 또한 식물플랑크톤을 이용한 P-IBI를 적용하여 수질 상태를 파악하고자 하였다. 이와 같은 지수들을 서로 비교 분석함으로써 홍천강 수계의 생물학적 안정성을 평가하고 각 지수의 상호보완 관계를 규명하고자 하였다.

    2. Materials and Methods

       2.1. 연구 대상지역

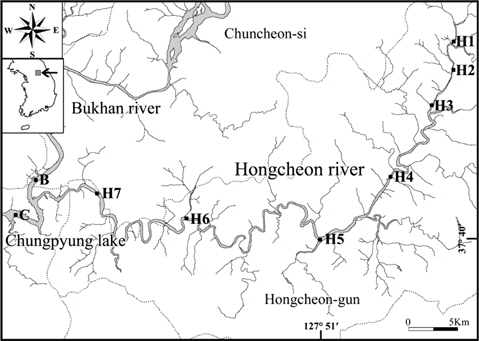
    강원도 홍천군에 위치한 홍천강과 청평호 및 북한강 합류 지점을 대상으로 2011년 12월부터 2012년 9월까지 계절별로 총 9개 정점을 선정하여 조사하였다(Fig. 1). 홍천강은 홍천군 서석면 생곡리에서 발원하여 서쪽으로 흐르며, 여러 개의 지류와 합류하면서 홍천군을 지나 춘천시 남면 관천리 경계에서 북한강과 합류하여 청평호로 흐르는 한강의 2차 지류이다(Choi and Kim, 2004). 본 연구의 홍천강 7개 정점은 상류에서 하류까지 강원도 홍천군 두촌면에 위치한 자은교(H1), 선평교(H2), 철정교(H3), 강원도 홍천군 화촌면 굴운교(H4), 강원도 홍천군 홍천읍 둔지교(H5), 강원도 홍천군 서면 팔봉교(H6), 강원도 홍천군 서면 충의대교(H7) 등이다. 그리고 홍천강의 수질 및 식물플랑크톤이 미치는 영향을 알아보기 위해 경기도 가평군 설악면에 위치한 청평호(C)와 이곳으로 유입되는 강원도 춘천시 남면에 위치한 북한강의 한 정점(B)을 선정하였다.

       2.2. 채집 및 분석방법

    수온, pH, DO, 전기전도도 및 탁도 등은 휴대용 기기(Horiba D-55, Japan)로 측정하였고, 수질분석(총질소, 총인, BOD 및 엽록소 a)을 위한 시료는 현장에서 2L 플라스틱 병에 담아 냉장 보관하여 실험실로 운반하였다. 수질분석은 Standard method (Greenberg et al., 2000)에 준하여 분석하였다.

    식물플랑크톤의 채집은 각 정점의 표층수 1L를 플라스틱 병에 담아 채수하였으며 10 ml의 Lugol's 용액으로 고정하였다. 이는 24시간 이상 정치한 후, 상등액을 제거하여 남은 시료를 균일하게 혼합한 뒤 Sedgwick-Rafter counting chamber에 넣고 광학현미경(Olympus BX 47, Japan)을 이용하여 200~400배로 계수하였다.

    부착조류의 정량채집을 위해 각 정점의 수심 20~30 cm에서 100 cm2정도의 호박돌이나 자갈을 선정하여 기질표면 25 cm2의 면적을 솔로 긁어내 증류수에 희석하여 채집하고, 포르말린 1%로 고정하였다. 부착조류의 영구표본은 U.S. EPA (1995)에 따라 제작하여 광학현미경(Olympus BX 47, Japan)으로 200~1,000배하에서 검경하였다.

    담수조류의 군집분석은 규조강의 경우 Ettl, Gartner, et al. (1991), Ettl, Gerloff, et al. (1986, 1988, 1991)Patrick and Reimer (1975)를 참고하였다. 그 외의 분류군은 Hirose et al. (1977)을 참고하였으며, Chung (1993) 그리고 Prescott (1962) 등을 참조하였다.

    홍천강의 수질 평가를 위해서 다음의 4가지 지수를 산출하였다. 투명도(SD)는 탁도를 가지고 환산하였으며(Davies-Colley and Smith, 2001), 엽록소 a 및 총인의 농도를 이용하여 TSI (Trophic Status Index)값과 영양단계를 평가하였다(Carlson, 1977; Forsberg and Ryding, 1980). 생물학적 수질평가는 부착규조류를 이용하여 영양염지수인 TDI (Kelly and Whitton, 1995)와 유기오탁지수인 DAIpo (Watanabe et al., 1990; Watanabe et al., 2005)를 산출하였다. 식물플랑크톤을 이용한 생물학적 건강성평가인 P-IBI는 엽록소 a, Saprobity Index (Van Dam et al., 1994), Cyanobacteria Index (Mischke and Behrendt, 2007), Margalef's diversity Index (Margalef, 1958), Spr (Species richness), Menhinick diversity Index (Menhinick, 1964)의 6가지 항목을 5등급으로 평가하였다(Wu et al., 2012).

    3. Results and Discussion

       3.1. 이화학적 환경요인

    수온은 0.48~28.74℃의 범위로 상류에서 하류로 갈수록 상승하였으며, DO는 7.96~18.65 mg/L 의 범위로 국내의 일반적인 하천 및 북한강 지류와 비슷한 경향을 나타냈다(Table 1) (Kim et al., 2012; Kim and Lee, 2011b; Kim et al., 2013). 전기전도도는 67~205 μs/cm의 범위를 나타냈으며, 휴양시설이 위치한 2012년 6월의 H6정점에서 205 μs/cm로 가장 높게 나타났다. 탁도는 1.0~10.8 NTU의 범위로 상류에서 하류로 갈수록 증가하였으며, 부유물질(SS)은 0.2~8.4 mg/L의 범위로 탁도와 비슷한 경향을 나타냈다.
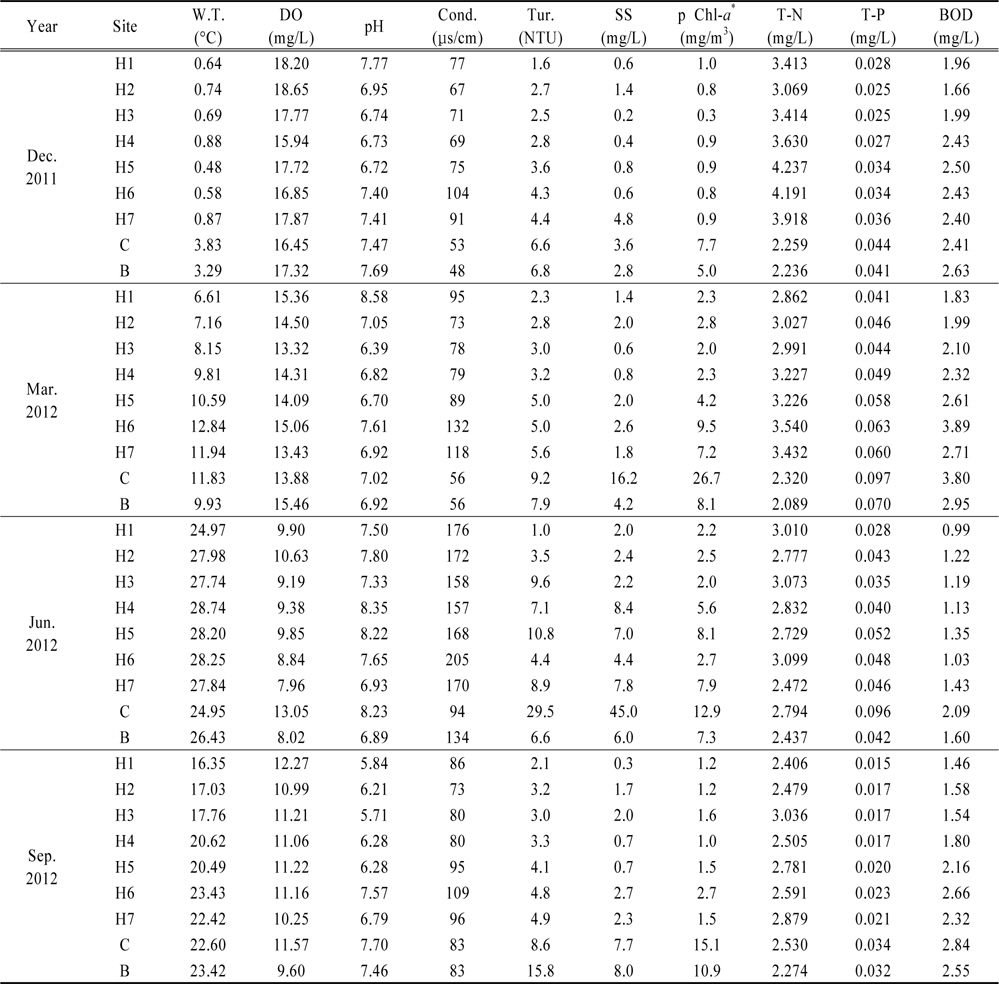
    [Table 1.] Physicochemical environmental factors at 9 sampling sites including 7 sites from Hongcheon river from Dec. 2011 to Sep. 2012

    label

    Physicochemical environmental factors at 9 sampling sites including 7 sites from Hongcheon river from Dec. 2011 to Sep. 2012

    홍천강 수계인 H1~H7 정점의 총질소는 2.089~4.237 mg/L의 범위로 2011년 12월의 H5 정점이 가장 높았으며, 2012년 9월 H1 정점이 가장 낮았다. 홍천강은 청평호와 북한강 지류인 C와 B 정점보다 높은 값을 나타냈으며, Forsberg and Ryding (1980)의 기준에 따르면 모든 정점이 1.50 mg/L 이상으로 과영양수역에 해당된다. 총인은 0.015~0.063 mg/L의 범위로 계절별 농도변화가 크게 나타났으며, 2012년 3월과 H6 정점에서 가장 높았으며, 2012년 9월 H1 정점에서 가장 낮았다. 상류에서 하류로 갈수록 인의 농도가 증가하였으며, 총질소와 반대로 H1~H7 정점의 총인이 C, B 정점보다 낮은 값을 나타났다. Forsberg and Ryding (1980)에 따르면, 0.025 mg/L 미만인 2012년 9월 H1~H7 정점은 중영양수역이며, 그 외 모든 정점은 0.100 mg/L 미만으로 부영양수역에 해당된다. 엽록소 a는 0.3~9.5 mg/m3 범위이며, 2012년 3월 H5~H7 정점과 2012년 6월 H4, H5 및 H7 정점을 제외한 모든 시기에 3 mg/m3 미만으로 빈영양단계를 나타냈다. 청평호인 C 정점은 7.7~26.7 mg/m3의 범위로 부영양단계를 나타냈다. 따라서, 홍천강에서 식물플랑크톤의 생물량이 하류로 갈수록 증가하였으며 또한 총인도 함께 증가하는 경향을 나타냈다. 이 두 환경요인의 상관분석 결과 상관성(r=0.72, n=28)이 높았으며, 총인이 식물플랑크톤의 군집에 영향을 미친 것으로 사료된다(Kim and Lee, 2011a).

    BOD는 0.99~3.89 mg/L의 범위로 Standard method (Greenberg et al., 2000)의 기준으로 좋음(Ia)~약간 좋음(II) 등급에 해당하는 수질이며, 각 계절별 농도차이가 큰 것으로 나타났다. 특히, 갈수기인 3월에 1.83~3.89 mg/L의 범위로 다른 계절에 비해 높게 나타났으나, BOD는 엽록소 a 및 영양염류와 더불어 상류에서 하류로 갈수록 증가하였으며 2009년의 홍천강 수계의 수질과 비슷한 경향을 보여주고 있다(Lee et al., 2011).

       3.2. 부착규조류

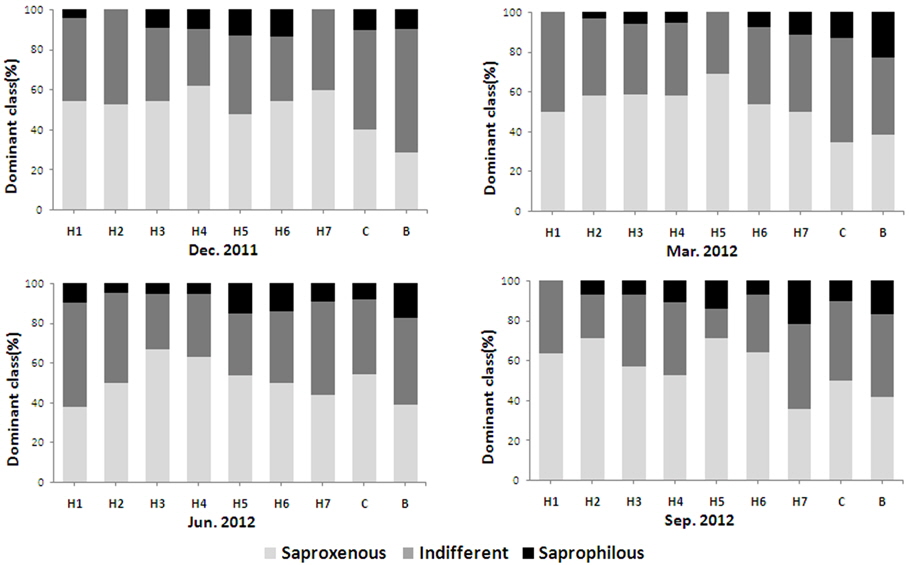
    조사기간 중 홍천강에서 출현한 부착규조류는 2목 3아목 8과 23속 73종 9변종 1품종으로 총 83분류군이 출현하였다. Watanabe et al. (2005)의 기준에 따라 출현종을 구분하면 광적응성종(Indifferent species)이 50.6%, 호청수성종(Saproxenous species)이 43.4%, 호오염성종(Saprophilous species)이 6.0%의 출현빈도를 보여 상대적으로 광적응성종이 많이 출현하는 것으로 나타났다(Fig. 2). 2012년 6월 H1 정점 및 청평호와 북한강지류를 제외한 나머지 정점에서는 청수성종이 42.5%이상 우점하였으며, 홍천강 수계 중 H5 정점의 경우 호오염성종의 우점율이 2012년 3월을 제외한 모든 시기에 높았으며, 이는 도심을 지나 탁도 발생 및 영양염의 증가 때문인 것으로 사료된다. 홍천강 수계에서 우점종은 호청수성종인 Achnanthes convergens, Cymbella turgidula 가 대부분 정점에서 우점하였으며, 광적응성 종인 Achnanthes minutissima 가 일부 정점에서 우점하였다.

       3.3. 식물플랑크톤

    홍천강에 출현한 식물플랑크톤은 5문 7강 11목 6아목 24과 2아과 50속 100종 13변종 1품종으로 총 114분류군이 출현하였다. 이는 규조류가 73분류군(64.0%)으로 가장 많이 출현하였으며, 녹조류는 28분류군(24.6%), 남조류는 7분류군(5.3%), 유글레나 등의 기타 분류군이 6분류군(5.3%)이다.

    우점종은 규조류인 Achnanthes convergens, A. minutissima, Cymbella turgidula, Fragilaria construens var. binodis, F. crotonensis 와 남조류인 Oscillatoria limnetica, Phormidium valderianum, 녹조류인 Scenedesmus acuminatus, S. opoliensis 등 9 분류군으로 나타났다(Table 2). 비교적 유량이 적고 유속이 빠른 상류 구간인 H1~H5 정점에서는 부착성인 Achnanthes minutissimaCymbella turgidula (Watanabe et al., 2005) 등의 출현 빈도가 높았다. 강원도 동강, 충청북도 소옥천과 대청호의 연구에서도 Achnanthes minutissima가 부유성에서도 출현하며 우점하는 현상을 나타낸 바 있다(Kim and Lee, 2011a; Lee, 2004). 상류 정점에서 우점한 Achnanthes minutissima 는 하류로 갈수록 출현 빈도가 점차 감소하였으나, 부유성인 Fragilaria crotonensis 는 하류로 갈수록 유량이 증가하고 유속이 감소함에 따라 출현빈도가 증가하는 경향을 나타냈다.
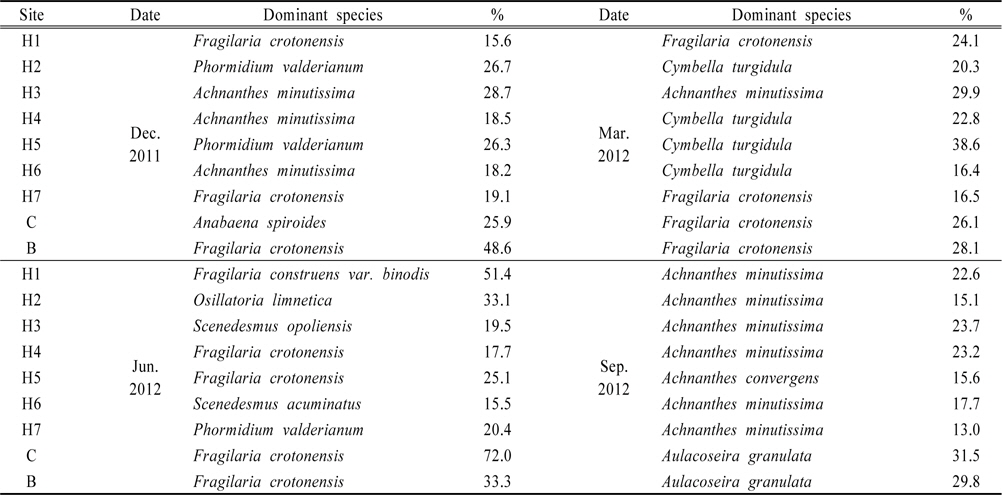
    [Table 2.] The dominant species of phytoplanktons at 9 sites including 7 sites in Hongcheon river from Dec. 2011 to Sep. 2012

    label

    The dominant species of phytoplanktons at 9 sites including 7 sites in Hongcheon river from Dec. 2011 to Sep. 2012

    2011년 동계에 북한강 수계에서 이취미의 문제를 일으켰던 Anabaena spiroides (You et al., 2013)는 2011년 12월의 B 정점에서 출현하였고, C 정점에서는 25.86%로 우점하였다. 그리고 2012년 6월과 9월 C와 B 정점에서 출현하였다. 홍천강 수계의 상류 정점에서는 출현하지 않았으며 이는 청평호의 Anabaena spiroides 가 북한강으로 부터 영향을 받은 것으로 사료된다.

       3.4. DAIpo와 TDI 평가

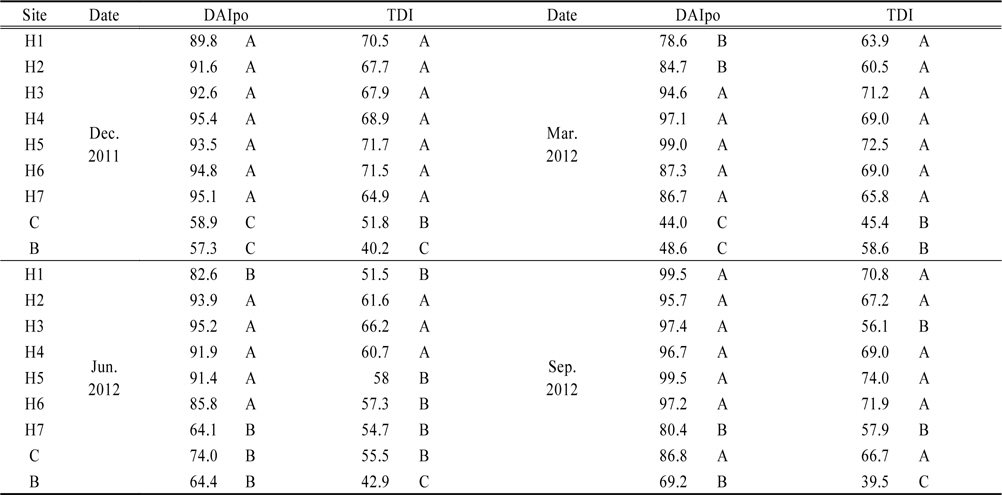
    DAIpo와 TDI를 이용한 생물학적 수질평가 결과, 홍천강의 DAIpo 지수는 64.1~99.5의 범위로 나타났고, TDI는 51.5~74.0의 범위로 A~B등급을 나타냈다(MOE, 2007)(Table 3). DAIpo의 경우 홍천강 수계는 B등급 이상으로 양호한 수질이며, 청평호인 C 정점의 경우 A~C등급, 북한강 지류인 B 정점은 B~C등급으로 홍천강 정점에 비해 낮게 나타났다. TDI의 경우, B등급 이상으로 양호한 수질이며, 2011년 12월과 2012년 3월에는 A등급 이상으로 최상의 등급이다. C 정점의 경우 B등급 이상으로 2012년 9월에는 66.7인 A등급이며, B 정점은 B~C등급으로 비교적 낮게 나타났다. 규조류를 이용한 생물학적 수질평가는 대체로 TDI가 DAIpo에 비해 높은 오염 등급을 나타내는 것으로 보고되었으나(Hwang et al., 2006; Kim et al., 2009), 홍천강 수계에서는 두 지수가 비슷한 등급으로 나타났다(Kim et al., 2012).

    [Table 3.] DAIpo and TDI at 9 sites including 7 sites in Hongcheon river from Dec. 2011 to Sep. 2012
    label

    DAIpo and TDI at 9 sites including 7 sites in Hongcheon river from Dec. 2011 to Sep. 2012

    일반적으로 하류로 갈수록 오염도가 증가하는 경향을 보이지만(Kim et al., 2009), 홍천강 수계의 DAIpo와 TDI에서는 B등급 이상으로 큰 영향이 없는 것으로 나타났다. 청평호의 경우 홍천강 수계보다 북한강 지류에 의한 영향을 받는 것으로 사료된다.

       3.5. TSI 평가

    홍천강의 TSI 값은 39.47~58.97의 범위로 중빈영양단계(OM: Oligomesotrophic)~부영양단계(E:Eutrophic)의 등급을 나타냈다(Table 4). H1 정점의 TSI 값은 중빈영양단계(39.47)인 2012년 9월을 제외한 모든 시기에 50 이하로 중영양단계이며, H1~H7 정점은 동계인 2011년 12월과 추계인 2012년 9월에는 중영양단계, 춘계와 하계인 2012년 3월과 6월에는 60 이하의 값으로 부영양단계이다. C와 B 정점은 모든 시기에 55.12~65.55로 부영양단계를 나타냈으며, 홍천강 수계보다 높은 영양 등급으로 나타났다.

    [Table 4.] TSI of 9 sites including 7 sites in Hongcheon river from Dec. 2011 to Sep. 2012
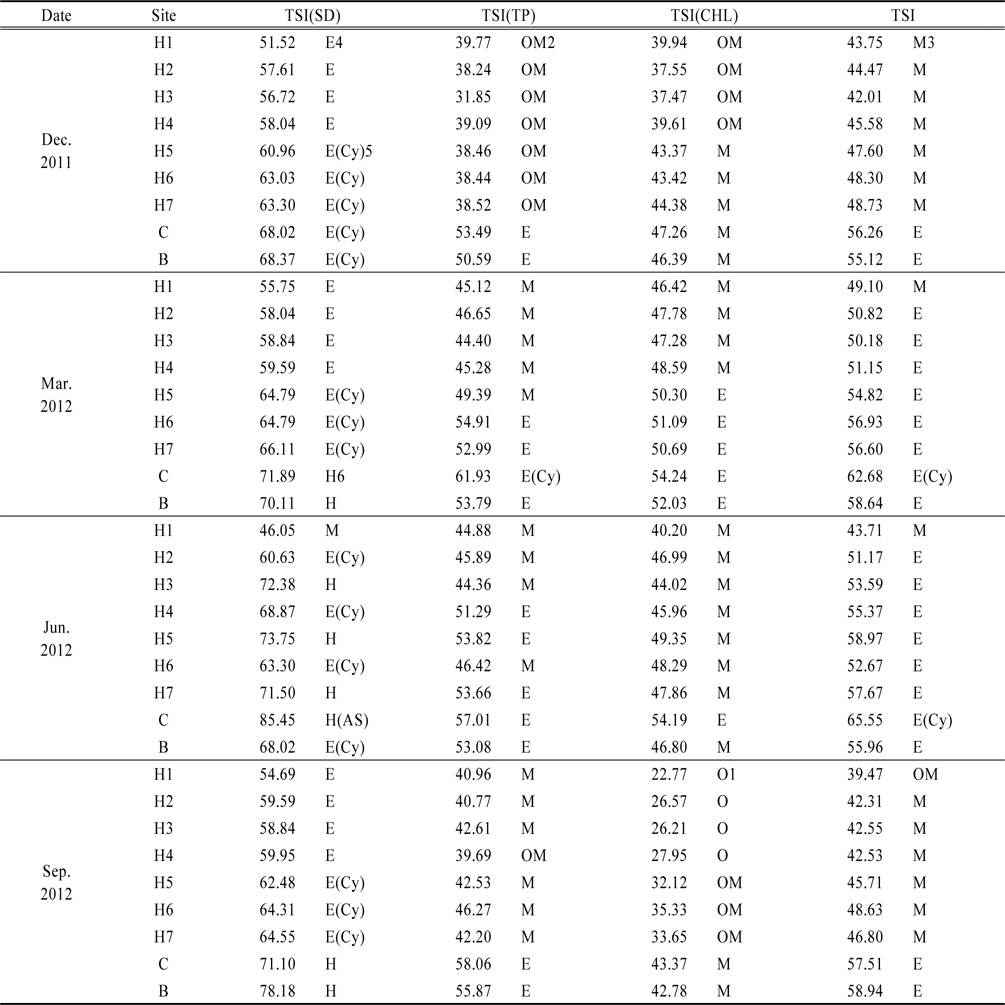
    label

    TSI of 9 sites including 7 sites in Hongcheon river from Dec. 2011 to Sep. 2012
    TSI (SD) 값은 2012년 6월의 H1 정점을 제외한 모든 시기와 정점에서 50 이상으로 부영양단계 이상을 보여 전체적으로 높은 값을 나타냈다. TSI (TP)는 홍천강 수계에서 2012년 3월 H6, H7 정점과 2012년 6월 H4, H5, H7정점을 제외한 모든 시기에 중영양단계이며, C와 B 정점에서는 모두 부영양단계로 홍천강 수계와 상반된 결과를 나타냈다. TSI (Chl-a) 값은 22.77~51.09의 범위로 TSI (TP)와 유사하게 상류에서 하류로 갈수록 높아지는 경향을 보였다.

    TSI는 2012년 3월과 6월의 결과에서 부영양화단계로 BOD, TDI 및 DAIpo와 비교할 때 상대적으로 더 오염된 정도를 나타냈다(Table 3, 4). 이는 총인이 증가함에 따라 식물플랑크톤의 생물량이 증가하였고, 엽록소 a와 SD 등의 전체 값이 증가함으로써 TSI가 부영양화단계로 나타난 결과이다. 국내 수계인 충남 당진군의 저수지와 연곡천과 사천천 연구에서도 TSI가 춘계와 하계에 BOD, DAIpo 및 TDI에 비해 높은 값을 나타낸 바 있다(Kim and Lee, 2010; Song et al., 2011).

       3.6. P-IBI

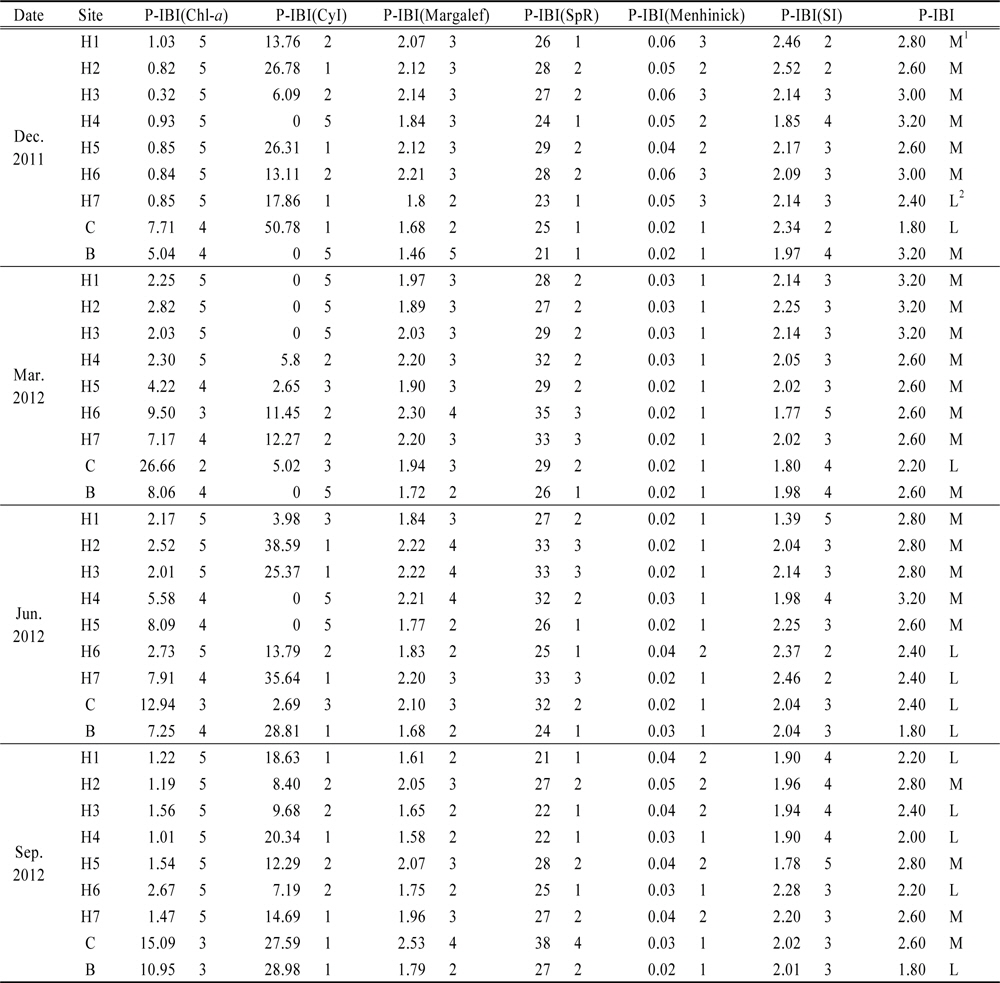
    홍천강의 P-IBI 값은 2.0~3.2의 범위로 Wu et al. (2012)이 제시한 5개의 등급에 의하면 보통(Moderate)~낮음(Low)에 해당된다(Table 5). 홍천강 수계의 중상류인 H1~H5 정점은 2012년 9월을 제외한 모든 시기에 보통(Moderate)의 등급이고, 하류인 H6, H7 정점과 청평호 및 북한강 지류는 보통과 낮음의 등급을 나타내었고, 특히 2012년 6월에는 2.4 이하 값으로 낮음의 등급을 나타냈다. P-IBI (Chl-a) 값에서 홍천강은 2012년 3월 H6 정점을 제외한 모든 시기에 9.04 이하의 값인 좋음 이상의 등급으로 나타났다. C 정점은 7.71~26.66의 범위인 2~4등급으로써 변동이 크게 나타났으며 홍천강에 비해 P-IBI (Chl-a) 안정성이 낮았다.

    [Table 5.] P-IBI of 9 sites including 7 sites in Hongcheon river from Dec. 2011 to Sep. 2012

    label

    P-IBI of 9 sites including 7 sites in Hongcheon river from Dec. 2011 to Sep. 2012

    P-IBI (CyI) 값은 0~38.59의 범위로 1~5등급까지 변동이 크게 나타났으며, 2011년 12월 H4 정점 및 2012년 6월 H4, H5 정점은 남조류 출현이 없으므로 정점 간 지수 값이 크게 변동되었다. 2011년 12월 C 정점의 경우 남조류인 Anabaena spiroides 가 50%로 우점하였다. P-IBI (SpR) 값은 21~35의 범위, P-IBI (Menihinick) 값은 0.02~0.06의 범위로 1~3등급이며 수질 상태와 상관없이 출현종과 개체량에 따라 지수 값 차이가 심하게 나타났으며 다른 지수에 비해 오염도가 높았다. P-IBI (SI) 값은 1.39~2.52의 범위로 2~5등급까지 나타났으며 정점 간 등급의 변화가 크게 나타났다. 따라서, P-IBI는 P-IBI (Chl-a) 외에는 BOD, DAIpo, TDI 등과 수질평가에 있어 일관성 있는 결과를 나타내지 못하였고, 본 수역에 적용하기에 적합하지 않은 것으로 사료된다.

    4. Conclusion

    2011년 12월부터 2012년 9월까지 홍천강 수계 및 청평호와 북한강 각 1 정점을 대상으로 이화학적 환경요인, 부착규조류 및 식물플랑크톤의 군집을 조사하였다. 또한 조사된 군집을 이화학적 지수 및 생물학적 지수를 통해 홍천강 수계의 수질상태를 평가하였다.

    1) 부착규조류는 2목 3아목 8과 23속 73종 9변종 1품종인 총 83분류군이 출현하였고, 이중 광적응성종이 50% 이상 출현하였고, 호청수성종인 Achnanthes convergens, Cymbella turgidula 및 광적응성종인 Achnanthes minutissima 가 우점하였다. 식물플랑크톤은 7강 11목 6아목 23과 2아과 50속 100종 13변종 1품종인 총 114분류군으로 규조류가 가장 많이 출현하였으며, 청평호와 북한강 지류에서 Anabaena spiroides 가 출현하였다.

    2) TSI 값의 경우 39.47~58.97로 빈중영양단계에서 부영양 단계이며, 최상류 지점(H1)과 2011년 12월 및 2012년 9월 홍천강 수계를 제외한 나머지 정점은 부영양단계로 나타났다. 또한 2012년 3월과 6월 청평호에서는 남조류 발생에 의한 부영양단계를 나타냈다.

    3) DAIpo 값은 64.1~99.5, TDI 값은 51.5~74.0의 범위로, 홍천강 수계는 모든 시기에 B 등급 이상으로 수질 상태가 양호하였다.

    4) P-IBI의 값은 2.00~3.20으로 보통에서 낮음 단계이며 다른 지수에 비해 오염도가 높게 나타났다. 따라서 P-IBI는 P-IBI (Chl-a)외에는 홍천강수계에서 BOD, DAIpo, TDI 등의 수질평가와 일관성 있는 결과를 나타내지 못했다.

    5) 홍천강의 연구에서 생물학적 수질평가 지수중 DAIpo, TDI가 BOD와 가장 일치하는 경향을 나타냈고, 반면 TSI는 이에 비해 좀 더 오염된 값을 나타냈다. 또한 P-IBI는 국내의 소하천을 평가하기에는 적합지 않은 것으로 사료된다.
참고문헌
  • 1. Borics G., Varbiro G., Grigorszky I., Krasznai E., Szabo S., Kiss K. 2007 A New Evaluation Technique of Potamo-Plankton for the Assessment of the Ecological Status of Rivers [Archiv fur Hydrobiologie] Vol.17 P.465-486 google
  • 2. Cabecinha E., Cortes R., Cabral J., Ferreira T., Lourenco M., Pardal M. 2009 Multi-Scale Approach Using Phytoplankton as a First Step Towards the Definition of the Ecological Status of Reservoirs [Ecological Indicators] Vol.9 P.240-255 google cross ref
  • 3. Carlson R. E. 1977 A Trophic Status Index for Lakes [Limnology and Oceanography] Vol.22 P.361-369 google cross ref
  • 4. Choi J. S., Kim J. K. 2004 Ichthyofauna and Fish Community in Hongcheon River, Korea [Korean Journal of Environment Biology] Vol.18 P.446-455 google
  • 5. Chung J. 1993 Illustration of the Freshwater Algae of Korea P.496 google
  • 6. Davies-Colley R. J., Smith D. G. 2001 Turbidity, Suspended Sediment, and Water Clarity: A Review [Journal of the American Water Resources Association] Vol.37 P.1085-1101 google cross ref
  • 7. Domingues R., Galvao H. 2007 Phytoplankton and Environmental Variability in A Dam Regulated Temperate Estuary [Hydrobiologia] Vol.586 P.117-134 google cross ref
  • 8. Ettl H., Gartner G., Gerloff J., Heynig H., Mollenhauer D. 1991 SuBwasserflora von Mitteleuropa. Band 2/4, Bacillariophyceae P.437 google
  • 9. Ettl H., Gerloff J., Heynig H., Mollenhauer D. 1986 SuBwasserflora von Mitteleuropa. Band 2/1, Bacillariophyceae P.876 google
  • 10. Ettl H., Gerloff J., Heynig H., Mollenhauer D. 1988 SuBwasserflora von Mitteleuropa. Band 2/2, Bacillariophyceae P.596 google
  • 11. Ettl H., Gerloff J., Heynig H., Mollenhauer D. 1991 SuBwasserflora von Mitteleuropa. Band 2/3, Bacillariophyceae P.576 google
  • 12. Forsberg C., Ryding V. H. 1980 Eutrophication Parameters and Trophic State Indices in 30 Wsedish Waste-Receiving Lakes [Archives of Hydrobiology] Vol.89 P.189-207 google
  • 13. Greenberg A. E., Clesceri L. S., Eaton A. N. 2000 Standard Method for the Examination of Water and Wastewater google
  • 14. Hirose H. M., Akiyama T., Imahori K., Kasaki H., Kumana S., Kobayasi H., Takahashi E., Tsumura T., Hirano M., Yamagishi T. 1977 Illustration of the Japanese freshwater Algae P.932 google
  • 15. Hwang S. J., Kim N. Y., Won D. H., An K. K., Lee J. K., Kim C. S. 2006 Biological Assessment of Water Quality by Using Epilithic Diatoms in Major River Systems (Geum, Youngsan, Seomjin River) [Journal of Korean Society on Water Environment] Vol.22 P.784-795 google
  • 16. Karr J. 1981 Assessment of Biotic Integrity Using Fish Communities [Fisheries] Vol.6 P.21-27 google cross ref
  • 17. Kelly M. G., Whitton B. A. 1995 The Trophic Diatom Index: A New Index for Monitoring Eutrophication in Rivers [Journal of Applied Phycology] Vol.7 P.433-444 google cross ref
  • 18. Kim J. W., Rhee Y., Lee O. M. 2012 The Epilithic Diatom Community and Water Quality Assessment in Pyengchang River and Inflow Streams of Gangwon-do [Journal of Korean Society on Water Environment] Vol.28 P.531-537 google
  • 19. Kim O.J., Lee O.M. 2011 Phytoplankton Community and the Evaluation of Water Quality Status in So-ok Stream, the Inflowing Stream to Daechung Lake [Korean Journal of Limnology] Vol.44 P.113-128 google
  • 20. Kim Y.J., Lee O.M. 2010 Assessment of Water Quality in Namdae-Stream, Yeongok-Stream and Sacheon-Stream Using Trophic Status and Epilithic Diatom Indices [Korean Society of Environmental Impact Assessment] Vol.43 P.117-128 google
  • 21. Kim Y.J., Lee O.M. 2011 The Phytoplankton Community of Namdae-stream, Yeongok-stream and of Sacheon-stream in Gangwon-do [Korean Society of Environmental Impact Assessment] Vol.20 P.281-297 google
  • 22. Kim Y. J., Lee O. M. 2013 The Water Quality Assessment based on Phytoplankton Community and Physicochemical Factors of Oship-stream, Songchun-stream and Namdae-Stream in Gyeongsangbukdo [Journal of Korean Society on Water Environment] Vol.29 P.428-437 google
  • 23. Kim Y.J., Shin K.A., Lee O.M. 2009 Water Quality Assessed by DAIpo and TDI of Bokha Stream and Dal Stream in South-Han River [Korean Journal of Environmental Biology] Vol.27 P.414-424 google
  • 24. Lee J.H. 2004 The Water Quality and the Phytoplankton Communities in the Dong River of Kangwon Province [Algae] Vol.19 P.217-226 google cross ref
  • 25. Lee J.H., Park J.G., Kim E.J. 2002 Trophic States and Phytoplankton Compositions of Dam Lakes in Korea [Algae] Vol.17 P.275-281 google cross ref
  • 26. Lee J.Y., Lee G.S., Ahn H.K., Ha S.R. 2011 Estimation of Habitats Suitability Index based on Hydraulic Conditions [Journal of Wetlands Research] Vol.13 P.149-160 google
  • 27. Margalef R. 1958 Information Theory in Ecology [General Systems] Vol.3 P.36-71 google
  • 28. Menhinick E. 1964 A Comparison of Some Species-Individuals Diversity Indices Applied to Samples of Field Insects [Ecology] Vol.45 P.859-861 google cross ref
  • 29. 2007 Ecowater Health Research and Assessment Guidelines P.163 google
  • 30. Mischke U., Behrendt H. 2007 Handbuch zum Bewertungsverfahren von Fliesgewassern mittels Phytoplankton zur Umsetzung der EUWasserrahmenrichtlinie in Deutschland google
  • 31. Patrick R., Reimer C. W. 1975 The Diatoms of the United States. Exclusive of Alaska and Hawaii, Vol. II part 1 P.213 google
  • 32. Prescott G. W. 1962 Algae of the Western Great Lakes Area P.976 google
  • 33. Reynolds C. S. 1984 The Ecology of Freshwater Phytoplankton P.384 google
  • 34. Song M.A., Kim J.W., Kim H.N., Kong D.S., Lee O.M. 2011 Water Quality Assessment Using Trophic Status Index and Attached Diatom Index in 10 Reservoirs Including Ye-dang Reservoir of Chungcheongnam-do [Korean Journal of Ecology and Environment] Vol.44 P.155-171 google
  • 35. Stoermor E. F., Ladewski T. B. 1978 Phytoplankton Association in Lake Ontario during IFYGL (International Field Year for the Great Lakes) P.64 google
  • 36. 1995 Generic Quality Assurance Project Plan Guidance for Programs Using Community-Level Biological Assessment in Stream and Wadeable Rivers google
  • 37. Van Dam H., Mertens A., Sinkeldam J. 1994 A Coded Checklist and Ecological Indicator Values of Freshwater Diatoms from the Netherlands [Netherlands Journal of Aquatic Ecology] Vol.28 P.117-133 google cross ref
  • 38. Watanabe T., Asai K., Houki A. 1990 Numerical Simulation of Organic Pollution in Flowing Waters [Hazardous Waste Containment and Treatment] Vol.4 P.251-281 google
  • 39. Watanabe T., Ohtzsuka T., Tuji A., Houki A. 2005 Picture Book and Ecology of the Freshwater Diatoms P.666 google
  • 40. Wu N., Schmalz B., Fohrer N. 2012 Development and Testing of a Phytoplankton Index of Biotic Integrity (P-IBI) for a German Lowland River [Ecological Indicators] Vol.13 P.158-167 google cross ref
  • 41. Yang J. R., Dickman M. 1993 Diatoms as Indicator of Lake Trophic Status in Central Ontario, Canada [Diatom Research] Vol.8 P.179-193 google cross ref
  • 42. You K. A., Byeon M. S., Youn S. J., Hwang S. J., Rhew D. H. 2013 Growth Characteristics of Blue-green Algae (Anabaena spiroides) Causing Tastes and Odors in the North-Han River [Korean Journal of Ecology and Environment] Vol.46 P.135-144 google cross ref
이미지 / 테이블
  • [ Fig. 1. ]  The map showing 9 sampling sites including 7 sites from Hongcheon river in Gangwon-do from Dec. 2011 to Sep. 2012.
    The map showing 9 sampling sites including 7 sites from Hongcheon river in Gangwon-do from Dec. 2011 to Sep. 2012.
  • [ Table 1. ]  Physicochemical environmental factors at 9 sampling sites including 7 sites from Hongcheon river from Dec. 2011 to Sep. 2012
    Physicochemical environmental factors at 9 sampling sites including 7 sites from Hongcheon river from Dec. 2011 to Sep. 2012
  • [ Fig. 2. ]  The dominant classes of epilithic diatoms at 9 sampling sites including 7 sites from Hongcheon river from Dec. 2011 to Sep. 2012.
    The dominant classes of epilithic diatoms at 9 sampling sites including 7 sites from Hongcheon river from Dec. 2011 to Sep. 2012.
  • [ Table 2. ]  The dominant species of phytoplanktons at 9 sites including 7 sites in Hongcheon river from Dec. 2011 to Sep. 2012
    The dominant species of phytoplanktons at 9 sites including 7 sites in Hongcheon river from Dec. 2011 to Sep. 2012
  • [ Table 3. ]  DAIpo and TDI at 9 sites including 7 sites in Hongcheon river from Dec. 2011 to Sep. 2012
    DAIpo and TDI at 9 sites including 7 sites in Hongcheon river from Dec. 2011 to Sep. 2012
  • [ Table 4. ]  TSI of 9 sites including 7 sites in Hongcheon river from Dec. 2011 to Sep. 2012
    TSI of 9 sites including 7 sites in Hongcheon river from Dec. 2011 to Sep. 2012
  • [ Table 5. ]  P-IBI of 9 sites including 7 sites in Hongcheon river from Dec. 2011 to Sep. 2012
    P-IBI of 9 sites including 7 sites in Hongcheon river from Dec. 2011 to Sep. 2012
(우)06579 서울시 서초구 반포대로 201(반포동)
Tel. 02-537-6389 | Fax. 02-590-0571 | 문의 : oak2014@korea.kr
Copyright(c) National Library of Korea. All rights reserved.