검색 전체 메뉴
PDF
맨 위로
OA 학술지
Biocide sodium hypochlorite decreases pigment production and induces oxidative damage in the harmful dinoflagellate Cochlodinium polykrikoides
ABSTRACT
Biocide sodium hypochlorite decreases pigment production and induces oxidative damage in the harmful dinoflagellate Cochlodinium polykrikoides
KEYWORD
antioxidant enzyme activity , chlorophyll autofluorescence , Cochlodinium polykrikoides , harmful algal blooms , sodium hypochlorite
  • INTRODUCTION

    Sodium hypochlorite (NaOCl) is used as a disinfectant or a bleaching agent, and it is the most commonly used biocide in the drinking water industry and swimming pools (Hahn et al. 2005). NaOCl is generally used because it is cost efficient, readily available and easy to handle (Peker et al. 2014). NaOCl reacts with water to form hypochlorous acid (HOCl) (White 2010), which interferes with protein unfolding, inhibits glucose oxidation (Winter et al. 2008), and depletes adenine nucleotides (Rosen et al. 1998), thereby causing physiological and biochemical damages to the exposed organisms (Vitro et al. 2005). Moreover, since HOCl is a reactive oxygen species (ROS) (Halliwell 2006), it has the potential to be used for the removal of harmful algal blooms (HABs) in marine environments. Application of NaOCl to HAB species may result in cellular damages and reduced cell division (Estrela et al. 2002). However, effects of NaOCl on the cellular responses of HABs have not been studied sufficiently, in particular, with emphasis on physiological and biochemical aspects.

    Aerobic organisms generate different ROS such as super oxide anion, hydrogen peroxide, hydroxyl radical, and hypochlorous acid through the reduction of molecular oxygen (Spickett et al. 2000). Low to moderate levels of ROS serve as signaling molecules for altering gene expression and for modulating the activities of stress-related proteins (Sharma et al. 2012). Various external factors such as biocides, light, temperature, and pH variations stimulate ROS production (Sharma et al. 2012). High concentrations of ROS lead to peroxidation of lipids, oxidation of proteins, damage to nucleic acids, etc. (Mishra et al. 2011). However, cells can protect themselves against such oxidative damage through well-organized antioxidative systems that include several low-molecular-weight compounds (e.g., carotenoids [CAR]) and antioxidant enzymes (Tripathi et al. 2006). For example, in cells, super oxide dismutase (SOD) acts as the first line of defense against ROS (Ken et al. 2005). Other antioxidant enzymes such as catalase and peroxidase are reported to counteract oxidative stress in both higher plants and microalgae (Wang et al. 2012).

    In the present study, we determined the efficiency of the biocidal agent NaOCl in controlling the growth of the harmful dinoflagellate Cochlodinium polykrikoides. In particular, we evaluated the biocidal and toxicological effects of NaOCl on the cellular responses of C. polykrikoides, with emphasis on variations in pigments chlorophyll a and CAR levels and enzyme activities. The test organism is a well-known, red tide-forming species associated with massive fish kills that result in severe economic losses in countries such as Japan and Korea; its blooms have been recently reported from several countries, including Malaysia, India, Iran, Europe, and North America (reviewed by Kudela and Gobler 2012).

    MATERIALS AND METHODS

      >  Experimental organism and toxicity assay

    C. polykrikoides (CP-1) was obtained from the National Fisheries Research and Development Institute (NFRDI), Korea, and was cultured in f/2 medium. The cells were maintained at 20℃ under a 12 : 12 h light : dark cycle with a photon flux density of ~65 μmol photons m−2s−1 (Ebenezer and Ki 2012).

    NaOCl (Cat. No. 425044; Sigma, St. Louis, MO, USA) was commercially obtained. The stock solution (1,000 mg L−1) was prepared by diluting the commercially obtained solution with autoclaved distilled water (ADW) for which the chlorine demand was previously determined to be below the detection limit (<0.01 mg L−1). Nominal doses of chlorine 0.1, 0.5, 1.0, 2.0, and 3.0 mg L−1 were prepared by diluting the stock in ADW. Free chlorine concentration (concentration of hypochlorous acid and hypochlorite ion) was spectrophotometrically determined by N,N-diethyl-phenylene-diamine (DPD) at 515 nm (Clesceri et al. 1998). The chlorine demand of the f/2 medium was determined to be 1.2 mg L−1 (5 mg L−1 of chlorine was dosed tothe medium in triplicate and the contact time was 60 min to determine the chlorine demand).

    Doses of NaOCl adjusted according to chlorine demand, as described above, were added to 200 mL of C. polykrikoides culture at the exponential phase in triplicates. The initial cell concentration was (3.0 ± 0.1) × 104 cells mL−1. The samples were drawn for growth-based assays and biochemical assays at 0, 6, 12, 24, and 72 h. The free chlorine concentration was determined at 5, 15, and 30 min and 1, 6, 12, and 24 h using the standard DPD method (Clesceri et al. 1998).

      >  Cell observations and the median effective concentration (EC50)

    Cell counts in each test flask were determined using a plankton-counting chamber (HMA-S6117; Matsunami Glass, Osaka, Japan) and were plotted against time of exposure to NaOCl.

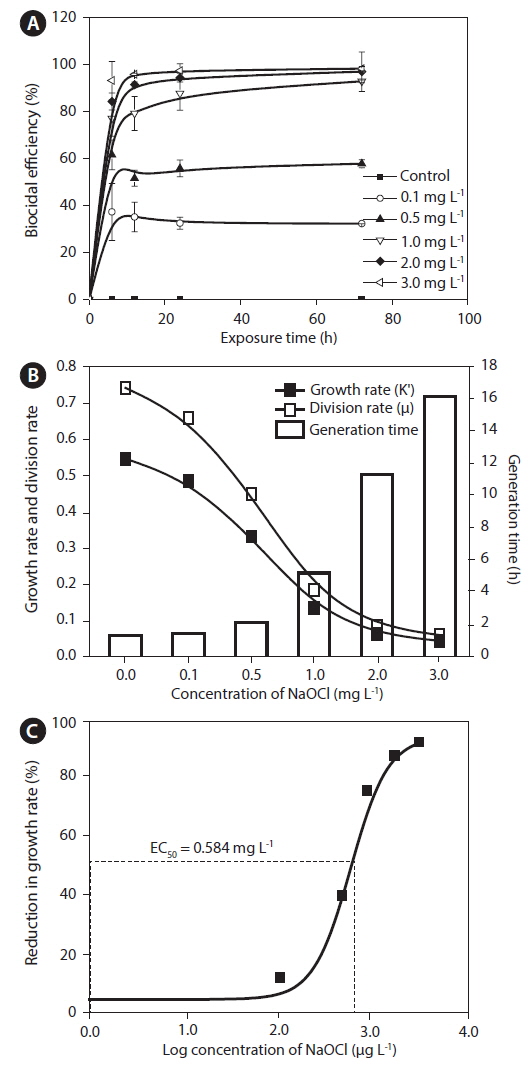
    The growth rate was calculated based on the following equation (Levasseur et al. 1993): Growth rate (K′) = Ln (N2 / N1) / (t2 − t1), where N1 and N2 are biomass at time 1 (t1) and time 2 (t2), respectively. In addition, division rate (μ) and generation time were calculated as follows: Divisions per day = K′ / Ln2, and generation time = 1 / (division day−1), respectively.

    Biocidal efficiency was calculated based on percent inhibition, following the recommendation by Organization for Economic Cooperation and Development (2011). The percent inhibition was calculated based on the following equation: % I = (μC − μT / μC) × 100, where % I = percent inhibition, μC = mean value of growth in the control, and μT = mean value of growth rate in the treated samples.

    Levels of chlorophyll a (Chl a) and CAR were determined using a DU730 Life Science UV / Vis spectrophotometer (Beckman Coulter, Fullerton, CA, USA). Specifically, 10 mL of the treated culture was filtered using Whatman GF/C filter paper and a vacuum pump filtration unit. The pigments were extracted from the filter paper in dark using 90% acetone and their concentrations were estimated spectrophotometrically, following Parsons et al. (1984). In addition, chlorophyll autofluorescence (CAF) was measured using a fluorescent microscope (Axioscop; Carl Zeiss, Oberkochen, Germany) at 400× magnification. A UV dichoric (G365/395-488 nm) source was used for excitation, and the emission was measured by setting the detection bandwidth between 630 and 750 nm. The images were analyzed using the software ImageJ ver. 1.29 (NIH, Bethesda, MD, USA). Mean fluorescence intensity (MFI) was expressed in terms of pixel gray value, which ranged from 0 to 270. The reported MFI values indicate the average MFI values obtained from a minimum of 50 individual cells.

    EC50 at 72 h and the percentile inhibition were calculated as recommended in Organization for Economic Cooperation and Development testing guidelines (Organization for Economic Cooperation and Development 2011). The EC50 values were estimated using a sigmoidal dose-response curve and plotted using Origin ver. 8.5 (MicroCal Software Inc., Northampton, MA, USA).

      >  Biochemical (lipid peroxidation and SOD) assays and statistical analysis

    Lipid peroxidation was measured according to the method of Heath and Packer (1968). The cells were harvested by centrifugation at 4,217 ×g for 10 min, and then 2 mL of 10% trichloroacetic acid (TCA) was added to the pellet. The cells were homogenized using a Teflon pestle tissue homogenizer in ice. The tube was then placed in a water bath at 40℃ for 5 min, followed by a modification of the method described by Soto et al. (2011). The mixture was centrifuged at 4,217 ×g for 10 min. An equal volume of 0.25% thiobarbituric acid freshly prepared in 10% TCA solution was added to the supernatant. The tube was heated at 95℃ for 30 min in a water bath. The mixture was then cooled to room temperature and centrifuged for 10 min at 4,217 ×g. The absorbance of the solution was measured at 532 nm. Results were expressed as micromoles of malondialdehyde (MDA) per 104 cells.

    SOD was assayed according to the method of Beauchamp and Fridovich (1971). Algal cells were harvested by centrifugation at 4,217 ×g for 10 min, and then 5 mL of 100 mM dihydrogen phosphate buffer was added to the algal cell pellet. The cells were homogenized using a Teflon pestle tissue homogenizer in ice. Next, the tube was placed in a water bath at 40℃ for 5 min using a method modified from Soto et al. (2011). The mixture was centrifuged at 4,217 ×g for 10 min. To the supernatant, 2.6 mL of the reaction mixture (0.5 M phosphate buffer, 130 mM methionine, 750 μM Na2EDTA, and 20 μM riboflavin) were added. The tubes were incubated in light (65 μmol photons m−2s−1) for 30 min. The absorbance was read at 560 nm. One unit of SOD (U) was defined as the amount of enzyme resulting in 50% inhibition of photochemical reduction of nitroblue tetrazolium. SOD levels were represented as U per 104 cells (U 10−4 cells−1).

    All data presented here are mean values obtained from experiments performed in triplicates. One-way analysis of variance (ANOVA) with post hoc Dunnet’s test using Graphpad InStat (Graphpad Software Inc., San Diego, CA, USA) was used for comparisons between untreated and treated cultures. p < 0.05 was accepted as significant. In addition, correlation between cell counts, Chl a, and MFI was calculated using Pearson’s correlation coefficient (r2) by using MS Excel (Microsoft Corp., Redmond, WA, USA).

    RESULTS

      >  Effects of NaOCl on growth and division rates

    C. polykrikoides was exposed to 0.1, 0.5, 1.0, 2.0, and 3.0 mg L−1 of NaOCl. Cell counts, growth rate, and the cell division rate showed dose- and time-dependent decrease after 6 and 72 h exposure to NaOCl (Fig. 1). The residual oxidant levels measured were below the detection limit (<0.01 mg L−1) after 6 and 72 h of exposure (Table 1). The biocidal efficiency (Fig. 1A) of NaOCl was evaluated based on the variation in cell counts, which showed significant (p < 0.05) reduction at all the tested concentrations (0.1−3.0 mg L−1). The biocidal efficiency was determined to be 75, 89, and 92% at 1.0, 2.0, and 3.0 mg L−1 NaOCl, respectively, after 72 h of exposure. In addition, NaOCl exerted adverse effects on the growth and division rates of C. polykrikoides, ultimately affecting the generation time. Based on the growth rate, the EC50 value after exposure for 72 h was calculated to be 0.584 mg L−1 (Fig. 1C).

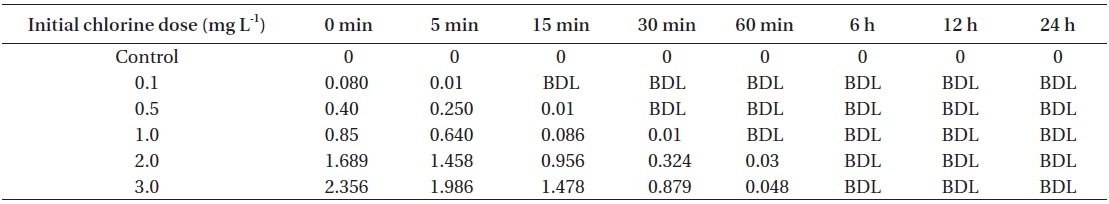
    [Table 1.] Total residual oxidant levels at different time intervals

    label

    Total residual oxidant levels at different time intervals

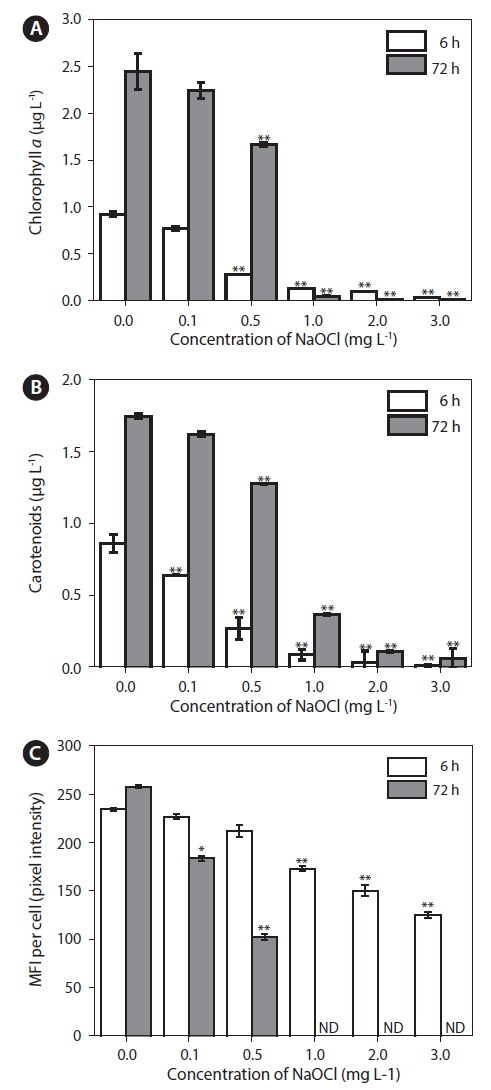
      >  Effects of NaOCl on Chl a, CAR, and CAF levels

    Chl a and CAR levels showed significant reduction (p < 0.05) after 6 h of NaOCl exposure, with percentage reduction of 39% at 1.0 mg L−1, 93% at 2.0 mg L−1, and 96% at 3.0 mg L−1 relative to the levels in the unexposed control (Fig. 2). Similarly, after 24 and 72 h of exposure to NaOCl, Chl a, and CAR levels reduced considerably by test doses. Moreover, there was a positive correlation (r2 = 0.956, p < 0.01) between cell counts and Chl a.

    Physiological activity of C. polykrikoides was assessed by determining CAF as the MFI per cell. There was a positive correlation between MFI and Chl a levels (r2 = 0.964, p < 0.01). After 6 and 12 h, MFI for C. polykrikoides cells exposed to 1.0, 2.0, and 3.0 mg L−1 of NaOCl decreased by approximately 25-46% (p < 0.05) relative to the values in the unexposed control (Fig. 2C, Appendix 1); however, these values did not decrease significantly at lower doses (0.1 and 0.5 mg L−1) of NaOCl after 12 h of exposure. When these cells were further incubated for 24 and 72 h the reduction in MFI ranged between 28 and 60% for cells exposed to 0.1 and 0.5 mg L−1 of NaOCl to that in the control. At this late time point of incubation, cultures exposed to 1.0, 2.0, and 3.0 mg L−1 NaOCl did not emit CAF.

      >  Effects of NaOCl on antioxidant enzyme activity

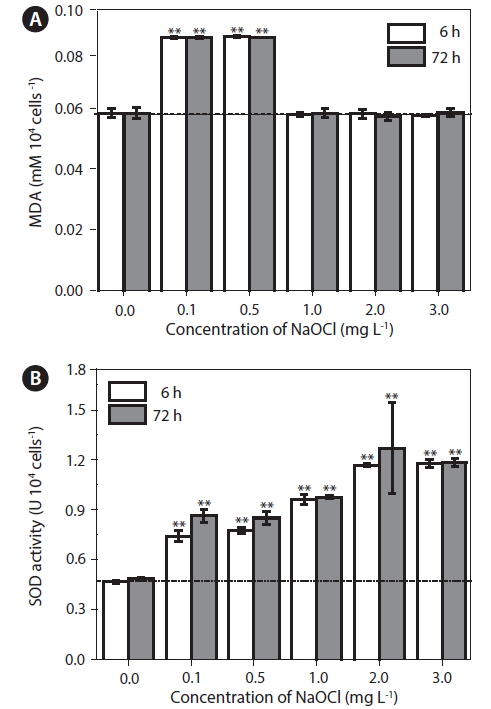
    There was a significant (p < 0.05) increase in lipid peroxidation at lower doses (0.1 and 0.5 mg L−1) of NaOCl after 6 h of exposure (Fig. 3A), and a similar trend was observed up to 72 h. The MDA levels increased from 0.058 to 0.083 mM per 104 cells. However, cultures exposed to 1.0, 2.0, and 3.0 mg L−1 of NaOCl did not showed significant variation (p > 0.05) in lipid peroxidation throughout the experiment.

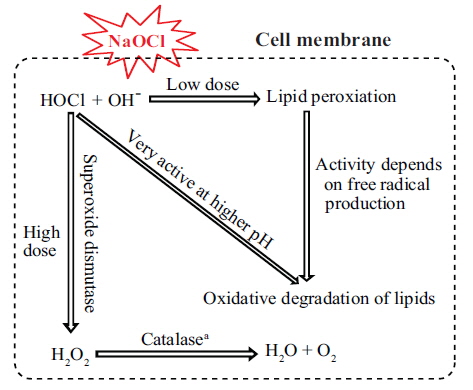
    In cultures exposed to 0.1 and 0.5 mg L−1 NaOCl, after 6 h, SOD activity increased (p < 0.05) to approximately 4-5 times that in the unexposed controls and the increase continued up to 72 h of exposure (Fig. 3B). In addition, for cultures exposed to 1.0, 2.0, and 3.0 mg L−1 of NaOCl the SOD activity increased to approximately 7-10 times that in the control. Fig. 4 shows a schematic view of the variation in lipid peroxidation and SOD activity after exposure to NaOCl, as observed in this study.

    DISCUSSION

    NaOCl, a disinfectant and a biocide, affects the physiological and biochemical processes of organisms such as bacteria and fungi by damaging their intracellular molecules (Vitro et al. 2005). Here, we evaluated the applicability and physiological effects of the biocide for the removal of the harmful dinoflagellate C. polykrikoides. Tested doses (0.1-3.0 mg L−1) of NaOCl were similar to those used for disinfection of drinking-water systems, swimming pools, and power-plant discharges (Ebenezer et al. 2012). Our results showed that NaOCl considerably decreased cell counts and pigment levels (Figs 1 & 2). At even lower doses, it caused detrimental effects or observable damages to the test dinoflagellate. These results agree with those of our previous studies on the dinoflagellate Prorocentrum minimum (Ebenezer and Ki 2013), showing that NaOCl doses of 2.0 and 3.0 mg L−1 yielded 95-100% reduction in cell counts and Chl a levels after exposure for 72 h. Similarly, Ma et al. (2011) reported that chlorine doses of 0.3-0.4 mg L−1 markedly reduced cell counts and pigment levels of the diatom Phaeodactylum tricornutum. Moreover, we observed that the cell counts, CAR, and Chl a levels of C. polykrikoides did not recover even after 72 h, despite the medium being devoid of any measurable residual oxidants after 6 h of exposure. Patil and Jagadeesan (2011) also reported that 0.5-1 mg L−1 of chlorine killed ~20% diatom cells within 15 min of exposure. Thus, previous findings and our results suggest that NaOCl is a very effective algicide for the control of HABs, causing immediate damage to the cells upon exposure.

    Measurement of CAF has been reported to be a rapid, sensitive method for assessing the physiological status of microalgae (Nancharaiah et al. 2007), because autofluorescence enables discrimination of damaged and undamaged cells (Sato et al. 2004). Microalgae exhibit auto-fluorescence because of the presence of photosynthetic pigments (Trampe et al. 2011). In the present study, CAF as MFI per cell (Appendix 1) noticeably decreased with increase in exposure time and NaOCl doses (Fig. 2C, Appendix 2). Previous studies by Nancharaiah et al. (2007) and Ebenezer et al. (2012) have shown that chlorine doses of 1.0-3.0 mg L−1 resulted in a marked reduction in the MFI of the diatom Cocconeis scutellum and the green algae Chlorella salina. In addition, Ma et al. (2011) have reported that 0.2 mg L−1 of chlorine completely suppressed the photosynthetic activity of the diatom Phaeodactylum tricornutum as revealed by the variation in the effective quantum yield (ΔF / Fm′). These results suggest that the tested doses of NaOCl have a detrimental effect on the photosynthetic machinery of the cells, as evidenced from the chlorophyll fluorescence.

    The biocidal effect of NaOCl involves the action of free radicals generated by a Fenton-type reaction and the formation of HOCl (Bajszár and Dekonenko 2010), which lead to oxidative stress (Leichert et al. 2008). The generation of free radicals results in the oxidative degradation of lipids, which is the main target of oxidative stress, as revealed by the increase in lipid peroxidation activity (Cabiscol et al. 2000). In the present study, we observed an increase in lipid peroxidation activity after exposure to low doses of NaOCl (Fig. 3A). This result might be attributed to the involvement of free radicals at the cellular level (Li et al. 2002). It was supported by previous works that trace amount of H2O2 (about 10−8 M) are always present in water as a result of natural radiolysis (Arnhold et al. 1991); HOCl reacts with H2O2 according to a Fentontype reaction forming hyroperoxides, and thus initiating lipid peroxidation (Panasenko et al. 2013). HOCl induced lipid peroxidation is completely blocked by scavengers of free radicals (e.g., taurine), when the lipid peroxidation reaches saturation (Spickett et al. 2000). Moreover, pH was also found to have an influence in HOCl induced lipid peroxidation (Panasenko et al. 1997). The decrease in lipid peroxidation activity at high NaOCl doses in the present study could be due to increased production of free radicals.

    In aerobic organisms, the termination of lipid degradation is enhanced by several molecules (e.g., SOD, catalase, and peroxidase) that remove free radicals from the system. For example, SOD is involved in the dismutation of superoxide into O2 and H2O2 (Shin et al. 2005). In the present study, we observed a significant increase in the level of SOD after exposure to higher concentrations of NaOCl (Fig. 3B). A previous study by Li et al. (2005) also reported increase in SOD activity when the marine alga Pavlova viridis was exposed to metals (copper and zinc). When acclimating to increased oxidative stress, SOD concentrations typically increase with the degree of stress (Peng et al. 2013). Fig. 4 shows a schematic view of the oxidative stress caused by NaOCl and the counteraction of antioxidative enzymes, as recorded in the present study. This is in general agreement with the findings of Park et al. (2009), who observed the production of lipid peroxidation and variation in antioxidative enzyme activities in P. minimum on exposure to light induced stress. The strong light-induced stress was reported to induce cellular ROS production in the dinoflagellate, which consequently led to the production of antioxidant enzymes to decrease ROS-induced damages. These findings suggest that the biocide NaOCl induces oxidative stress; moreover, the cells succumb to this stress and cannot recover, which further confirms the algicidal efficiency of NaOCl.

    In conclusion, our findings show that NaOCl reduces the growth rate and pigment levels of the test dinoflagellate C. polykrikoides. It induces ROS generation, which leads to an increase in lipid peroxidation. Moreover, low levels of NaOCl markedly may inhibit the photosynthetic machinery, as evidenced by the reduction in CAF and inhibited antioxidant enzyme activity. Hence, NaOCl can be considered an effective algicide for the control of HABs. Furthermore, the residual chlorine levels are below the detection limit at lower concentrations within 60 min of exposure. On the other hand, NaOCl and its byproducts can also be a threat to non-target organisms, and therefore the environmental impact of this biocide should also be considered before use in marine systems.

참고문헌
  • 1. Arnhold J., Mueller S., Arnold K., Grimm E. 1991 Chemiluminescence intensities and spectra of luminol oxidation by sodium hypochlorite in the presence of hydrogen peroxide [J. Biolumin. Chemilumin.] Vol.6 P.189-192 google cross ref
  • 2. Bajszar G., Dekonenko A. 2010 Stress-induced Hsp70 gene expression and inactivation of Cryptosporidium parvum oocysts by chlorine-based oxidants [Appl. Environ. Microbiol.] Vol.76 P.1732-1739 google cross ref
  • 3. Beauchamp C., Fridovich I. 1971 Superoxide dismutase: improved assays and an assay applicable to acrylamide gels [Anal. Biochem.] Vol.44 P.276-287 google cross ref
  • 4. Cabiscol E., Tamarit J., Ros J. 2000 Oxidative stress in bacteria and protein damage by reactive oxygen species [Int. Microbiol.] Vol.3 P.3-8 google
  • 5. Clesceri L.S., Greenberg A. E., Eaton A. D. 1998 Standard methods for the examination of water and wastewater P.1220 google
  • 6. Ebenezer V., Ki J.-S. 2012 Evaluation of the sub-lethal toxicity of Cu, Pb, bisphenol A and polychlorinated biphenyl to the marine dinoflagellate Cochlodinium polykrikoides [Algae] Vol.27 P.63-70 google cross ref
  • 7. Ebenezer V., Ki J.-S. 2013 Physiological and biochemical responses of the marine dinoflagellate Prorocentrum minimum exposed to the oxidizing biocide chlorine [Ecotoxicol. Environ. Saf.] Vol.92 P.129-134 google cross ref
  • 8. Ebenezer V., Nancharaiah Y. V., Venugopalan V. P. 2012 Chlorination-induced cellular damage and recovery in marine microalga, Chlorella salina [Chemosphere] Vol.89 P.1042-1047 google cross ref
  • 9. Estrela C., Estrela C. R. A., Barbin E. L., Span o J. C. E., Marchesan M. A., Pecora J. D. 2002 Mechanism of action of sodium hypochlorite [Braz. Dent. J.] Vol.13 P.113-117 google cross ref
  • 10. Hahn S., Melching-Kollmuß S., Bitsch A., Schneider K., Oltmanns J., Hassauer M., Schuhmacher-Wolz U., Voss J. -U., Gartiser S., Jager I., Mangelsdorf I. 2005 Health risks from biocide-containing products and articles of daily use P.20 google
  • 11. Halliwell B. 2006 Reactive species and antioxidants: redox biology is a fundamental theme of aerobic life [Plant Physiol] Vol.141 P.312-322 google cross ref
  • 12. Heath R. L., Packer L. 1968 Photoperoxidation in isolated chloroplasts. I. Kinetics and stoichiometry of fatty acid peroxidation [Arch. Biochem. Biophys.] Vol.125 P.189-198 google cross ref
  • 13. Ken C. F., Hsiung T. M., Huang Z. X., Juang R. H., Lin C. T. 2005 Characterization of the Fe/Mn-superoxide dismutase from diatom Thallassiosira weissflogii: cloning, expression, and property [J. Agric. Food Chem.] Vol.9 P.1470-1474 google
  • 14. Kudela R. M., Gobler C. J. 2012 Harmful dinoflagellate blooms caused by Cochlodinium sp.: global expansion and ecological strategies facilitating bloom formation [Harmful Algae] Vol.14 P.71-86 google cross ref
  • 15. Leichert L. I., Gehrke F., Gudiseva H. V., Blackwell T., Ilbert M., Walker A. K., Strahler J. R., Andrews P. C., Jakob U. 2008 Quantifying changes in the thiol redox proteome upon oxidative stress in vivo [Proc. Natl. Acad. Sci. U. S. A.] Vol.105 P.8197-8202 google cross ref
  • 16. Levasseur M., Thompson P. A., Harrison P. J. 1993 Physiological acclimation of marine phytoplankton to different nitrogen sources [J. Phycol.] Vol.29 P.587-595 google cross ref
  • 17. Li X., Ping X., Xiumei S., Zhenbin W., Liqiang X. 2005 Toxicity of cypermethrin on growth, pigments, and superoxide dismutase of Scenedesmus obliquus [Ecotoxicol. Environ. Saf.] Vol.60 P.188-192 google cross ref
  • 18. Li X. J., Gu J., Lu S. D., Sun F. Y. 2002 Melatonin attenuates MPTP-induced dopaminergic neuronal injury associated with scavenging hydroxyl radical [J. Pineal. Res.] Vol.32 P.47-52 google cross ref
  • 19. Ma Z., Gao K., Li W., Xu Z., Lin H., Zheng Y. 2011 Impacts of chlorination and heat shocks on growth, pigments and photosynthesis of Phaeodactylum tricornutum (Bacillariophyceae) [J. Exp. Mar. Biol. Ecol.] Vol.397 P.214-219 google cross ref
  • 20. Mishra S., Jha A. B., Dubey R. S. 2011 Arsenite treatment induces oxidative stress, upregulates antioxidant system, and causes phytochelatin synthesis in rice seedlings [Protoplasma] Vol.248 P.565-577 google cross ref
  • 21. Nancharaiah Y. V., Rajadurai M., Venugopalan V. P. 2007 Single cell level microalgal ecotoxicity assessment by confocal laser scanning microscopy and digital image analysis [Environ. Sci. Technol.] Vol.41 P.2617-2621 google cross ref
  • 22. 2011 OECD guidelines for the testing of chemicals. Proposal for updating guideline 201. Freshwater alga and cyanobacteria, growth inhibition test P.21 google
  • 23. Panasenko O. M., Gorudko I. V., Sokolov A. V. 2013 Hypochlorous acid as a precursor of free radicals in living systems [Biochemistry Mosc] Vol.78 P.1466-1489 google cross ref
  • 24. Panasenko O. M., Panasenko O. O., Briviba K., Sies H. 1997 Hypochlorite destroys carotenoids in low density lipoproteins thus decreasing their resistance to peroxidative modification [Biochemistry Mosc] Vol.62 P.1140-1145 google
  • 25. Park S. Y., Choi E. S., Hwang J., Kim D., Ryu T. K., Lee T.-K. 2009 Physiological and biochemical responses of Prorocentrum minimum to high light stress [Ocean Sci. J.] Vol.44 P.199-204 google cross ref
  • 26. Parsons T. R., Maita Y., Lalli C. M. 1984 A manual of chemical and biological methods for seawater analysis P.184 google
  • 27. Patil J. S., Jagadeesan V. 2011 Effect of chlorination on the development of marine biofilms dominated by diatoms [Biofouling] Vol.27 P.241-254 google cross ref
  • 28. Peker I., Akca G., Sarikir C., Alkurt M. T., Celik I. 2014 Effectiveness of alternative methods for toothbrush disinfection: an in vitro study [Sci. World J.] Vol.2014 P.726190 google
  • 29. Peng C.-C., Chyau C.-C., Wang H.-E., Chang C.-H., Chen K.-C., Chou K.-Y., Peng R. Y. 2013 Cytotoxicity of ferulic acid on T24 cell line differentiated by different microenvironments [Biomed. Res. Int.] Vol.2013 P.579859 google
  • 30. Rosen H., Michel B. R., van Devanter D. R., Hughes J. P. 1998 Differential effects of myeloperoxidase-derived oxidants on Escherichia coli DNA replication [Infect. Immun.] Vol.66 P.2655-2659 google
  • 31. Sato M., Murata Y., Mizusawa M., Iwahashi H., Oka S.-I. 2004 A simple and rapid dual-fluorescence viability assay for microalgae [Microbiol. Cult. Coll.] Vol.20 P.53-59 google
  • 32. Sharma P., Jha A. B., Dubey R. S., Pessarakli M. 2012 Reactive oxygen species, oxidative damage, and antioxidative defense mechanism in plants under stressful conditions [J. Bot.] Vol.2012 P.217037 google
  • 33. Shin S.-Y., Lee H.-S., Kwon S.-Y., Kwon S.-T., Kwak S. S. 2005 Molecular characterization of cDNA encoding copper/zinc superoxide dismutase from cultured cells of Manihot esculenta [Plant Physiol. Biochem.] Vol.43 P.55-60 google cross ref
  • 34. Soto P., Gaete H., Hidalgo M. E. 2011 Assessment of catalase activity, lipid peroxidation, chlorophyll-a and growth rate in the freshwater green algae Pseudokirchneriella subcapitata exposed to copper and zinc [Lat. Am. J. Aquat. Res.] Vol.39 P.280-285 google cross ref
  • 35. Spickett C. M., Jerlich A., Panasenko O. M., Arnhold J., Pitt A. R., Stelmaszynska T., Schaur R. J. 2000 The reactions of hypochlorous acid, the reactive oxygen species produced by myeloperoxidase, with lipids [Acta Biochim. Pol.] Vol.47 P.889-899 google
  • 36. Trampe E., Kolbowski J., Schreiber U., Kuhl M. 2011 Rapid assessment of different oxygenic phototrophs and single-cell photosynthesis with multicolour variable chlorophyll fluorescence imaging [Mar. Biol.] Vol.158 P.1667-1675 google cross ref
  • 37. Tripathi B. N., Metha S. K., Amar A., Gaur J. P. 2006 Oxidative stress in Scenedesmus sp. during short-and long-term exposure to Cu2+ and Zn2+ [Chemosphere] Vol.62 P.538-544 google cross ref
  • 38. Vitro R., Manas P., Alvarez I., Condon S., Raso J. 2005 Membrane damage and microbial inactivation by chlorine in the absence and presence of chlorine-demanding substrate [Appl. Environ. Microbiol.] Vol.71 P.5022-5028 google cross ref
  • 39. Wang Z.-H., Nie X.-P., Yue W.-J., Li X. 2012 Physiological responses of three marine microalgae exposed to cypermethrin [Environ. Toxicol.] Vol.27 P.563-572 google cross ref
  • 40. White G. C. 2010 White’s handbook of chlorination and alternative disinfectants P.1062 google
  • 41. Winter J., Ilbert M., Graf P. C. F., Ozcelik D., Jakob U. 2008 Bleach activates a redox-regulated chaperone by oxidative protein unfolding [Cell] Vol.135 P.691-701 google cross ref
OAK XML 통계
이미지 / 테이블
  • [ Fig. 1. ]  Effect of NaOCl on the growth rate of Cochlodinium polykrikoides cells. (A) Biocidal efficiency of NaOCl based on decrease in cell counts. (B) Variation in growth rate, division rate and generation time of C. polykrikoides after exposure to NaOCl. (C) Dose response curve after 72 h exposure to NaOCl.
    Effect of NaOCl on the growth rate of Cochlodinium polykrikoides cells. (A) Biocidal efficiency of NaOCl based on decrease in cell counts. (B) Variation in growth rate, division rate and generation time of C. polykrikoides after exposure to NaOCl. (C) Dose response curve after 72 h exposure to NaOCl.
  • [ Table 1. ]  Total residual oxidant levels at different time intervals
    Total residual oxidant levels at different time intervals
  • [ Fig. 2. ]  Effect of NaOCl on the pigment concentrations and the mean fluorescence intensity (MFI) of Cochlodinium polykrikoides cells. (A) Variation in chlorophyll a levels. (B) Variation in carotenoid levels. (C) The MFI after 6 and 72 h exposure to NaOCl. Significant difference as determined by Dunnet’s multiple comparisons test are represented as *p < 0.05 and **p < 0.001 level when compared to control. ND, detection limit.
    Effect of NaOCl on the pigment concentrations and the mean fluorescence intensity (MFI) of Cochlodinium polykrikoides cells. (A) Variation in chlorophyll a levels. (B) Variation in carotenoid levels. (C) The MFI after 6 and 72 h exposure to NaOCl. Significant difference as determined by Dunnet’s multiple comparisons test are represented as *p < 0.05 and **p < 0.001 level when compared to control. ND, detection limit.
  • [ Fig. 3. ]  Effect of NaOCl on enzymatic activity of Cochlodinium polykrikoides cells. (A) Variation in lipid peroxidation activity after 6 and 72 h exposure to NaOCl. (B) Variation in super oxide dismutase (SOD) activity after 6 and 72 h exposure to NaOCl. Significant difference as determined by Dunnet ’s multiple comparisons test are represented as **p < 0.001 level when compared to control. Dot lines represent mean values of controls at 6 and 72 h. MDA, malondialdehyde.
    Effect of NaOCl on enzymatic activity of Cochlodinium polykrikoides cells. (A) Variation in lipid peroxidation activity after 6 and 72 h exposure to NaOCl. (B) Variation in super oxide dismutase (SOD) activity after 6 and 72 h exposure to NaOCl. Significant difference as determined by Dunnet ’s multiple comparisons test are represented as **p < 0.001 level when compared to control. Dot lines represent mean values of controls at 6 and 72 h. MDA, malondialdehyde.
  • [ Fig. 4. ]  A schematic summary of variation in lipid peroxidation and super oxide dismutase activity in the dinoflagellate Cochlodinium polykrikoides exposed to NaOCl. aIt is the general pathway reported elsewhere.
    A schematic summary of variation in lipid peroxidation and super oxide dismutase activity in the dinoflagellate Cochlodinium polykrikoides exposed to NaOCl. aIt is the general pathway reported elsewhere.
(우)06579 서울시 서초구 반포대로 201(반포동)
Tel. 02-537-6389 | Fax. 02-590-0571 | 문의 : oak2014@korea.kr
Copyright(c) National Library of Korea. All rights reserved.