In this study, we investigated genetic diversity of 22 microsporidian isolates infecting tropical tasar silkworm, Antheraea mylitta collected from various geographical forest locations in the state of Jharkhand, India, using polymerase chain reaction (PCR)-based marker assay: random amplified polymorphic DNA (RAPD). A type species, NIK-1s_mys was used as control for comparison. The shape of mature microsporidians was found to be oval to elongate, measuring 3.80 to 5.10 μm in length and 2.56 to 3.30μm in width. Of the 20 RAPD primers screened, 16 primers generated reproducible profiles with 298 polymorphic fragments displaying high degree of polymorphism (97%). A total of 14 RAPD primers produced 45 unique putative genetic markers, which were used to differentiate the microsporidians. Calculation of genetic distance coefficients based on dice coefficient method and clustering with un-weighted pair group method using arithmetic average (UPGMA) analysis was conducted to unravel the genetic diversity of microsporidians infecting tasar silkworm. The similarity coefficients varied from 0.059 to 0.980. UPGMA analysis generated a dendrogram with four microsporidian groups, which appear to be different from each other as well as from NIK-1s_mys. Two-dimensional distribution based on Euclidean distance matrix also revealed considerable variability among different microsporidians identified from the tasar silkworms. Clustering of few microsporidian isolates was in accordance with the geographic origin. The results indicate that the RAPD profiles and specific/unique genetic markers can be used for differentiating as well as to identify different microsporidians with considerable accuracy.
Tasar silk is indigenous to India and tasar culture is a traditional tribal activity in the forests and its adjoining areas, where abundant natural wealth of host plants (
Microsporidia are a diverse group of spore-forming obligate intracellular parasites including more than 1300 formally described species in 160 genera (Wittner and Weiss 1999, Keeling 2009). Microsporidia are unique eukaryotes, which do not possess centrioles, and mitochondrial apparatus, although nuclei are present in distinct number (Vossbrinck and Woese 1986, Vossbrinck
Large numbers of new microsporidian species are designated based on morphology, ultrastructure, life cycle and host–parasite relationships. Molecular phylogenetic analysis based on DNA marker profiles have largely overcome the problems associated with ultrastructural and phenotype-based classification systems (Baker
>
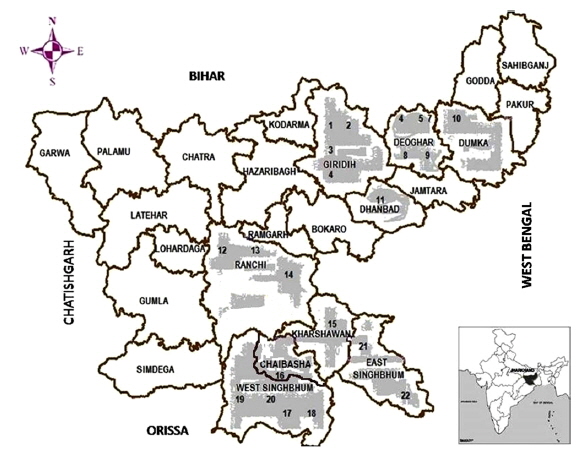
Origin of microsporidian isolates.
Twenty two microsporidians were collected from individual infected tasar silkmoths of
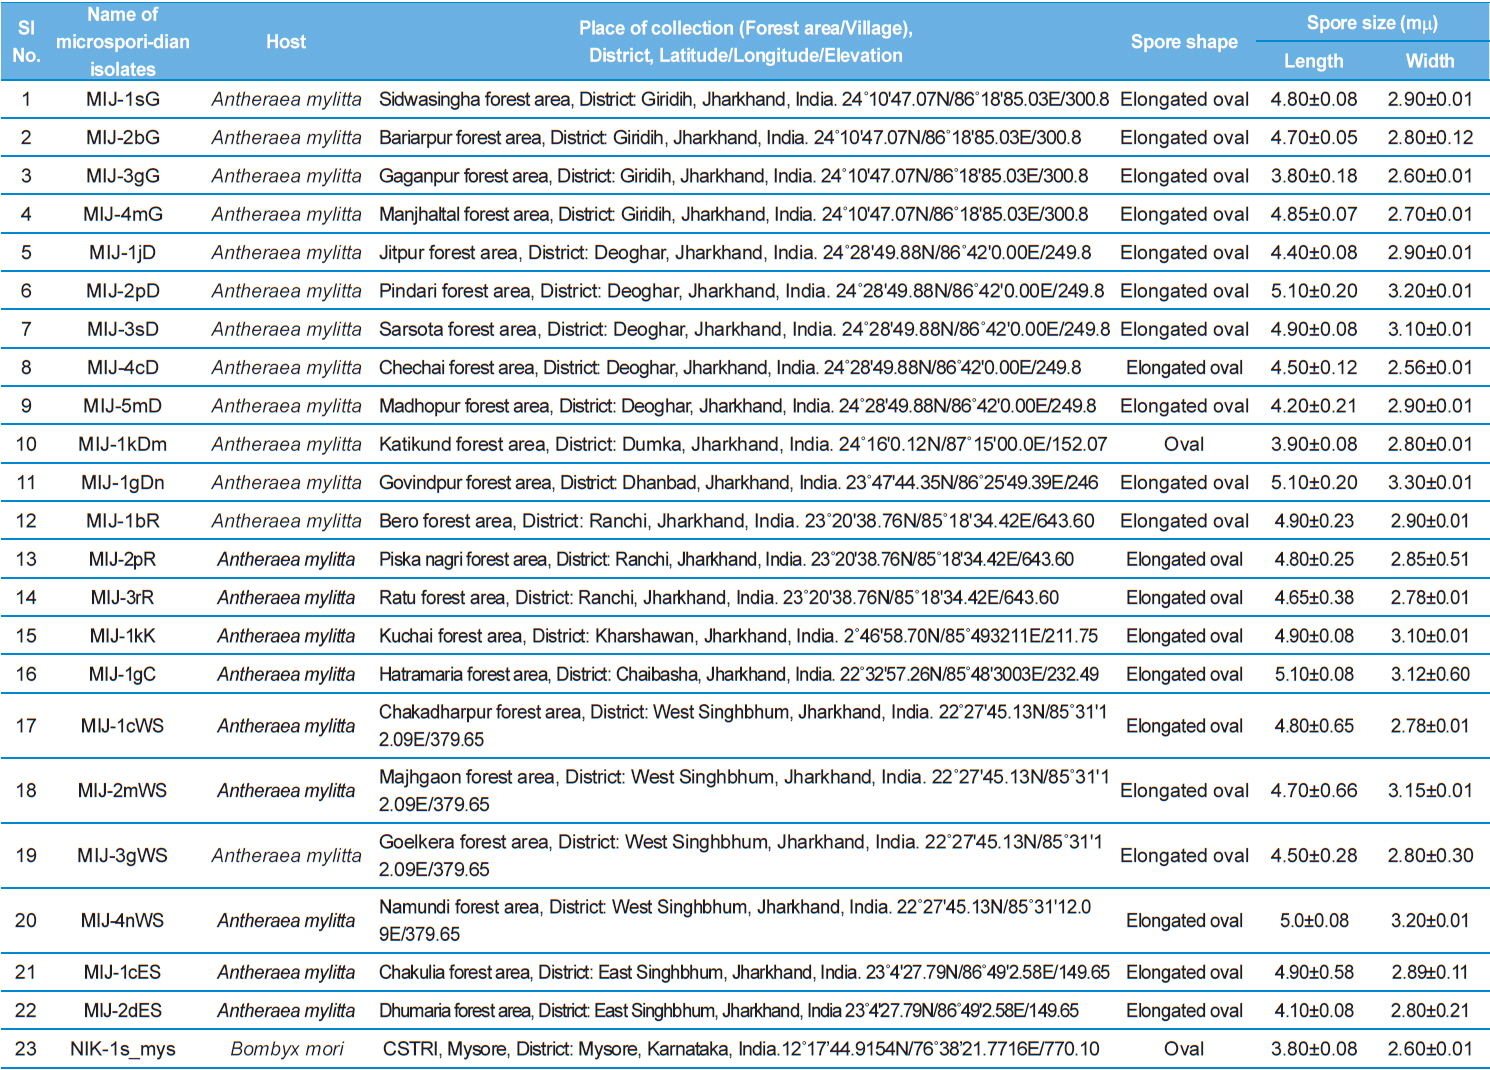
Details of the twenty three microsporidian isolates and type species: their place of collection, host and morphology
>
Measurement of spore length and width.
The morphology of purified spores was observed under phase contrast microscope. The length and width of spores were measured according to the method of Undeen and Vavra (1997). Fresh spores were spread in water agar on glass micro-slides and measured using an ocular micrometer under phase contrast microscope and all the measurements are presented in micrometers as mean values of 12 individual observations (Table 1).
>
DNA extraction and purification.
Genomic DNA was extracted from the sporoplasm discharged from spores using glass bead method described by Undeen and Cockburn (1989). DNA concentration and quality was determined both by spectrophotometry at 260 and 280 nm and on 0.8% agarose gel, using a known quantity of λDNA (10 ng/μL) as a standard before use in subsequent PCRs. Possibility of host DNA contamination was ascertained using insect mitochondrial primer amplification in PCR. A working solution of DNA (10 ng/μL) was prepared in sterile autoclaved double distilled water.
>
PCR amplification of the DNA with RAPD primers.
PCR reactions were performed according to the protocols of Welsh and McClelland (1990) and Williams
Interpretation of patterns was based on the presence or absence of unequivocally reproducible amplified bands and their size. RAPD markers were scored according to the presence (1) or absence (0) of a band across twenty three isolates of microsporidian; each primer was scored separately. The scoring was repeated three times and reproducible conspicuous bands were only included in the analysis. The total number of fragments amplified, number of poloymorphic fragments scored, and percentage of polymorphic bands were recorded. NTSYS-pc version 2.11T computer program (Applied Biostatistics, Setauket, NY) was used for genetic distance analysis. The data were analyzed using SIMQUAL (similarity for qualitative data) method to generate similarity/genetic distance among different microsporidian isolates using Dice coefficients (Dice 1945) (
The different microsporidian isolates identified from diseased tropical tasar silkworm,
>
Genetic variability revealed by the RAPD markers.
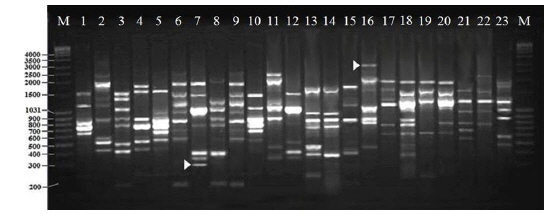
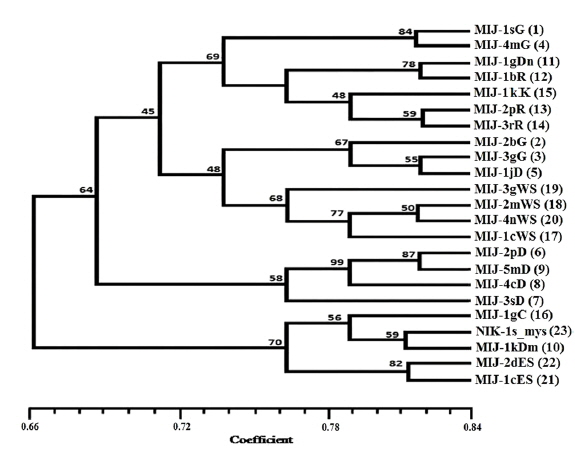
Twenty RAPD primers were screened for fingerprinting of the 22 microsporidian isolates along with type species out of which sixteen primers that yielded good amplification were utilized. The amplified products obtained with primer OPW-17 are depicted at Fig. 2. The size of amplified products with different primers ranged from 200 to 3500 bp (Table 2). A total of 308 RAPD fragments were generated with 16 primers of which 97% were polymorphic (Table 2). The primer OPW-8 generated the least number (10) of fragments while OPW-17 generated the highest number (26) (Table 2). Values of genetic distance obtained from each pair wise comparison of RAPD fragments are shown at Table 3. The relationship between 22 isolates and type species as revealed by genetic distance from dice similarity matrix RAPD data varied from 0.059 to 0.980 (Table 3). The genetic distance similarity matrix was least (0.059) between MIJ-1gC and MIJ-3sD while it was highest (0.980) between MIJ-5mD and MIJ-2pD (Table 3). UPGMA based dendrogram utilizing the genetic distance values of RAPD data is presented in Fig. 3. The dendrogram indicated clustering of the different microsporidians into four groups (Fig. 3). The first and second groups contained seven isolates each [Group 1: MIJ-1sG, MIJ-4 mG, MIJ-1gDn, MIJ-1bR, MIJ-1kK, MIJ-2pR and MIJ-3rR from Giridih, Dhanbad, Ranchi and Kharshwan, respectively; Group 2: MIJ-2bG, MIJ-3gG, MIJ-1jD, MIJ-3gWS, MIJ-2 mWS, MIJ-4nWS and MIJ-1cWS collected from Giridih, Deoghar and West Singhbhum, respectively]. The third group clustered four isolates [MIJ-2pD, MIJ-5mD, MIJ-4cD and MIJ-3sD] from a single location viz. Deoghar, while the last group had five isolates [MIJ-1gC, NIK-1s_mys, MIJ-1kDm, MIJ-2dES and MIJ-1cES collected from Chibasha, Mysore, Dumka and East Singhbhum, respectively]. According to geographical location, ten microsporidian isolates from West Singhbhum, East singhbhum and Deoghar clustered together, while rest of the microsporidian isolates clustered randomly along with other microsporidian isolates from different geographical regions (Fig. 3).

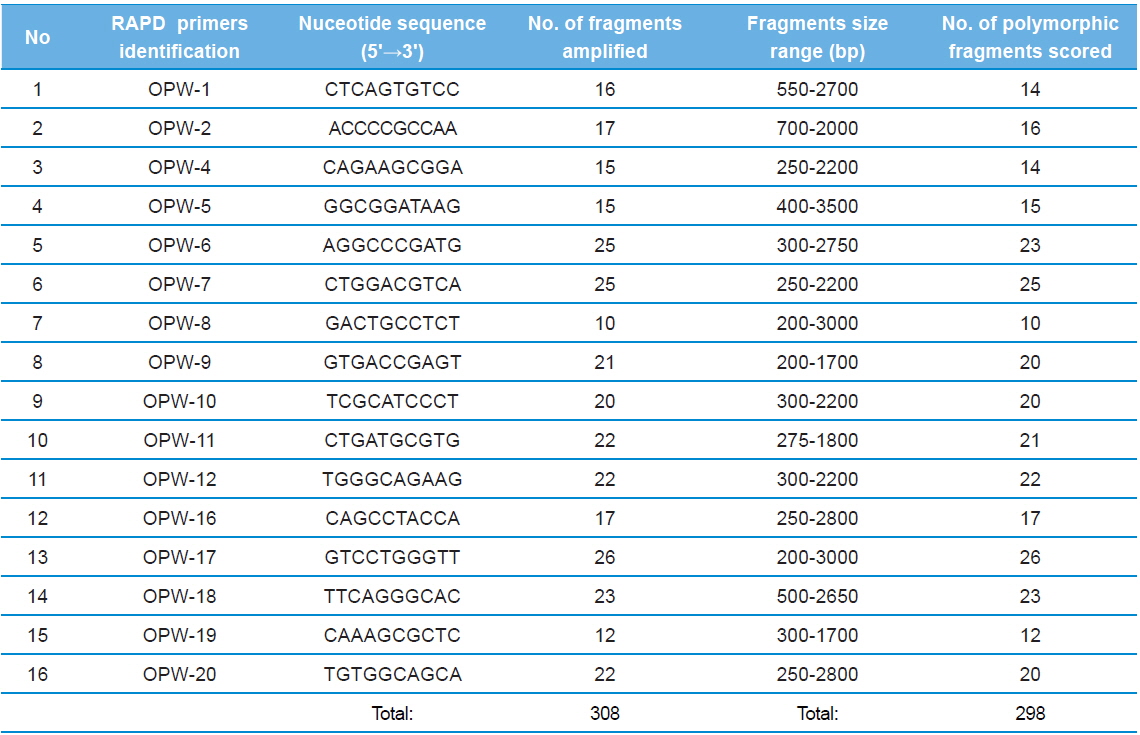
The nucleotide sequences of the primers, number of amplified fragments, fragment size, and number of polymorphic fragments scored using RAPD profiles of twenty three microsporidians DNA in RAPD - PCR
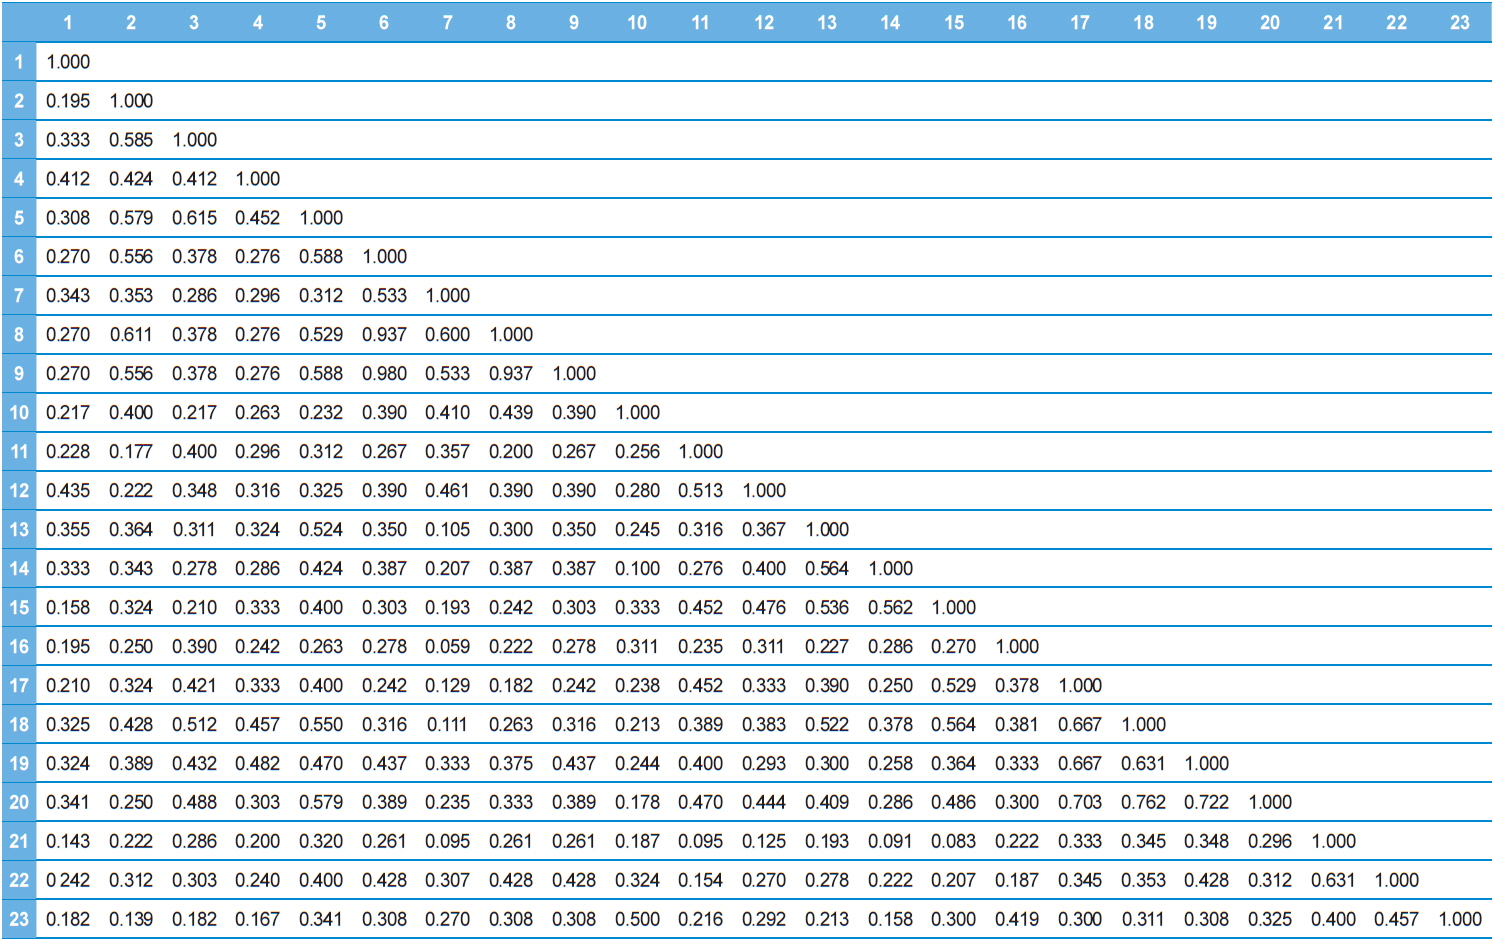
Dice genetic similarity distance matrix values based on RAPD data between twenty-three microsporidian isolates.
>
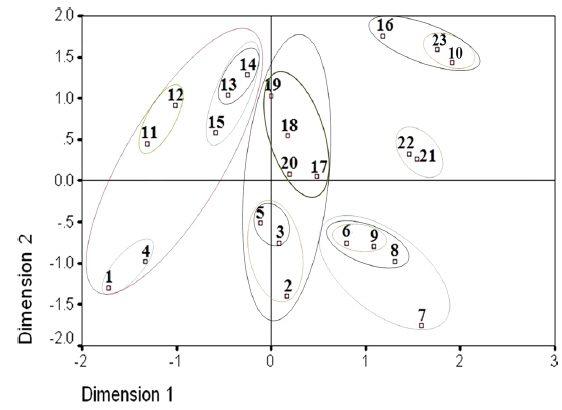
Two dimensional distribution of microsporidians as revealed by ALSCAL method.
The two-dimensional scaling of the RAPD data, using ALSCAL algorithm based on Euclidean distance matrix, has clearly delineated each of the identified microsporidian from the tasar silkworms as well as from the type species, NIK-1s_mys. (Fig. 4). Of the 22 microsporidian isolates, MIJ-1kDm is found to be closer to NIK-1s_mys, indicating that MIJ-1kDm is similar to the type species and remaining 21 isolates which differed from each other and from type species, were considered to be different variants. The grouping of different microsporidians based on Euclidean distance matrix is very similar as like in the UPGMA based dendrogram (Fig. 4).
>
Identification of unique genetic markers.
RAPD analysis also revealed isolate specific amplified products and 14 RAPD primers revealed 45 highly reproducible unique genetic markers. Four bands were specific to the type species, NIK-1s_mys and the remaining 41 bands are obtained to other microsporidian isolates collected from different forest locations (Table 4).
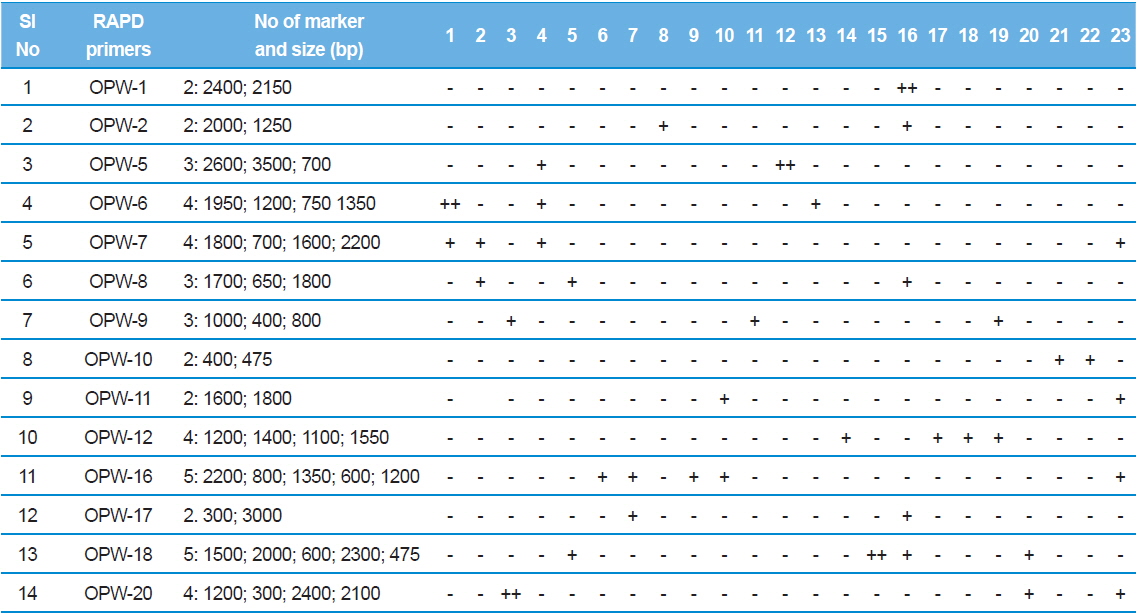
RAPD-PCR unique genetic markers that distinguish the 23 microsporidians. For the details of 1-23 microsporidians, see Table 1. Sign (?) absent, (+) present, (++) two bands present.
Characterization of different microsporidian isolates from diseased tropical tasar silkworm,
The RAPD-PCR banding patterns generated using genomic DNA from 23 microsporidian isolates including type species NIK-1s_mys revealed clear polymorphic banding pattern from each of the random primers that delineated 22 microsporidians with good bootstrap confidence values from the type species (NIK-1s_mys). Analysis of the RAPD-PCR banding profile indicated that only MIJ-1kDm isolate is similar to NIK-1s_mys while the remaining 21 microsporidian isolates can be considered as variants. The results suggest that, these specific/unique genetic markers obtained on RAPD-PCR profile could be used as diagnostic tool to differentiate various microsporidian spores. RAPD has been utilized for genetic characterization of different microsporidians infecting humans and silkworms [Mathis
One of the multivariate approaches of grouping based on the Euclidean distance matrix is the Multidimensional scaling method (Young
The present study depicts the simplest approach for identification and discrimination of microsporidian isolates from tropical tasar silkworm,