Odyssey, one of the NASA’s Mars exploration program and SELENE (Kaguya), a Japanese lunar orbiting spacecraft have a payload of Gamma-Ray Spectrometer (GRS) for analyzing radioactive chemical elements of the atmosphere and the surface. In these days, gamma-ray spectroscopy with a High-Purity Germanium (HPGe) detector has been widely used for the activity measurements of natural radionuclides contained in the soil of the Earth. The energy spectra obtained by the HPGe detectors have been generally analyzed by means of the Window Analysis (WA) method. In this method, activity concentrations are determined by using the net counts of energy window around individual peaks. Meanwhile, an alternative method, the so-called Full Spectrum Analysis (FSA) method uses count numbers not only from full-absorption peaks but from the contributions of Compton scattering due to gamma-rays. Consequently, while it takes a substantial time to obtain a statistically significant result in the WA method, the FSA method requires a much shorter time to reach the same level of the statistical significance. This study shows the validation results of FSA method. We have compared the concentration of radioactivity of 40K, 232Th and 238U in the soil measured by the WA method and the FSA method, respectively. The gamma-ray spectrum of reference materials (RGU and RGTh, KCl) and soil samples were measured by the 120% HPGe detector with cosmic muon veto detector. According to the comparison result of activity concentrations between the FSA and the WA, we could conclude that FSA method is validated against the WA method. This study implies that the FSA method can be used in a harsh measurement environment, such as the gamma-ray measurement in the Moon, in which the level of statistical significance is usually required in a much shorter data acquisition time than the WA method.
The geological matrix in the Earth and the Moon contain the primary natural radionuclides. These are the single nuclide as 40K and the decay series of 232Th and 238U. The decay series of 232Th and 238U emit three different types of radiation: alpha particles, beta particles and gamma-rays. As gamma-rays have more extreme radiation penetration than alpha and beta particles, gammas are used in the radiation measurement. The activity concentrations of 232Th and 238U are same as those of their progenies due to radioactive equilibrium (secular equilibrium).
Typically, gamma-ray spectroscopic system utilizes Window Analysis (WA) method in order to measure soil based radioactivity. Hendriks, PHGM et al. (2001) utilized Full Spectrum Analysis (FSA) method in the development of high-efficiency BGO scintillation detector system for a comparison with conventional WA system which uses NaI detector. Also, Maphoto KP (2004) compared two analysis methods using an HPGe detector, and utilized FORTRAN program for FSA. The two methods showed a difference of 1% ~ 61 % depending on the samples.
In this study, a FORTRAN program was developed for the technology development of FSA to replace the WA method and a low-level background gamma-ray spectrometer developed by Korea Research Institute of Standards and Science (KRISS) was used. This gamma-ray spectrometer is equipped with a passive shield to reduce background signals and an active shield to eliminate cosmic rays. It is operated by anti-coincidence mode with HPGe detectors. The purpose of this study is to ensure the validity of FSA method by evaluating uncertainties between the measurement and analysis results of the WA and the FSA.
WA method requires long measurement time and only takes into account of the interested peaks in measured spectra, thus, the accuracy is low. Moreover, it has a disadvantage of slow analyzing speed. In this study, a validation is performed for the Full Spectrum Analysis (FSA) method which complements the WA method to account for all the energy peaks from full spectrum in addition to the contributions of the Compton scattering, thus enabling measurement of statistical significance in a short period of time.
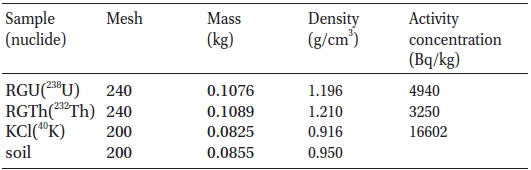
The reference materials, IAEA-RGU-1 and IAEA-RGTh-1, were prepared by the Canada Centre for Mineral and Energy Technology on behalf of the International Atomic Energy Agency (IAEA), while the 40K reference material (KCl of 99.5% purity) was produced in Japan (Wieser 2006). The reference materials were sampled in a 90 ml can and were kept for radioactive equilibrium between radium and radon daughter nuclides. For the background data acquisition, a 90 ml can was filled with pure water. Table 1 lists the information of the reference sources from the samples, such as mass and activity concentration. The detailed sample preparation process is summarized as follows. First, a spoon and a homogenizer were used for homogenization of reference materials. Secondly, an analytical balance was used for the accurate measurement of mass. Finally, the can was sealed using a can-sealer and wrapped with plastic wrap in order to prevent contamination of the samples and to reduce the emission of Radon. RGU and RGTh samples were stabilized for 3~4 weeks to reach secular equilibrium. All the reference material samples were prepared through the same process described above, however, KCl samples were preconditioned specially to reduce the geometrical structural change due to solidification resulting from deliquescence.
[Table 1.] The data of used materials.

The data of used materials.
Gamma-ray spectroscopic system detects gammas emitted from sample materials using a High Purity Germanium (HPGe) detector (Khandaker 2011). As radioactive isotopes emit gammas of intrinsic energy, if we measure the energy of gammas, we can tell apart the kind of isotope and its activity. Gamma-ray spectroscopic system is used to identify the isotopes and activities by measuring gammas from a sample material. Most of HPGe detectors use high-density and high atomic numbered lead as a shield to reduce background noise due to radiation and radioactive dirt existing around the detectors. HPGe gamma-ray spectrometers are used widely for the measurement of environment radiations (Murray et al. 1987).
2.2.1 Experiment
The Low-level background gamma-ray spectrometer uses two kinds of shielding method to reduce background signals. One is a passive shielding to reduce background from natural radiation. The other is an active shielding to reduce background due to the cosmic-ray muon with high penetrating power. The passive shielding surround the HPGe detector in a form of cabinet and from the outermost, it consists of 120 mm of paraffin, 100 mm of standard lead, 2 mm of tin, 50 mm of low-activity lead, and 10 mm of copper. The active shielding is called a cosmic-ray muon veto detector and comprises three plastic scintillator detectors. Since secondary cosmic rays reach the surface in a downward direction from the Earth atmosphere, the active shielding is placed uppermost part of the passive shielding (Lee et al. 2008).
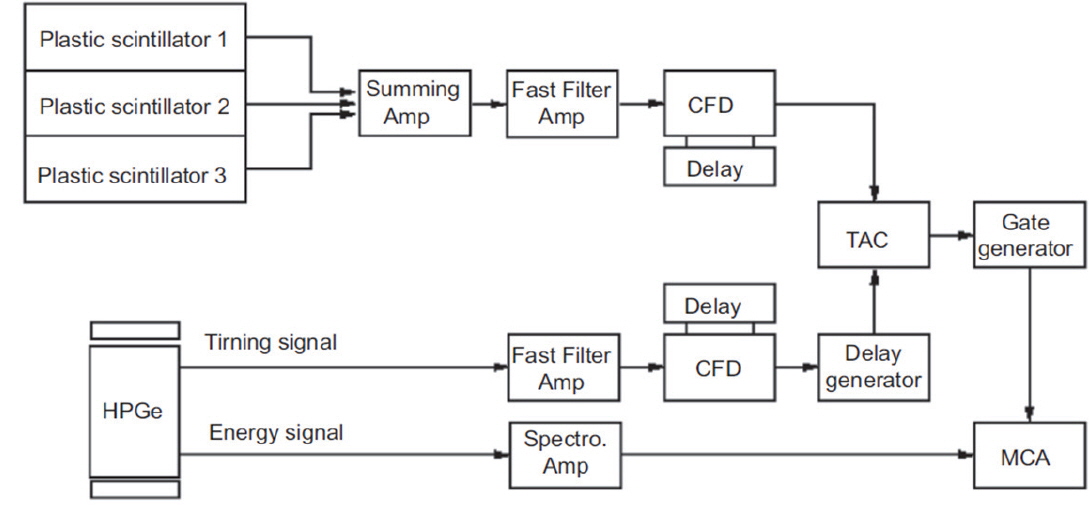
The low-level background gamma-ray spectrometer used in this experiment is operated by anti-coincidence mode with HPGe detectors. Fig. 1 shows a schematic diagram of the pulse processing electronics for the system and the detailed descriptions are given in the followings. The Anti-coincidence electronic circuit system is a method to remove signal coincidences, thus, it utilizes the time signals of an HPGe detector and a plastic scintillator. The output signals in the plastic scintillator are amplified through a photomultiplier tube and the 3 signals generated are added through a summing amplifier to produce a single signal. The single output signal is amplified using a fast filter amplifier to have a faster rise time and a narrower bandwidth than the original signal. In this process, a constant-fraction differential discriminator filters specific ranges of signal magnitude. Also, the HPGe detector utilizes a fast filter amplifier and a differential discriminator to amplify and filter signals.
A Time to Amplitude Converter measures interval between start and stop signals. While the start signals are received from the timing chain of plastic scintillator detector, the stop signals are received from the timing chain of HPGe detector through a delay generator. When the time interval between start and stop signal is less than 2 μs, it is set to generate coincident signals. This coincident signals are amplified to 50 μs through a gate generator. MCA converts the calibrated output signals into digital signals using an AD converter and identifies and collects signal counts according to the pulse height and finally stores them. While radiations emitted from the measurement samples are processed only through the HPGe detector to generate output pulses, high penetrating cosmic rays are processed sequentially through the plastic scintillator detector and the HPGe detector to generate output pulses respectively. During this process, the anticoincidence circuit removes the signals responding to both plastic and HPGe detectors and reduces background signals (Quittner 1972, Nuttall 1980).
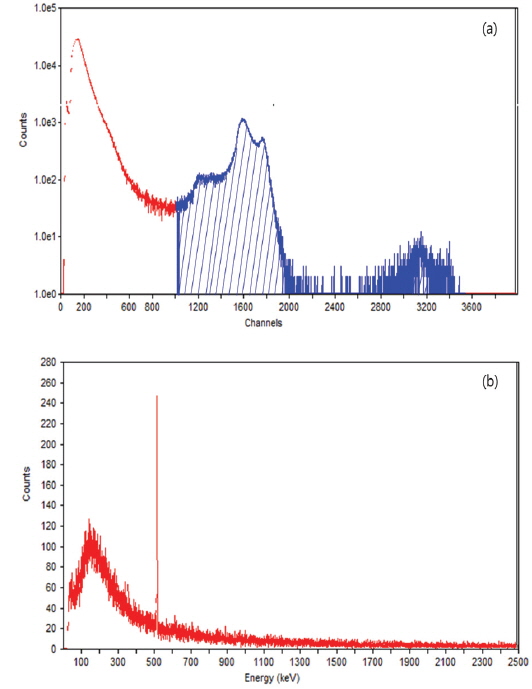
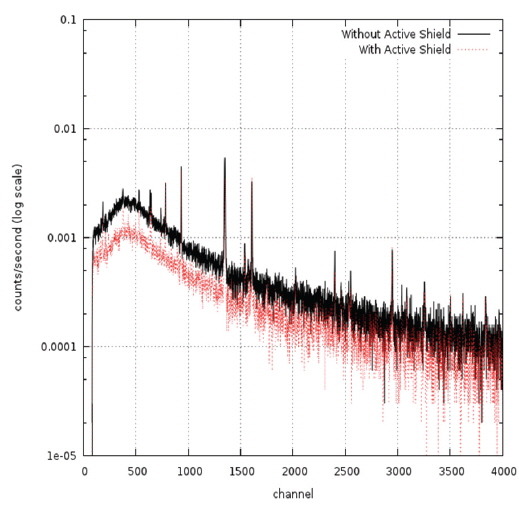
In Fig. 2 (a) shows the spectrum of cosmic rays measured through plastic scintillation detector, and (b) shows the energy spectrum of cosmic rays measured coincidently at the HPGe detector. In the energy range of 50-3000 keV, background counting rates were 1.37s-1 with active shielding, and 2.46 s-1 without active shielding. Thus, when active shielding is used, cosmic ray background is removed with the rate of 1.09 s-1. Fig. 3 shows the background spectra with and without active shielding.
2.2.2 Data Acquisition
Each of the samples was measured on the basis of live time in seconds. The data were acquired in the order of the background - the reference material samples (KCl, RGU and RGTh) – the soil sample – the background to comprise a complete set of data. The background and the soil samples were measured 100,000 seconds per one data set. The elapsed live time for the reference material samples (KCl, RGU and RGTh) are 1000 seconds, respectively. The background and the soil samples were measured three times in rapid succession, which made it possible to detect a flaw in the data.
Generally, gamma-ray spectroscopy utilizes popular Window Analysis (WA) method and Full Spectrum Analysis (FSA) Method. The two methods show significant difference in that while the WA method considers the interested peaks of measured spectrum, FSA method takes into account of all the peaks of whole spectrum and additional Compton scattering of gamma-rays (Maphoto 2004).
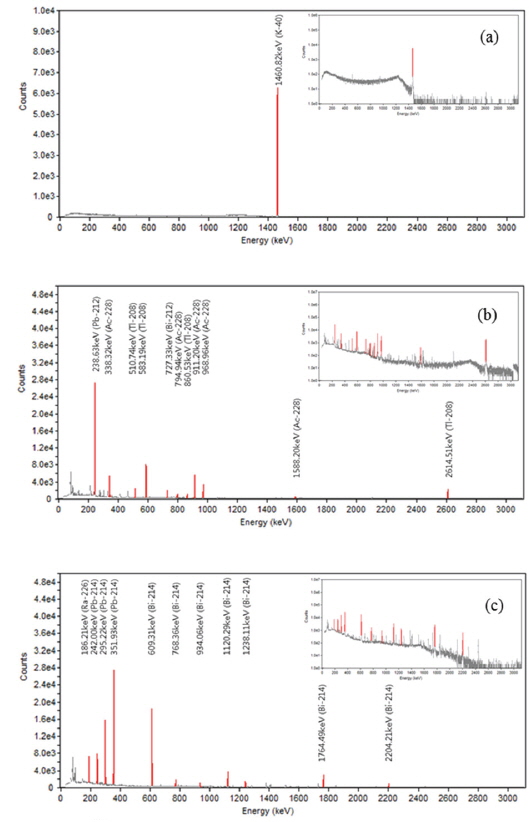
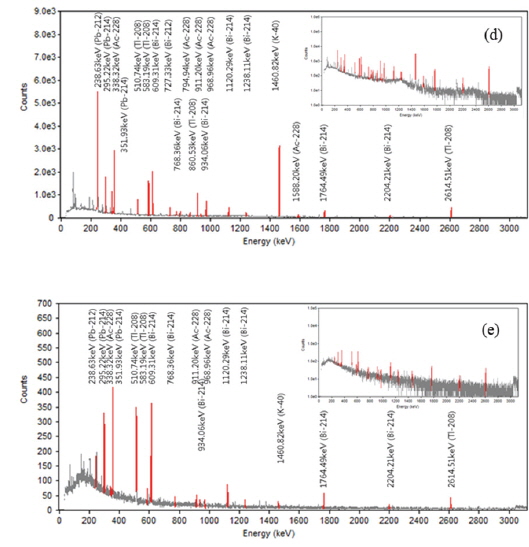
Fig. 4 shows dominant peaks of each reference material sample (KCl, RGU and RGTh). Dominant peaks of a soil sample and a pure water sample are seen in Fig. 5. There are two kinds of spectra: one is to express dominant peaks by Region Of Interest (ROI) better, and the other is to show Compton scattering events more clearly.
Typical gamma-ray spectroscopy method to measure the activity concentration of samples is WA method. In this method, the radioactivity is obtained using Equation (1).
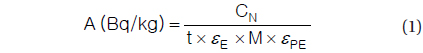
Where, CN indicates net count, εE is gamma-ray detection efficiency and εPE represents the branching ratio. t and M indicate measuring time and sample mass respectively. Nuclide information such as branching ratio is obtained from Atomic & nuclear data of LNHB (LNHB).
In WA method, first, the dominant peak by Region of Interest is designated in the spectrum of reference material sample and energy dependent nuclide efficiency corresponding to the peak is calculated. Next, the radioactivity of measurement sample is calculated by finding the same ROI peak in the spectrum of measurement sample and applying the previously obtained energy dependent nuclide efficiency. In this method, only ROI peak is considered, thus, it takes longer to measure to achieve statistical significance and also a relatively long time is required for the data analysis.
In this experiment, data processing is performed in the following sequence. To begin with, in the data spectrum of each measured sample, the ROI peaks are designated from the spectrum of reference material sample, KCl, RGU, and RGTh. Secondly, energy dependent nuclides corresponding to the ROI peak in the spectrum of reference material samples are found and the information of those nuclides to produce the sample efficiency and the radioactivity of measurement sample. Finally, as the measurement time of each sample is different, net counts converted into count per seconds (cps) in order to obtain the efficiency and radioactivity of measurement samples.
The most important aspect of the Full Spectrum Analysis (FSA) is to use full spectral shape. The FSA method considers the Compton scattering and the so-called ‘standard spectra’ for the calculation of the activity concentrations of 238U, 232Th, and 40K in a geological sample (Hendriks et al., 2001). In order to obtain the standard spectra, the reference material samples (KCl, RGU and RGTh) were measured by the HPGe detector. The accumulated counts for each bin in the standard spectra were divided according to each mass, elapsed live time, and the activity concentration of reference materials. The activity concentrations of a soil sample were determined from the fit of calculated standard spectra to the measured soil sample.
3.3.1 Chi-square minimization technique
A chi-square minimization technique is utilized for the estimation of the optimum activity concentrations (Lee et al., 2010).
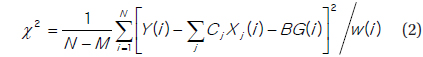
where
M = the number of standard spectra
Y(
X
BG = background spectrum
C

where
C238U, C232Th, C40K = the activity concentration for the individual radionuclides
Usoil, U238U, U232Th, U40K = the uncertainty for the individual spectrum
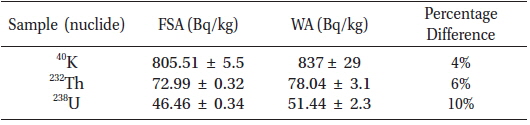
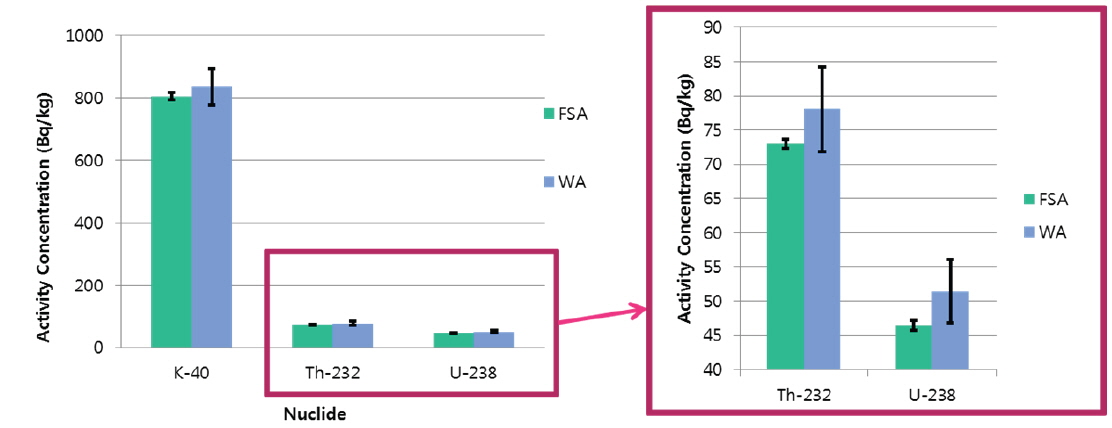
In Table 2, the results from both methods were tabulated and Fig. 6 shows the graphical representation of the difference between the results of WA and FSA. The differences in the resultant activity concentrations between the two methods were found to be 4%, 6% and 10% for the cases of 40K, 232Th and 238U, respectively. These differences are well within the quoted standard uncertainties. Fig. 7 shows the quality of the fitting result; the fitted result of the FSA analysis is superimposed on the measured energy spectrum of the soil sample. From the figure, we can find that the FSA analyses reproduce the experimental spectrum very closely.
[Table 2.] Comparison of the activity concentrations between FSA and WA.

Comparison of the activity concentrations between FSA and WA.
In order to determine the radioactivity of soil-contained natural radioactive nuclides, such as, 40K, 232Th, and 238U, two methods of Windows Analysis and Full Spectrum Analysis (FSA) were utilized to analyze measured data and comparison was made between the analysis results; WA method takes into account of the ROI peak of measured spectrum and FSA considers all energy spectra.
The reference materials used in gamma-ray spectroscopy are IAEA reference material (RGU and RGTh) and KCl sample. The reference materials were sampled in a 90 ml can and were kept for the radioactive equilibrium between radium and radon daughter nuclides. A low-level background HPGe gamma-ray spectrometer operated by anti-coincidence counting method was utilized to make a measurement of reference samples (KCl, RGTh, RGU) and soil samples.
Unlike the WA method, FSA uses count numbers from full-absorption peaks including the contribution from Compton scattering, thus, background energy spectrum and the reference energy spectrum of measurement nuclides were used. In order to determine the activity concentration of soil samples for 40K, 232Th and 238U using the FSA method, a Chi-square minimization technique was used. The radioactivity measurement of soil-contained natural radioactive nuclides using FSA, has achieved the statistical significance in a short period of time showing improvement in statistical uncertainty. The differences in the resultant activity concentrations between the FSA and the WA agreed each other with 10 % of uncertainty. This indicates that the FSA method is effective in gamma-ray spectroscopy and it could be used as an alternative to the generally used WA method. Furthermore, in the area of space development and exploration which has been actively studied worldwide, the efficient FSA method enabling the fast analysis of huge amount of data is expected to be used effectively for the study of geology, resources, and radiological environment in the Moon or planets.