When spacecraft are exposed to space plasmas, electrostatic potential can be built up due to the accumulation of electric charges on their surface or within their body, which is known as spacecraft charging (Hastings & Garrett 1997). Spacecraft charging has been recognized from the beginning of the space era and extensively studied because it could cause damages on spacecraft.
The nature of the charging is mainly determined by the properties of space plasmas. It has been found that plasmas with high temperatures and low densities can produce large electrostatic potential on the surface of spacecraft (Gussenhoven et al. 1985). Earth's radiation belts including the geosynchronous orbit (GEO) consist of such plasmas. DeForest (1972) identified large negative potentials of about 10 kV in eclipse and 1 kV in sunlight from Applied Technology Satellite-5 (ATS-5), which was located in the geosynchronous orbit. On the other hand, plasmas with low temperatures and high densities, which can be found in Earth's ionosphere, do not produce large potential. Thus, in the low Earth orbit (LEO), the potentials of a few V are usually observed (Anderson et al. 1994). However, even in the LEO when spacecraft pass through auroral region potentials larger than ~100 V can be built up due to the precipitating energetic electrons (Gussenhoven et al. 1985, Wahlund et al. 1999, Eriksson et al. 2006).
It has been reported that there exist certain relationships between the spacecraft potential and plasma density or temperature. When the temperature and spacecraft potential are sufficiently high and the temperature is larger than the potential level, the spacecraft potential is approximately proportional to the temperature of ambient plasma (Lai & Della-Rose 2001, Lai 2011). On the other hand, for low potentials it has been reported that a relationship can be found between the potential and plasma density (Pedersen 1995, Escoubet et al. 1997, Ishisaka et al. 2001). The relationship has been used to indirectly estimate plasma density from the measured spacecraft potential in regions inaccessible to other plasma experiments.
In this study, we investigated the influence of the plasma environments on the potential drop observed by the STSAT-1 satellite in the LEO. We used the floating potential, plasma density, and plasma temperature measured by the Langmuir probe, and the electron flux with the energies between 100 eV and 20 keV measured by the Electrostatic analyzer. In Section 2, we describe about the STSAT-1 satellite and its instruments. In Section 3, we present the observational results and the statistical analysis of the relationship between the potential and plasma properties. Discussion and summary are given in Section 4.
STSAT-1 was launched on 27 September 2003 into a sunsynchronous, polar orbit with the altitude of 680 km and inclination of 98°. The orbital period was 98.5 minutes. STSAT-1 passed through the equator at 22:00 MLT in the nightside. STSAT-1 has a dimension of 66 cm × 60 cm × 80 cm and the weight of 106 kg. The instruments onboard STSAT-1 consist of a Far-ultraviolet Imaging Spectrogragh (FIMS), an Electrostatic Analyzer (ESA), Solid State Telescopes (SST), a Langmuir Probe (LP) and a Scientific Magnetometer (SM).
In this study, the data from the ESA and LP were used (Lee et al. 2005, Lee et al. 2013). The ESA is a top-hat electrostatic analyzer with a field of view 180° × 4.2°. It measured the electron fluxes in the energy range from 100 eV to 20 keV, which was divided into 29 energy channels. A full energy sweep took 210 msec. Because STSAT-1 did not spin, but used three-axis stabilizing attitude control, the ESA could only have provided two-dimensional measurements in the angular range from 0° to 180° with the angular resolution of 22.5°. The LP measured the floating potential and the density and temperature of thermal electrons. The time resolution was 200 msec. The floating potential was used as a measure of spacecraft charging.
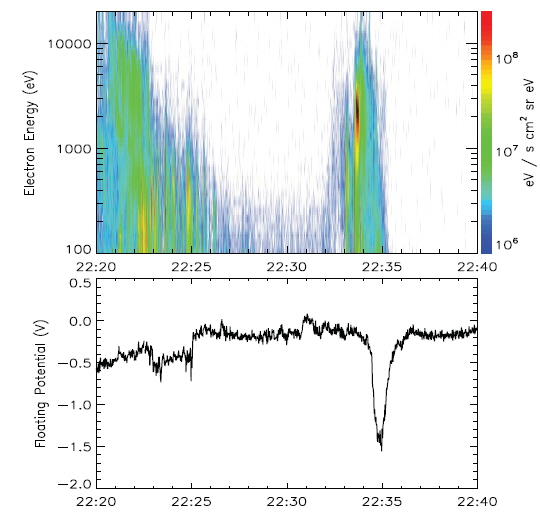
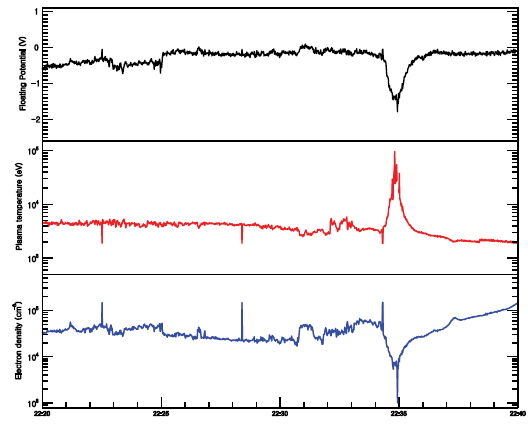
Fig. 1 shows a spacecraft charging event occurred on STSAT-1 on 5 April 2004. From the top panel, the figures represent floating potential, plasma temperature, and electron density. In the beginning of the observation, the floating potential was between -0.7 and 0 V with small fluctuations, and it suddenly reduced from -0.1 V to -1.4 V at 22:34 UT and recovered to the previous level. Along with the reduction of the floating potential, the electron density decreased an order of magnitude from ~6×104 cm-3 to ~6×103 cm-3. Moreover, the variation of the floating potential is almost identical to the variation of the density. On the other hand, the plasma temperature largely increased more than 30 times from ~3×10³ K to ~105 K when the floating potential decreased. However, the reverse of the variation of the temperature is also similar to the variation of the potential. Thus, both the density and temperature would have close relationship with the floating potential drop.
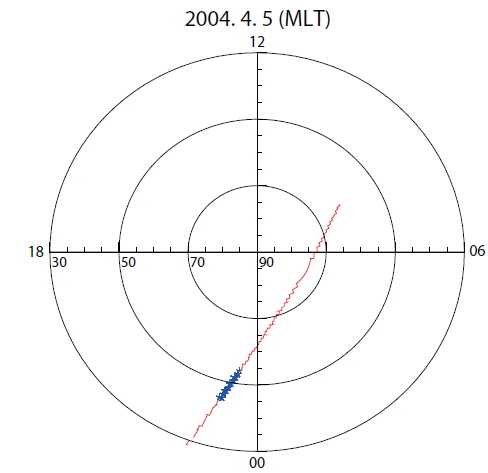
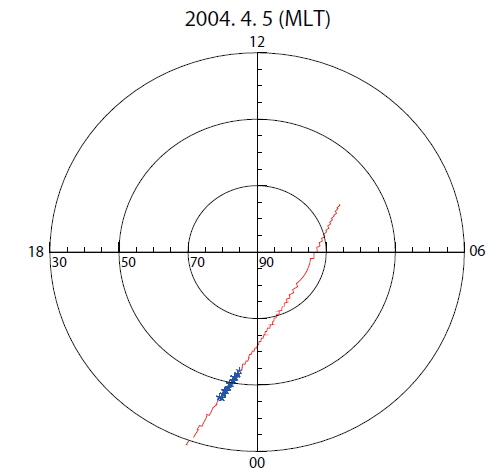
Around the occurrence of the event, STSAT-1 was moving from the dayside to the nightside across the polar region in the northern hemisphere. Fig. 2 shows the trajectory of STSAT-1 during the same interval as in Figure 1. The charging event occurred between 62.1° and 45.4° in the magnetic latitude (MLAT) (blue asterisks in Fig. 2), and the potential had the minimum at 56.3° MLAT.
An interesting feature has been observed in electron fluxes in association with the floating potential drop. Fig. 3 shows the energy-time spectrogram of the energy flux of electrons with energies between 100 eV and 20 keV. Enhancement of the energy flux was observed from 22:33 to 22:35 UT prior to the floating potential drop. The enhancement of the energy flux is associated with the precipitation of electrons from the outer magnetosphere into ionosphere, which could result in auroras. At ~22:34 UT the energy flux increased very largely for energies between ~1 and 6 keV. The decrease of the floating potential started from about 22:34:20 UT, at which the electron flux rapidly decreased. The floating potential became minimum when the energy flux was almost disappeared.
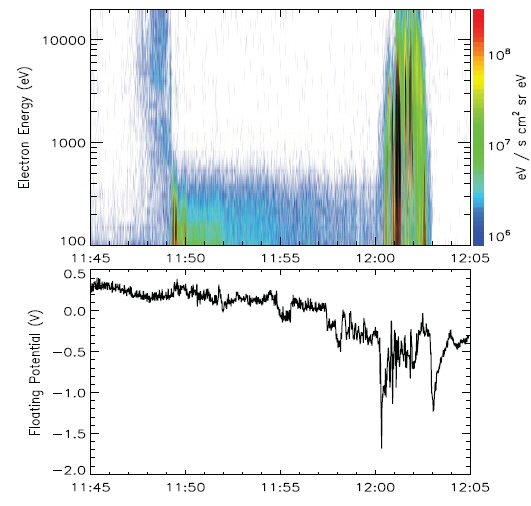
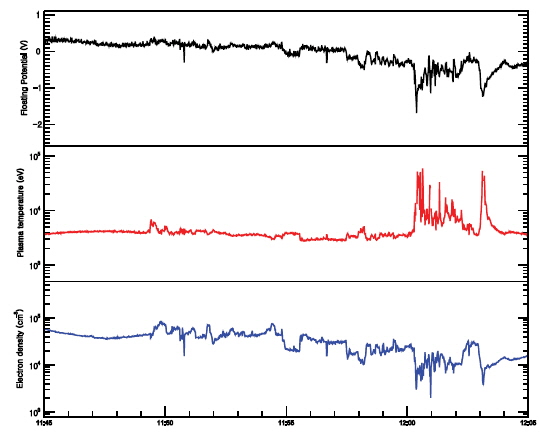
The other events show similar features to the 5 April event. Fig. 4 shows another example observed on 13 October 2004. In this event the floating potential dropped twice by ~0.8 V. Similar to the 5 April event the electron density decreased by ~1.7×104 cm-3 and ~2.1×104 cm-3 and the plasma temperature increased by ~2.1×10⁴ K and 1.4×10⁴ K for each floating potential drop, respectively. The energy flux of electrons also shows a similar tendency to the 5 April event (Fig. 5). However, in this event the first potential drop occurred prior to the electron flux enhancement. The potential drop recovered to the undisturbed level as the electron flux increased and another drop occurred after the electron flux enhancement stopped. These observations imply that these potential drops are more closely associated with the density and temperature variations of cold plasmas than the precipitating electron fluxes with energies between ~100 eV and ~20 keV.
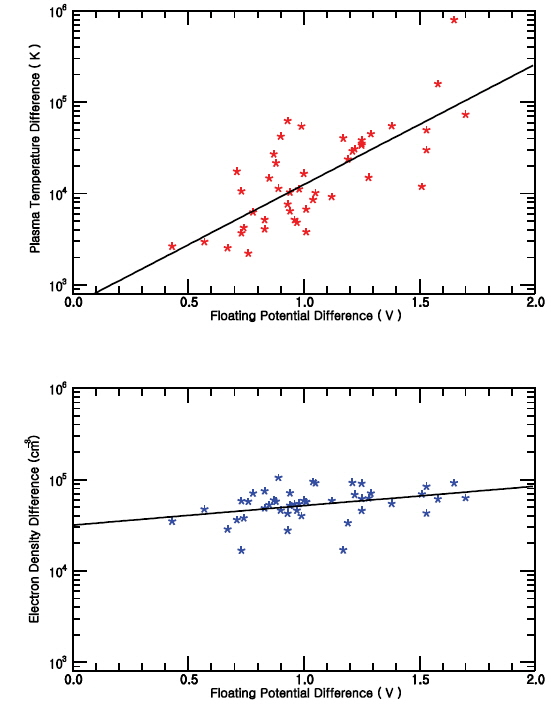
In each event the variation of the floating potential at the potential drop looks very similar to the variations of the density and temperature. To examine if there exists any general relationship between them, we statistically analyzed the floating potential drop events. Fig. 6 shows the floating potential difference vs. the density difference (Fig. 6(a)) and the temperature difference (Fig. 6(b)). The difference of each quantity was estimated as the difference between the averages of the ambient values and the values around the minimum or maximum. The density difference shows poor correlation with the floating potential difference. In contrast, the temperature difference shows very good correlation with the floating potential difference. The correlation coefficient between the temperature and floating potential differences is ~0.92, and the relationship is estimated as follows:
ΔV=0.19 log(ΔT)-0.83,
when the temperature and potential were measured in K and V, respectively.
Because the variations of the density around the floating potential drops are very similar to the variations of the floating potential, we expected that the density difference also has good correlation with the floating potential difference. However, the density difference for each event produced different floating potential difference. We also examined the relationships between the peak values of the density and floating potential, the peak values of the temperature and floating potential, the peak value of the floating potential and density difference, and the peak value of the floating potential and temperature difference. However, there was no good correlation between these quantities.
In this paper, we examined the effect of space plasmas on the floating potential drop observed by the LP instrument onboard the STSAT-1 satellite. STSAT-1 is a low-altitude, polar-orbiting satellite, which passes through the topside ionosphere and auroral region. In the ionosphere, the floating potential is mainly determined by the cold ionospheric plasmas, which usually produces the potential larger than -10 V. In the auroral region, large potential drops from a few hundred V to a few kV can be produced by the precipitating energetic electrons. It should be noted that in this study, we used the cases where the floating potential drop was less than 5 V. When the potential drop is large, the LP instrument cannot correctly measure the temperature and density. Thus, in order to examine the effect of cold ionospheric plasmas on the floating potential drop, we only used the small potential drops of less than 5 V. In the other spacecraft that observed large potential drops, the potential drops were indirectly induced from the measurement of particles using the other instruments (e.g., Gussenhoven et al. 1985).
In our observaions, the floating potential drops were not much affected by the auroral precipitation. Moreover, the potential drops occurred before or after the auroral precipitation. This is different from the previous results in which large potential drops occurred when there was auroral precipitation (e.g., Gussenhoven et al. 1985). This might be because the cold electron density was large enough to reduce the effect of spacecraft charging by the precipitating auroral electrons. In our observations, the electron densities were larger than 103 cm-3, while the large potential drops in the previous observations occurred when the electron densities were well below 103 cm-3 (Yeh & Gussenhoven 1987).
The variation of the floating potential followed the variations of the plasma temperature and density. Interestingly, for the floating potential drop, there exists good correlation between the potential drop and temperature enhancement. On the other hand, there is only weak correlation between the potential drop and density decrease. Thus, although the potential tends to vary with both the temperature and density, the magnitude of the potential drop mainly depends on the magnitude of the temperature enhancement.