Polykrikoid dinoflagellates have distinctive morphological features compared to other dinoflagellates as they form multinucleated pseudocolonies. The polykrikoid dinoflagellates divide into two genera, Pheopolykrikos Chatton and Polykrikos Bütschli, with the type species being Pheopolykrikos beauchamphii and Polykrikos schwartzii, respectively. At present, they include 8 species (i.e., Ph. beauchamphii in the genus Pheopolykrikos and P. geminatum, P. hartmannii, P. herdmanae, P. kofoidii, P. lebourae, P. schwartzii, and P. tanit in the genus Polykrikos). Among these species, classification of one species, P. hartmanii has been controversial, transferring back and forth between the two genera over the past 80 years (Zimmermann 1930, Matsuoka and Fukuyo 1986, Hoppenrath et al. 2010) because there was no consistency about taxonomic keys (e.g., ratio of the numbers of zooids and nuclei of pseudocolonies, photosynthesis, a single-celled life cycle stage) to classify the two genera.
Polykrikoid species are all known to be marine planktonic dinoflagellates, except for the benthic species Polykrikos lebourae Herdman, which resides in intertidal sandy sediments. Pseudocolonies of P. lebourae consist of eight zooids and two nuclei, although reduced pseudocolonies comprised of four or five zooids with one nucleus have been observed (Hoppenrath and Leander 2007b). Pseudocolonies of P. lebourae are laterally flattened and lacking zooid borders although each zooid has its own a pair of flagella and cingulum. Descriptions of P. lebourae have included both heterotrophic and photosynthetic forms (Herdman 1923, Balech 1956, Dragesco 1965). The non-pigmented, heterotrophic form of P. lebourae is now classified as a different species, namely P. herdmanae Hoppenrath et Leander, because the molecular phylogeny placed it into a separate lineage from the photosynthetic form (Hoppenrath and Leander 2007b). Polykrikos lebourae contains both plastids and taeniocyst-nematocyst complex structures like P. hartmannii, but the plastid of P. lebourae exhibits unusual ultrastructure, having only two enveloping membranes, thylakoids in stacks of two, and central pyrenoids devoid of thylakoids. By contrast, P. hartmannii possesses typical plastids in peridinin-containing dinoflagellates having three stacks of thylakoids and enveloping by three outer membranes (Hoppenrath and Leander 2007b). Also, molecular phylogenetic relationships demonstrated that P. lebourae is closely related to several heterotrophic Polykrikos species rather than to other phototrophic species within polykrikoids, suggesting that the plastids of P. lebourae may be either acquired via an endosymbiotic replacement event following the reduction or loss of the peridinin-containing plastids, or be retained via kleptoplastidy (Hoppenrath and Leander 2007a, Tang et al. 2013). Despite the presence of plastids, however, previous attempt to establish P. lebourae in culture failed (e.g., Hoppenrath and Leander 2007b) and thus the unavailability of cultures of this species has posed a major obstacle to further detailed exploration of ecophysiology and evolution of plastid of the dinoflagellate.
Here, we isolated P. lebourae from sandy sediment of an intertidal flat on Korean western coast, successfully established it in culture by supplying a benthic cryptophyte, Rhodomonas sp., as prey, and have maintained stock culture over the past 3 years. Using this stock culture, we explored 1) phagotrophy and potential prey resources of P. lebourae, 2) growth and grazing responses of P. lebourae to different prey organisms, 3) the effect of prey concentration on the growth and grazing rates and gross growth efficiency of P. lebourae when fed three different prey organisms, and 4) the growth kinetics of P. lebourae at different light intensities.
Sediment samples were taken from Dongho beach of Korean western coast during low tide in November 2011. A trowel was gently scrapped over the surface of the sandy sediment and used to scoop sediment and ambient seawater into plastic bag. The samples were transported to the lab and observed at 100× to 400× magnification using an inverted microscope (IX-51; Olympus, Tokyo, Japan). The benthic dinoflagellate P. lebourae was isolated using a capillary pipette and grown in 30 psu f/2-Si medium (Guillard 1975) at 20℃ under 14 : 10 of light : dark cycle of cool-white fluorescent light at 40 µmol photons m−2s−1, with the cryptophyte Rhodomonas sp. 2 (rCR04) provided as prey. Five benthic cryptophytes, Chroomonas sp. 1 (gCR07), Chroomonas sp. 2 (gCR09), Rhodomonas sp. 1 (rCR02), Rhodomonas sp. 2 (rCR04), and Rhodomonas sp. 3 (rCR05) and four benthic dinoflagellates, Amphidinium sp. (bdAmp01), Heterocapsa sp. (bdHet01), Thecadinium kofoidii (bdTK01), and Prorocentrum fukuyoi (bdPF03) were isolated using the same method described for P. lebourae and grown under the same culture condition as described above.
Live specimens were observed using a bright field microscope (Axio imager A2; Carl Zeiss Inc., Hallbergmoos, Germany) equipped with differential interference contrast optics. Light micrographs were taken at 1,000× magnification using a photomicrographic system (AxioCam HRc; Carl Zeiss Inc.) coupled to the microscope.
Growth and grazing responses of Polykrikos lebourae were determined for nine different prey organisms: five benthic cryptophytes, Chroomonas sp. 1 (gCR07), Chroomonas sp. 2 (gCR09), Rhodomonas sp. 1 (rCR02), Rhodomonas sp. 2 (rCR04), and Rhodomonas sp. 3 (rCR05), and four benthic dinoflagellates, Amphidinium sp. (bdAmp01), Heterocapsa sp. (bdHet01), Thecadinium kofoidii (bdTK01), and Prorocentrum fukuyoi (bdPF03). Stock cultures of prey species were diluted with f/2-Si medium to achieve the ratio of 1 : 30 of predator and prey based on biovolume, expect for P. fukuyoi adjusted to the ratio of 1 : 10. The diluted cultures of the cryptophytes and the dinoflagellates were distributed into a total of 24 sets of 48-well plate. Each set of the plate had three wells containing prey and predator mixtures as treatments and six wells containing either prey only or predator only as controls. Every two plates including treatments and controls for the nine prey species were fixed at each sampling day. Stock culture of Polykrikos used for this experiment was starved for two weeks prior to the set-up of the experiment. Three Polykrikos cells were individually added to the treatment wells including each prey organism. When the prey Amphidinium was depleted in the treatment cultures at the day 10, the prey cells were freshly supplied once again to achieve the final concentration of the ratio of prey and predator of 10 to 1. All treatments and controls were placed on the shelves under the same culture condition as described above. Each well plate including prey and predator mixture and predator only was fixed by adding 3 µL of Lugol’s solution (final conc. 1%) into each well at 2-3 days intervals for first 10 days of the experiment period and thereafter at 5-7 days intervals for the remaining period. Abundances of the organisms were enumerated using Sedgwick-Rafter chambers at 100-200× magnification under a microscope (Olympus BX-50; Olympus). Cells present in optical transects of each chamber were summed until the entire chamber was examined, or until over 200 cells were counted. Growth rates of Polykrikos (µ) with different prey organisms were calculated using the following exponential growth equations:

, where N1 and N0 are cell concentrations at t1 and time t0, respectively, and t1 − t0 is the time interval between samplings. Ingestion rate (I, in cells Polykrikos−1 d−1) of P. lebourae was calculated according to Kim et al. (2008): ingestion rates of P. lebourae were estimated from changes in prey cell numbers in treatments compared with prey densities in controls. Gross growth efficiency (GGE, %) was defined as predator carbon produced per prey carbon ingested (Kim et al. 2008). GGE was calculated as follows:

, where µ is growth rate (d−1) of Polykrikos, I is ingestion rate (prey cells Polykrikos−1 d−1), Cpo and Cpe indicate carbon contents of Polykrikos and each prey, respectively. Cell volume was determined by measuring cell length, width, and depth using a Zeiss Axio Imager A2 microscope equipped with an AxioCam HRc (Carl Zeiss Inc.) photomicrographic system at 400× magnification. Biovolume was calculated using the geometric formulas of π/6 × width2 × length and π/6 × width × depth × length for the cryptophytes and the dinoflagellates, respectively (Vadrucci et al. 2007). Carbon content was estimated from the cell volume using conversion factors of 220 fg C µm3 for cryptophytes (Børsheim and Bratbak 1987) and pg C cell−1 = 0.760 × (volume, µm3)0.819 for dinoflagellates, respectively (Menden-Deuer and Lessard 2000).
To investigate the effect of prey concentration on growth and grazing responses of P. lebourae, we chose three prey organisms led to relatively high growth rates of the predator based on the result of the previous experiment: the cryptophyte Rhodomonas sp. 2 (rCR04) and the dinoflagellates Amphidinium sp. and Heterocapsa sp. The initial concentrations (cells mL−1) of each predator/prey mixture were 5/25, 5/50, 5/100, 5/250, 5/500, 5/1,500, and 5/3,500. In addition, triplicate controls containing only prey and only predator were also run at the same concentrations as ones in the mixtures of predator and prey. Data on growth rates were fitted to a modified MichaelisMenten model, which includes a positive y-axis intercept. The modified equation was applied following Kim et al. (2008) and the parameters were estimated using the software SigmaPlot (version 10.0; MMIV Systat software Inc., San Jose, CA, USA) and the equation:

, where µ is growth rate of Polykrikos, µmax is maximum growth rate, x is prey concentration (cells mL−1), x′ is compensation point of prey concentration where growth is 0 (µ = 0), and Km is prey concentration sustaining 1/2 µmax.
Data on ingestion rates were fitted a Michaelis-Menten model and the equation:
, where I is ingestion rate of Polykrikos, Imax is maximum ingestion rate, x is prey concentration (cells mL−1), Ks is prey concentration sustaining 1/2 Imax.
This experiment was conducted to investigate the effect of light intensities on growth and ingestion rates of P. lebourae. Irradiance was measured with a radiometer (Model QSL-2101; Biospherical Instruments, San Diego, CA, USA). Stock culture of P. lebourae that had been maintained at 40 µmol photons m−2 s−1 was distributed to a total of 18 plates (96-well in each plate). Three Polykrikos cells were distributed to each well in triplicate treatments including prey Rhodomonas sp. 2 (rCR04) to achieve a predator/prey ratio of 1/30 which is assumed to represent prey saturation. One third of the 18 sets of well plates was incubated at each of the following irradiances: 10, 40, and 120 µmol photons m−2 s−1 for about 40 days. Monocultures with only Rhodomonas sp. 2 or Polykrikos served as controls for each light intensity. Prey and predator cells in treatments and controls were fixed using Lugol’s solution at every 1-4 days during the experiment period and counted for cell abundance as described above.
Data were presented as mean ± standard error (SE) of triple replicates unless otherwise stated. All statistical analyses were performed using SPSS Statistics version 21 (IBM Co., Armonk, NY, USA). Significant differences were assessed by one-way ANOVA and Turkey’s honestly significant difference post hoc test at the 95% significance level (p < 0.05).
The biovolume of the benthic prey used in this study covered a broad range, being smallest in the cryptophyte Chroomonas sp. 2 (112 µm3) and largest in the dinoflagellate Prorocentrum fukuyoi (22,003 µm3) (Table 1). Despite the large difference in biovolume of prey, P. lebourae was capable of ingesting all 9 potential prey organisms tested in this study (Fig. 1). The dinoflagellate captured prey cells using a tow filament and then phagocytized them through the posterior end. Sustainable growth of P. lebourae, however, was supported only with addition of the cryptophytes, Rhodomonas sp. 1 and Rhodomonas sp. 2, and the dinoflagellates, Amphidinium sp. and Heterocapsa sp. (Fig. 2C, D, F & G). When offered other prey, cell abundance of P. lebourae slightly increased by 24 days at growth rates of less than 0.1 d−1 and reached shortly to stationary phase or dramatically decreased although the prey cells still remained replete (Table 1, Fig. 2A, B, E, H & I). The growth rates of Polykrikos were relatively higher in the presence of Amphidinium sp., Heterocapsa sp., and Rhodomonas sp. 2 than other prey species with mean growth rates of 0.17, 0.17, and 0.16 d−1, respectively, during exponential growth period of the predator (Table 1). By comparison, cell abundances of Polykrikos in monocultures remained constant up to 10 days and thereafter gradually decreased (Fig. 2).
[Fig. 2.] Growth of Polykrikos lebourae when supplied 9 different prey organisms. Circles and triangles indicate Polykrikos and each prey organism, respectively. Closed symbols indicate the mixed cultures of predator and prey, and open symbols indicate monocultures of predator or prey. Chroomonas sp. 1 (gCR07) (A), Chroomonas sp. 2 (gCR09) (B), Rhodomonas sp. 1 (rCR02) (C), Rhodomonas sp. 2 (rCR04) (D), Rhodomonas sp. 3 (rCR05) (E), Amphidinium sp. (F), Heterocapsa sp. (G), Thecadinium kofoidii (H), and Prorocentrum fukuyoi (I) as prey. Symbols and error bars represent mean and standard errors of triplicate cultures.
While P. lebourae ingested prey ranging in biovolume from 112 to 22,003 µm3 , ingestion rates were inversely correlated with prey biovolume (r2 = 0.90, p = 0.0001) (Table 1, Fig. 3A). Growth rate and GGE of P. lebourae were not significantly correlated with the ingestion rate (p > 0.05) (Fig. 3B & C).
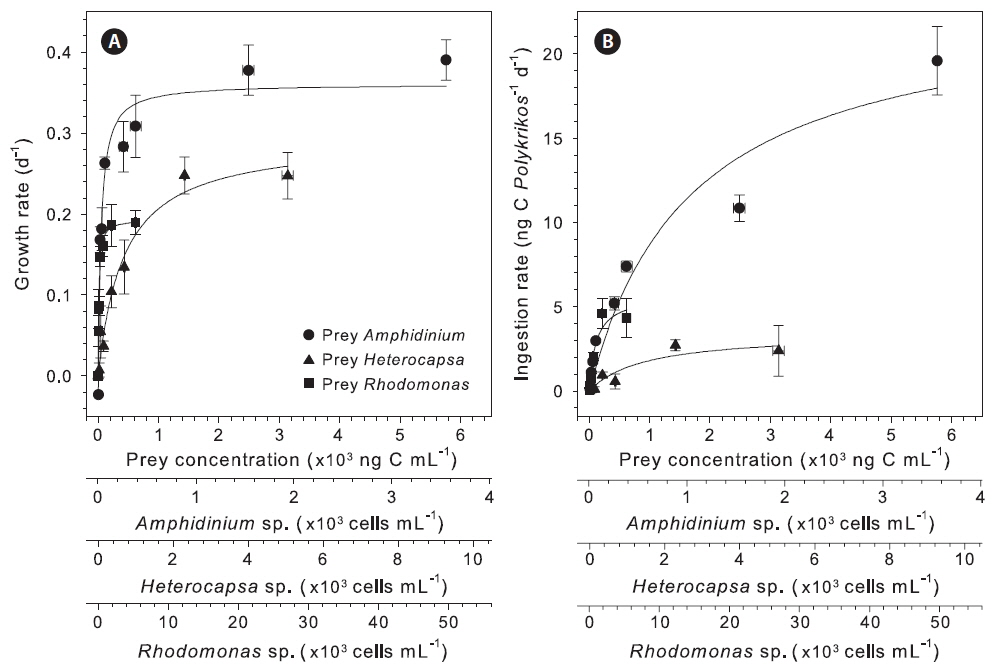
When fed Amphidinium sp., Heterocapsa sp., and Rhodomonas sp. 2, the growth rate of P. lebourae increased sharply with increasing prey concentrations up to 618, 1,418, and 60 ng C mL−1, respectively, and thereafter saturated (Fig. 4A). When data were fitted to a modified Michaelis-Menten equation, the µmax of P. lebourae was 0.36, 0.29 , and 0.19 d−1 when fed Amphidinium sp., Heterocapsa sp., and Rhodomonas sp. 2, respectively (p = 0.0001), with Km being 45.9, 423.3, and 12.0 ng C mL−1, respectively (Table 2). Ingestion rate of P. lebourae increased with increasing prey concentration, with saturation occurring above 5,700, 3,100, and 225 ng C mL−1 for Amphidinium sp., Heterocapsa sp., and Rhodomonas sp. 2, respectively (Fig. 4B). The Imax was 23.17 ng C Polykrikos−1 d−1 for Amphidinium sp., 3.45 ng C Polykrikos−1 d−1 for Heterocapsa sp., and 5.70 ng C Polykrikos−1 d−1 for Rhodomonas sp. 2, with Ks of 1,665.0 ng C mL−1 for Amphidinium sp., 910.0 ng C mL−1 for Heterocapsa sp., and 114.4 ng C mL−1 for Rhodomonas sp. 2 (Table 2). When P. lebourae fed either Heterocapsa sp. or Rhodomonas sp. 2, values for GGE ranged from 68 to 520 % across the range of prey concentrations, with a remarkable increase observed at low prey concentrations (Fig. 5). By comparison, when fed Amphidinium sp., P. lebourae showed much lower GGE ranging from 18 to 121%, with no sharp increase observed at low prey concentrations (Fig. 5).
Polykrikos lebourae in the presence of the prey Rhodomonas sp. 2 displayed different patterns of response to light intensities (Fig. 6). At the moderate light intensity of 40 µmol photons m−2 s−1, P. lebourae grew well for the first 17 days with a growth rate of 0.14 ± 0.01 d−1 and then reached stationary phase (Fig. 6B). By comparison, at dim light of 10 µmol photons m−2 s−1 and high light of 120 µmol m−2 s−1, the abundance of P. lebourae slightly increased with growth rates of 0.03 ± 0.03 and 0.03 ± 0.02 d−1 for the first 3 and 6 days, respectively, and thereafter decreased gradually toward the end of the experiment even if prey remained replete in the cultures (Fig. 6A & C). In the absence of prey, P. lebourae abundances remained constant at light intensities of 10, 40, and 200 µmol photons m−2 s−1 for 4, 24, and 16 days, respectively and then rapidly decreased thereafter in all control cultures (Fig. 6G-I). Ingestion rate of P. lebourae was estimated as 0.42 ± 0.12, 0.39 ± 0.35, and 0.43 ± 0.10 ng C Polykrikos−1 d−1 at 10, 40, and 200 µmol photons m−2 s−1, respectively, during the exponential growth period of each prey (3, 5, and 6 days, respectively) and did not differ significantly among the light regimes (one-way ANOVA, p > 0.05) (Fig. 6).
Mixotrophy, i.e., a combination of phagotrophy and phototrophy in a single organism, is widespread among dinoflagellates (e.g., Stoecker 1999, Hansen 2011). Despite the many previous reports on the occurrence of mixotrophy in dinoflagellates, only a few dinoflagellates are known to be obligate mixotrophs, requiring both prey and light for growth and survival. Thus far, Dinophysis spp. (Park et al. 2006, Kim et al. 2008), Esoptrodinium sp. (Fawcett and Parrow 2014), Paragymnodinium shiwhaense (Yoo et al. 2010), and an unidentified Antarctic dinoflagellate (Gast et al. 2007) fit this category. Our results now add a new member, the dinoflagellate Polykrikos lebourae, to this list of obligate mixotrophic dinoflagellates.
Prey specificity of obligate mixotrophic dinoflagellates varies greatly from non-specific to highly specific. The obligate mixotrophs, Dinophysis spp. and the unidentified Antarctic dinoflagellate appear to require specific prey. The mixotrophic ciliate Mesodinium rubrum is a sole prey known thus far for the former species (Park et al. 2006), while the latter was recently reported to specifically feed on the haptophyte Phaeocystis antarctica (Sellers et al. 2014). Natural populations of Dinophysis spp., however, can contain plastids of multiple algal origins (Kim et al. 2012), indicating the possibility of prey other than the well-known prey ciliate M. rubrum. Interestingly, those dinoflagellates with strong prey specificity are obligate mixotrophs that practice the retention of plastids of cryptophyte and haptophyte origins, respectively. The dinoflagellates retain the plastids through selective feeding on the intermediate prey M. rubrum, itself also a specific predator for the cryptophyte Teleaulax / Geminigera genus complex (Yih et al. 2004, Kim et al. 2012) and the haptophyte P. antarctica (Gast et al. 2007, Sellers et al. 2014), respectively. Thus far, plastid-retaining, obligately mixotrophic dinoflagellates having broad prey range have not been reported.
While both Esoptrodinium sp. (Fawcett and Parrow 2014) and Paragymnodinium shiwhaense (Yoo et al. 2010) are also obligate mixotrophs, they are different from the other obligately mixotrophic dinoflagellates mentioned above in that they have their own plastids (i.e., peridinin-type plastids) and have a broad range for prey. The former can feed on a variety of freshwater protists (diatom, chlorophyte, chrysophyte, cryptophyte, dinoflagellate, and euglenoid microalgae) similar in size to itself, but the most suitable prey for promoting active feeding and sustained growth is the cryptophyte Cryptomonas ovata (Fawcett and Parrow 2014). Also, P. shiwhaense seems to be a prey generalist because it can ingest various protists (prymnesiophyte, cryptophyte, rhaphidophyte, and dinoflagellate), with positive growth supported by most of the different prey (Yoo et al. 2010). The benthic dinoflagellate P. lebourae appears to be the same case to Esoptrodinium sp. and P. shiwhaense rather than to Dinophysis spp. and the unidentified Antarctic dinoflagellate, as it ‘apparently’ has its own plastids (also, see below) as well as has a broad range for prey. Polykrikos lebourae appears to have a wider range in prey size than Esoptrodinium sp. and P. shiwhaense, ingesting prey range from ~5 µm (Chroomonas sp. gCR09) to ~30 µm (Prorocentrum fukuyoi) in diameter, while Esoptrodinium sp. and P. shiwhaense mostly ingest prey similar to their own size. The difference in prey size among these dinoflagellates may be associated with feeding mechanism. That is, P. lebourae engulfs whole prey cells after capturing them using a tow filament (this study), whereas the other two species ingest prey through a feeding tube or so-called peduncle (Yoo et al. 2010, Fawcett and Parrow 2014).
Despite the fact that Polykrikos lebourae can feed on a broad range of prey species varying in size, not all prey species support sustained growth. For example, unlike Rhodomonas spp., Chroomonas spp. did not support the significant growth of P. lebourae, even though ingestion rates of P. lebourae on Chroomonas spp. (0.81-0.84 ng C Polykrikos−1 d−1) were higher than those on Rhodomonas spp. (0.08-0.44 ng C Polykrikos−1 d−1). On the other hand, while GGE (46-51%) of P. lebourae on Chroomonas spp. were within the range (10-70%) reported for protists (Verity 1985, Caron and Goldman 1990, Skovgaard 1998), those on Rhodomonas spp. were greatly high (280-340%). The observed difference in growth response of P. lebourae when fed either Chroomonas or Rhodomonas may be explained by several factors. First, the nutritional value of Chroomonas for P. lebourae may not be as high as that of Rhodomonas. Second, P. lebouraemight acquire new plastids through feeding on Rhodomonas, with active photosynthesis of freshly retained plastids substantially supplementing growth of P. lebourae. Unlike the typical peridinin-type plastids which contain thylakoids in stack of three surrounded by a triple membrane envelope (Schnepf and Elbrächter 1999), P. lebourae has unusual plastids consisting of thylakoids in stacks of two and enveloping two membranes, although whether these plastids are permanent or are derived from the prey (i.e., stolen plastids; kleptoplastids) is still controversial (Hoppenrath and Leander 2007b). Given that the kleptoplastidic dinoflagellate Dinophysis caudata can acquire new plastids of cryptophyte origin through ultrastructural modification and retention after feeding on the mixotrophic ciliate Mesodinium rubrum (Kim et al. 2012), we cannot completely rule out the possibility that P. lebourae acquires plastids when feeding on a variety of prey types.
Among the benthic dinoflagellates used as prey in this study, Amphidinium and Heterocapsa supported significant growth of P. lebourae. When fed on these two dinoflagellates, P. lebourae grew well at the same growth rate of 0.17 d−1, even though ingestion rate of P. lebourae on Amphidinium was an order of magnitude greater than that on Heterocapsa. Nonetheless, GGE of P. lebourae on Heterocapsa was much higher (842%) when compared to that on Amphidinium (97%). One possible explanation for this pattern is that the nutritional value of Amphidinium is much smaller than that of Heterocapsa. Indeed, more fecal pellets were observed in cultures of P. lebourae fed Amphidinium compared to those fed Heterocapsa (M. G. P. personal observation), indicating that undigested materials of the prey Amphidinium not used by P. lebourae are egested and less nutritional. Second, the thecate dinoflagellate Heterocapsa may be more resistant to enzymatic digestion in food vacuoles of P. lebourae compared to athecate dinoflagellate Amphidinium, thereby allowing the functional plastids of Heterocapsa to remain photosynthetically active over a relatively longer period.
GGE of protists as a function of prey concentration has been reported for both bacterivorous and plastidretaining ciliates, in which GGE tends to decrease with increasing prey concentration (Heinbokel 1978, Stoecker and Evans 1985, Jonsson 1986, Schoener and McManus 2012). By comparison, the effect of prey concentration on GGE in dinoflagellates is at present not commonly studied. To our knowledge, the only previous report on the effect of prey concentration on GGE of dinoflagellates was for a kleptoplastidic dinoflagellate Amylax triacantha, in which GGE decreased with increasing prey (Mesodinium rubrum) concentration, with the highest GGE (81-179%) observed at low prey concentrations (Park et al. 2013). The authors interpreted the extremely high GGE of A. triacantha observed at low prey concentrations as being associated with a substantial supplement of photosynthetic products from retained plastids. GGE of P. lebourae for three prey species, Amphidinium sp., Heterocapsa sp., and Rhodomonas sp. tested in this study also showed a pattern similar to that of reported for A. triacantha, with extremely high GGE at low prey concentrations and moderate or low GGE at high prey concentrations. This suggests that P. lebourae grows heterotrophically at high prey concentrations but its growth seems to be more dependent on a certain growth factor or photosynthesis of plastids derived from the prey. Interestingly, when Heterocapsa sp. was offered as prey, GGE of P. lebourae almost exceeded 100% over all prey concentrations. As noted above, more resistant characteristics and resultant active photosynthesis or an unknown growth factor from Heterocapsa may contribute greatly to the observed high GGE.
Polykrikos lebourae appears to require light for sustained growth, even when a sufficient amount of prey cells was provided. While the cryptophyte Rhodomonas sp. grew well at high light intensity (120 µmol photons m−2 s−1) as well as at moderate light intensity (40 µmol photons m−2 s−1), P. lebourae grew well just at the moderate light intensity (40 µmol photons m−2 s−1) in the presence of prey, but did not grow at dim light (10 µmol photons m−2 s−1) and high light (120 µmol photons m−2 s−1) intensities in prey-replete conditions. Similar growth response on light intensity has also been found in a benthic kleptoplastidic dinoflagellate Amphidinium poecilochroum (Jakobsen et al. 2000). Given that P. lebourae and its prey Rhodomonas live interstitially in sand sediment environment, different growth responses of the predator and prey to light intensity are notable and indicate that the former may be more adapted to a certain moderate light (40 µmol photons m−2 s−1) environment than the latter. It may be likely that some unknown materials required for growth of P. lebourae are produced by the prey at moderate to high light environments. The unknown materials and / or the plastids of P. lebourae may be, however, easily photodamaged and could not be repaired inside P. lebourae cells under high light (120 µmol photons m−2 s−1) environment, eventually leading to cell death. At dim light (10 µmol photons m−2 s−1) environment, production of the unknown materials by prey and / or photosynthesis of P. lebourae may not be enough to support to the positive growth of P. lebourae.
Conclusively, the benthic dinoflagellate Polykrikos lebourae is an obligate mixotroph, which requires both prey and light for sustained growth and survival. The benthic dinoflagellate P. lebourae is a prey generalist with a limited variety of prey supporting positive growth and fits the category of the mixotrophic dinoflagellates, in which food uptake results in a large increase in growth rate (i.e., assigned as type 2 in Hansen 2011). Availability of P. lebourae in a culture may provide a better understanding of the status of the plastids and plastid evolution in this dinoflagellate.