검색 전체 메뉴
PDF
맨 위로
OA 학술지
Enhanced Adhesion and Transmittance Uniformity in Laminated Polymer-Dispersed Liquid Crystal Films
  • 비영리 CC BY-NC
  • 비영리 CC BY-NC
ABSTRACT
Enhanced Adhesion and Transmittance Uniformity in Laminated Polymer-Dispersed Liquid Crystal Films
KEYWORD
Liquid crystals , Polymer-dispersed liquid crystals , Flexible displays , Lamination process , Phase separation
  • I. INTRODUCTION

    Polymer-dispersed liquid crystals (PDLCs) consist of randomly distributed liquid crystal (LC) droplets in a polymer matrix, and result from the phase separation of a LC/prepolymer mixture [1-4]. When a PDLC film is made with an LC having an extraordinary refractive index (ne) different from the refractive index (np) of the polymer matrix, this refractive index mismatch condition and the randomly distributed optical axes of the droplets leave the PDLC film opaque in its field-off state [5-7]. However, when the ordinary refractive index (no) of the LC is equal to np, the initially opaque PDLC layer can be made transparent by applying a voltage to reorient the LCs in the polymer matrix and ensure that the refractive indexes match for normally incident light [5-7]. Unlike other LC-based devices, PDLC-based devices are easily implemented as LC alignment layers and polarizers are not required. This electrically switchable scattering behavior of the PDLC structure is promising for a number of electro-optical applications such as projection displays [8], flexible displays [9], holographic optical elements [10], and smart windows [11]. The phase separation for PDLCs preparation can be induced by ultraviolet (UV) light [12], temperature [13], and solvents [14], with the most appropriate process depending on the prepolymer type and the polymerization mechanism. UV-induced phase separation is generally used to deposit PDLC layers on plastic film substrates, because the plastic films are easily damaged by solvents and/or high temperatures [15].

    To form a PDLC layer between two indium thin oxide (ITO)-coated plastic films, the favored approach is to print the LC/prepolymer mixture onto the first plastic substrate and then laminate with the second film [16, 17]. This is preferable to conventional capillary filling of the LC/prepolymer mixture because a uniform LC/prepolymer ratio is more easily maintained, leading to uniform distributions of LC droplets and uniform light scattering behavior. If the lamination of the top ITO film is conducted after the solidification of the PDLC layer with the UV exposure, a constant gap between the two film substrates is also more easily achieved, which is essential to maintain uniform electric fields and electro-optical behavior over large areas.

    Printing methods such as rod-coating [18, 19], blade coating [20, 21], and curtain coating [22], allow PDLC layers to be coated cost-effectively over large areas in a roll-to-roll fashion [23, 24]. However, it is rather difficult to obtain uniform electro-optic properties over large areas due to the flexibility of the plastic substrates and the high pressure used during the lamination of the top film [25, 26]. To solve these problems, a method – coating a mixture of LC/pre-polymer and spacers, laminating a top film, and preparing the PDLC by UV-induced phase separation – has been proposed that provides a uniform cell gap between the two plastic films after lamination [27]. However, the dispersed spacers affect the LC droplet distribution during phase separation leading to positionally nonuniform light scattering properties [27-28]. Under bending stress, the dispersed spacers can also lead to scratch defects on the ITO surface [28]. Because the PDLC layer solidifies after UV-induced phase separation due to the UV-cured polymer matrix, the top ITO film can be laminated last, after the PDLC layer has been formed on the bottom ITO film. In this case, uniform PDLC layers are readily obtained but the adhesion between the PDLC layer and the top ITO film is poor, leading to detachment defects under bending stress [29].

    To obtain both uniform light transmittance and stable adhesion for the PDLC layer, we propose two steps of UV irradiation during PDLC fabrication. After coating the LC/prepolymer mixture onto the bottom ITO film, the first UV curing process is used to induce phase separation and form the PDLC layer. The solidified PDLC provides a layer with constant thickness and maintains a uniform gap between the ITO films during lamination. Furthermore, controlling the direction and dose of the UV irradiation ensures that UV-induced cross-linkable groups remain on the surface of the photo-polymerized layers thereby stabilizing the adhesion of the laminated films. Similarly for the top layer, the adhesion enhancement layer is coated with the UV curable resin and solidified by the controlled first step of the UV irradiation. After lamination, the second UV irradiation step improves the adhesion between the solidified PDLC layer and the laminated ITO film. Meyer rod coating was used to print the LC/prepolymer mixture and adhesion enhancement layers and control their thickness [30]. Peel-off experiments were used to test the adhesion strength of the laminated PDLC films as a function of the first step of UV irradiation conditions, and the effects of bending were also investigated [31, 32]. The uniformity of the gap between the ITO films, as maintained by the UV-solidified adhesion-enhancement and PDLC layers, was analyzed by measuring the uniformity of light transmittance across the samples under different applied voltages.

    II. FABRICATION PROCEDURES AND EXPERIMENTAL CONDITIONS

    Figure 1 shows a schematic diagram of the proposed fabrication process whereby a two-step UV exposure provides uniform voltage-dependent positional light transmittance and stable adhesion between the PDLC layer and the plastic substrates in the laminated films. The LC/prepolymer mixture was composed of a nematic LC (E7, Merck Advanced Technologies Ltd.) and a UV curable prepolymer (NOA65, Norland Products Inc.) in a weight ratio of 5:5 under the temperature condition of 110℃. To increase the phase separation and the UV curing rates, 2 wt% photoinitiator (Irgacure651, Ciba Specialty Chemicals) was added to the LC/prepolymer mixture. The refractive indexes of the E7 LC are no=1.5217 and ne=1.7472. The refractive index of NOA65 is np=1.524, which matches the no of LC. NOA65 is a thiol-ene-based UV curable composite containing trifunctional thiol and a tetrafunctional urethane allyl ether (the ene) [33]. LC droplets are reportedly more uniform in PDLC layers prepared using thiol-ene-based UV curable resins rather than acrylate-based UV curable prepolymers [33]. The maximum absorption wavelength of NOA65 for the polymerization of free radicals is 330 nm.

    The substrates, ITO-coated polyethylene terephthalate (PET) films, were cut into 16 cm × 10 cm pieces for all the experimental samples. The LC/NOA65/photoinitiator mixture was coated on the bottom ITO film using a Meyer rod, as shown in Fig. 1. The top ITO film was also covered using a Meyer rod, with the NOA65 as the adhesion enhancement layer. Meyer rod coating is carried out in direct contact with the substrate and the thickness after leveling of the coated surface is readily controlled by varying the periodicity (P) and/or height (H) of the wound wires [30]. The conditions used in our experiments are presented in the Table inset in Fig. 1 (in the top right corner). The diameter and length of the center bar were 10 mm and 250 mm, respectively. The rod was moved at 2 cm/s during coating. After leveling, the adhesion enhancement layer and the LC/NOA65/photoinitiator mixture layer coated respectively on the top and bottom ITO films were about 1 µm and 25 μm thick, respectively.

    Before lamination, the LC/NOA65/photoinitiator mixture layer was exposed to UV irradiation (the first irradiation step) to induce a phase separation between the LC droplets and the polymerized matrix and to transform the gel into a solid PDLC layer. The adhesion enhancement layer coated on the top ITO film was similarly solidified. As shown in Fig. 1 (the central diagrams), a controlled UV dose was directed at the side of the plastic film substrates to limit the UV-induced polymerization of the free radicals on the surfaces of the PDLC and adhesion enhancement layers. The samples were irradiated with a metal halide UV lamp (Lichtzen Co., Ltd., spectral range: 260-420 nm, intensity: 20 mW/cm2). The PDLC droplet size depends on the UV intensity rather than the irradiation time. The irradiation time can thus be used to stabilize adhesion without affecting the PDLC morphology once a solidified PDLC layer has been obtained. Because the LC/NOA65/photoinitiator layer is thicker than the adhesion enhancement layer, the bottom film was irradiated for longer than the top one, but both exposures were sufficiently lengthy to solidify the respective layers. The two UV irradiation times for the first UV irradiation step, ttop and tbottom, were optimized independently to achieve both uniform positional light transmittance and improved adhesion.

    After the first UV irradiation step, the top film was laminated onto the bottom one as shown in the lower part of Fig. 1. The laminating pressure was about 147 N/m. An insufficiently solid PDLC layer does not maintain a uniform cell gap or LC droplet distribution under the lamination pressure. A second stage of UV exposure was used to cross-link the UV-curable free radicals on the PDLC and adhesion enhancement layers in the laminated PDLC films, thereby stabilizing their adhesion. The same UV intensity was used as in the first step (20 mW/cm2) and all samples were irradiated for 150 s.

    III. RESULT AND DISCUSSION

    Figure 2 shows a schematic diagram of the peel-off test used to measure the adhesion strength of laminated PDLC films prepared under the different first UV irradiation conditions (ttop and tbottom). The upward peel-off force applied on one side of the laminated PDLC film, (Fadhesion), at which the laminated top film begins to detach from the bottom film was recorded. The adhesion strength, fadhesion (N/m) (or the peel-off strength) was then obtained by dividing Fadhesion by the attached width (L) of the PDLC film. In our experiment, the attached width was L = 10 cm.

    Figure 3 shows the adhesion strengths measured in this way for the laminated PDLC films as a function of the exposure times during the first UV irradiation step, ttop and tbottom. The adhesion weakens markedly for tbottom and ttop longer than 30 s and 10 s, respectively. This emphasizes that prolonged irradiation removes too many UV-curable free radicals from the surfaces of the PDLC and adhesion enhancement layers thereby degrading the subsequent adhesion between the two layers. The critical duration is shorter for ttop than for tbottom because the adhesion enhancement layer coated on the top film is thinner than the PDLC layer coated on the bottom one. When ttop is over 50 s, fadhesion is similar for all samples regardless of tbottom, which means that the UV-curable free radicals on the adhesion enhancement layer have almost all been eliminated. Figure 3 also shows that the presence of UV-curable free radicals after the first UV irradiation is essential on both the PDLC layer and the adhesion enhancement layer to ensure stable adhesion at the lamination interface after the second UV irradiation.

    Based on the peel-off test results, the positional uniformity of the light transmittance was compared for three PDLC films prepared as follows. Sample I was fabricated conventionally, i.e. without the first UV irradiation step (ttop = 0 s and tbottom = 0 s) before lamination. Sample II was treated under the optimized pre-lamination UV-irradiation conditions, ttop = 10 s and tbottom = 30 s. Sample III was over-exposed, with ttop = 40 s and tbottom = 150 s, conditions under which too few UV-curable free radicals remain to provide sufficiently strong adhesion following the second UV treatment. Sample III highlights the effects of the other conventionally used approach. In all the samples, the spacers to maintain the gap between the ITO films were not mixed with the LC/prepolymer mixture. The adhesion strengths of the three samples are listed in Table 1, along with the corresponding UV treatment parameters. The adhesion strength of Sample II is comparable to that of Sample I. The adhesion strength of Sample II is much greater than that of Sample III.

    [TABLE 1.] Duration of the UV irradiation applied to the top and bottom substrates (ttop and tbottom) of Samples I, II, and III during the first UV curing process shown in Figure 1, and their resulting adhesion strengths (fadhesion) as measured using the peel-off test shown in Fig. 2

    label

    Duration of the UV irradiation applied to the top and bottom substrates (ttop and tbottom) of Samples I, II, and III during the first UV curing process shown in Figure 1, and their resulting adhesion strengths (fadhesion) as measured using the peel-off test shown in Fig. 2

    Figure 4 shows photographs of the three samples obtained in field-off (0 V) and field-on (135 V) states. To compare the optical transparencies and the uniformities of the three samples, the logo of our university (“KNU”) was printed on a black background under the PDLC films. For Sample III, the first UV treatment solidifies the PDLC and adhesion enhancement layers such that the optical transmittance across the film is uniform both in the opaque state (field off) and in the transparent state (field on), as shown in Fig. 4(g) and 4(h), respectively. A uniform gap between the ITO films, a uniform PDLC morphology, and a uniform PDLC thickness are all maintained under the high pressure applied during lamination. However, the adhesion in Sample III is too weak, as shown in Table 1. As shown in Fig. 4(c) and 4(d), Sample II, prepared using the optimized UV irradiation conditions, is also uniform in its optical transmittance due to sufficiently solidified PDLC and adhesion enhancement layers. Furthermore, uniform scattering and transmittance are maintained under bending, as shown respectively in Fig. 4(e) and 4(f). Note that a quantitative comparison of the bending stability of Samples II and III follows in Fig. 7. Figure 4(a) shows that certain regions of Sample I are not fully opaque in the scattering state, and with a voltage applied, some points remain opaque, as shown in Fig. 4(b). These effects are the result of nonuniformities in the cell gap and in the LC droplet distribution induced during the lamination process [34].

    Polarizing optical microscopy (POM) was used to observe the LC droplet distributions in the three samples, as shown in Fig. 5. The LC droplets in Samples II and III are uniformly distributed, with an average diameter of about 7 μm. However, different droplet distributions are observed in the POM images obtained from different points in Sample I (P1, P2, P3, and P4 as indicated in Fig. 4(a)). The average LC droplet size also varies. As the LC to prepolymer ratio in the initial mixture increases, so does the LC droplet size after phase separation [34]. This seems to be the case in Fig. 5(a). The LC droplets in Fig. 5(d) from Sample I resemble those in Fig. 5(e) and 5(f) for Samples II and III, respectively. However, the droplet density in Fig. 5(b) is lower, meaning that the LC to prepolymer ratio has been much reduced during lamination in this region. Finally, two clearly different types of LC droplets are observed in Fig. 5(c), obtained at P3. In Sample I therefore, the solidity of the LC/prepolymer mixture layer and the adhesion enhancement layer is insufficient for a uniform cell gap and LC droplet distribution to be maintained during lamination. In addition, the different droplet sizes reveal how the LC to prepolymer ratio varies across Sample I during lamination, probably as a result of re-mixing between the UV-curable monomers coated on the top ITO film and the LC/prepolymer mixture layer coated on the bottom one.

    To compare the positional light transmittance of each sample quantitatively, the voltage-dependent transmittance of the sample (16 cm × 10 cm) was measured in 84 × 64 sections using an imaging photometer (PM-1433, Artisan Technology Group). Figures 6(a) and 6(b) respectively show the average (Tavr) and the standard deviation (σ) of the light transmittance measured across the samples. In Fig. 6(a) for each applied voltage and each sample, the minimum (Tmin) and the maximum light transmittance (Tmax) are presented as Si(Tmin, Tmax), where i is the sample number.

    In all samples, the Tavr increases with the applied voltage as the effective refractive index of the LCs within the LC droplets approaches the refractive index of the polymer matrix. The average transmittances measured across Samples II and III are similar for all applied voltages, with little difference between Tmin and Tmax and small values of σ . However, the difference between Tmin and Tmax in Sample I is much larger and increases with the applied voltage. Furthermore, compared with Samples II and III, the nonuniform LC droplet distribution in Sample I results in relatively high transmittance in the field-off state and relatively low transmittance in the field-on state [35], indicating a degraded contrast ratio and switching ability. The σ of the light transmittance measured across Sample I initially increases with the applied voltage, possibly due to the nonuniformity of the cell gap and of the polymer density. Under relatively low voltages, variations in the electric field have a greater impact on LC reorientation and the effective refractive index of the LCs than at higher applied fields. This explains the initial increase in σ recorded for Sample I. However, as the field applied is increased, a greater number of the LC molecules in Sample I reorient along the field direction and σ of the light transmittance decreases. Up to 135 V however, at which Samples II and III become optically clear, the σ’s measured for Sample I remain much higher than those for the other two.

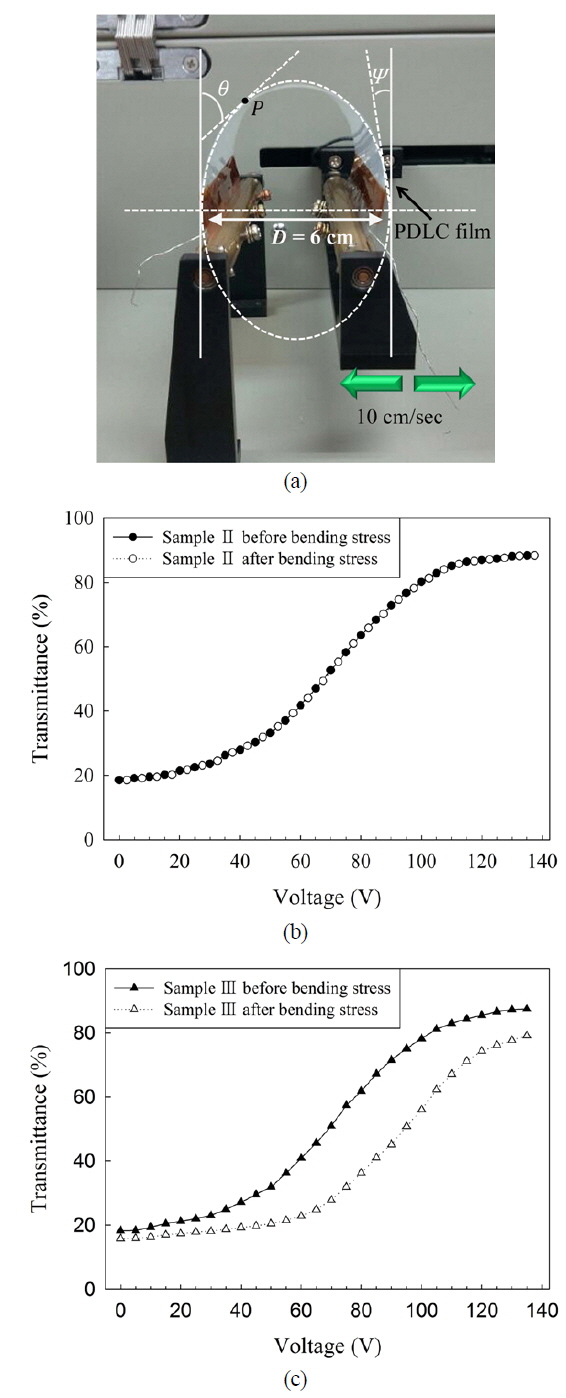
    The stability under bending of the two samples (II and III) showing uniform light transmittance was measured using a bending tester (ZBT-200, Z-Tech), as shown in Fig. 7(a). Bending stress was applied 1000 times on the laminated PDLC films using a step motor. The bar attached to one edge of the PDLC films was moved at 10 cm/s. The radius of curvature of the bending deformations may vary across the PDLC films [36], The bending stress applied to the PDLC films can be described as follows [37],

    image

    where σ bend is the bending stress, E is the Young’s modulus of the plastic film, and t is the film thickness. D is the distance between the film ends in the bent state, θ is the angle between the bent profile and the normal direction, and ψ is the contact angle of the film ends, as indicated in Fig. 7(a). Figure 7(b) and 7(c) show the voltagedependent transmittance curves measured for Samples II and III, respectively. No change is observed for Sample II after the bending test. However, the transmittance of Sample III is lower after bending over the whole applied voltage range.

    Figure 8 shows photographs of Samples II and III as a function of the applied voltage, taken after applying the bending stress. Sample II is unaffected by bending owing to stable adhesion (as shown in Table 1), and becomes uniformly more transparent as the applied voltage is increased. In the opaque state, the light scattering from Samples II and III is similarly uniform. Because the LC droplet distribution and the PDLC thickness remain uniform, there are no apparent differences in the opaque state after bending. However, the positional light transmittance of Sample III becomes nonuniform under an applied voltage. This shows that the PDLC film in Sample III becomes delaminated under bending. Delamination increases the gap between the ITO electrodes and weakens the electric field applied to the PDLC layer, resulting for Sample III in lower light transmittance (Fig. 7(c)) and regions of higher scattering (Fig. 8(e) and 8(f)). These delaminated regions, showing higher light scattering, form perpendicular to the bending direction, as expected from equation (1). Equation (1) shows that the stress along the bending direction is maximal in the middle of the film, where θ is closest to 90°. Therefore, the regions of higher light scattering induced by delamination defects form perpendicular to the bending direction.

    IV. CONCLUSION

    We have presented a two-step UV irradiation method to prepare laminated PDLC films. In the proposed method, a LC/prepolymer mixture and an adhesion enhancement layer are respectively coated onto the bottom and top ITO films. A first UV treatment is used to solidify these two layers, and to phase-separate the LC droplets in the PDLC layer on the bottom ITO film. Controlling the dose and direction of the UV irradiation allows the lamination conditions to be optimized between the PDLC and adhesion enhancement layers and ensures that a uniform layer thickness, LC to prepolymer ratio, and LC droplet distribution are all maintained. The UV-curable free radicals that remain on the laminated surfaces after this controlled UV irradiation provide strong adhesion and stability under bending after a second UV treatment, owing to enhanced cross-linking at the lamination interface. The fabrication method presented here stabilizes the adhesion and thereby the positional uniformity of the voltage-controlled light transmittance of PDLC devices laminated on flexible film substrates, and can readily be applied to print and laminate large-area PDLC films.

참고문헌
  • 1. Coates D. 1995 “Polymer-dispersed liquid crystals,” [J. Mater. Chem.] Vol.5 P.2063-2072 google cross ref
  • 2. Ren H., Wu S.-T. 2002 “Reflective reversed-mode polymer stabilized cholesteric texture light switches,” [J. Appl. Phys.] Vol.92 P.797-800 google cross ref
  • 3. McKenna L., Miller L. S., Peterson I. R. 2004 “Polymer dispersed liquid crystal films for modulating infra-red radiation,” [Polymer] Vol.45 P.6977-6984 google cross ref
  • 4. Mach P., Wiltzius P., Megens M., Weitz D. A., Lin K.-H., Lubensky T. C., Yodh A. G. 2002 “Switchable Bragg diffraction from liquid crystal in colloid-templated structures,” [Europhys. Lett.] Vol.58 P.679-685 google cross ref
  • 5. Mucha M. 2003 “Polymer as an important component of blends and composites with liquid crystals,” [Prog. Polym. Sci.] Vol.28 P.837-873 google cross ref
  • 6. Mormile P., Musto P., Petti L., Ragosta G., Villano P. 2000 “Electro-optical properties of a PDLC based on unsaturated polyester resin,” [Appl. Phys. B] Vol.70 P.249-252 google cross ref
  • 7. Korner W., Scheller H., Beck A., Fricke J. 1994 “PDLC films for control of light transmission,” [J. Phys. D: Appl. Phys.] Vol.27 P.2145-2151 google cross ref
  • 8. Doane J. W., Golemme A., West J. L., Whitehead J. B., Wu B.-G. 1988 “Polymer dispersed liquid crystals for display application,” [Mol. Cryst. Liq. Cryst.] Vol.165 P.511-532 google
  • 9. Drzaic P., Comiskey B., Albert J. D., Zhang L., Loxley A., Feeney R. 1998 “44.3: A printed and rollable bistable electronic display,” [Proc. SID Symp. Tech. Dig.] Vol.29 P.1131-1134 google
  • 10. Kim B. K., Jeon Y. C., Kim J. C. 1999 “Optimization of holographic PDLC for binary monomers,” [Mol. Cryst. Liq. Cryst.] Vol.326 P.319-331 google cross ref
  • 11. Cupelli D., Nicoletta F. P., Manfredi S., Vivacqua M., Formoso P., Filpo G. D., Chidichimo G. 2009 “Self-adjusting smart windows based on polymer-dispersed liquid crystals,” [Sol. Energ. Mat. Sol. C] Vol.93 P.2008-2012 google cross ref
  • 12. Roussel F., Buisine J.-M., Maschke U., Coqueret X. 1997 “Thermophysical and electro-optical characterization of nematic liquid crystal/acrylate systems,” [Mol. Cryst. Liq. Cryst.] Vol.299 P.321-328 google cross ref
  • 13. Lee K.-W. D., Chan P. K., Feng X. 2004 “Morphology development and characterization of the phase-separated structure resulting from the thermal-induced phase separation phenomenon in polymer solutions under a temperature gradient,” [Chem. Eng. Sci.] Vol.59 P.1491-1504 google cross ref
  • 14. Gill N., Pojman J. A., Willis J., Whitehead J. B. 2003 “Polymer-dispersed liquid crystal materials fabricated with frontal polymerization,” [J. Polym. Sci. A] Vol.41 P.204-212 google cross ref
  • 15. Kashima M., Cao H., Meng Q., Liu H., Wang D., Li F., Yang H. 2010 “The influence of crosslinking agents on the morphology and electro-optical performances of PDLC films,” [J. Appl. Polym. Sci.] Vol.117 P.3434-3440 google
  • 16. Bruyneel F., Smet H. D., Vanfleteren J., Calster A. V. 2001 “Cell gap optimization and alignment effects in reflective PDLC microdisplays,” [Liq. Cryst.] Vol.28 P.1245-1252 google cross ref
  • 17. Cairns D. R., Gorkhali S. P., Esmailzadeh S., Vedrine J., Crawford G. P. 2003 “Conformable displays based on polymer-dispersed liquid-crystal materials on flexible substrate,” [J. Soc. Inf. Display] Vol.11 P.289-295 google cross ref
  • 18. Khim D., Han H., Baeg K.-J., Kim J., Kwak S.-W., Kim D.-Y., Noh Y.-Y. 2013 “Simple bar-coating process for large-area, high-performance organic field-effect transistors and ambipolar complementary integrated circuits,” [Adv. Mater.] Vol.25 P.4302-4308 google cross ref
  • 19. Wang J., Liang M., Fang Y., Qiu T., Zhang J., Zhi L. 2012 “Rod-coating: Towards large-area fabrication of uniform reduced graphene oxide films for flexible touch screens,” [Adv. Mater.] Vol.24 P.2874-2878 google cross ref
  • 20. Chang Y.-F., Chiu Y.-C., Yeh H.-C., Chang H.-W., Chen C.-Y., Meng H.-F., Lin H.-W., Huang H.-L., Chao T.-C., Tseng M.-R., Zan H.-W., Horng S.-F. 2012 “Unmodified small-molecule organic light-emitting diodes by blade coating,” [Org. Electron.] Vol.13 P.2149-2155 google cross ref
  • 21. Hori M., Toki M. 2000 “Electro-optical properties of inorganic oxide/liquid crystal composite film by the sol-gel process,” [J. Sol-Gel Sci. Techn.] Vol.19 P.349-352 google cross ref
  • 22. Kistler S. F., Scriven L. E. 1984 “Coating flow theory by finite element and asymptotic analysis of the navier-stokes system,” [Int. J. Numer. Meth. Fl.] Vol.4 P.207-229 google cross ref
  • 23. Rogers J. A., Bao Z., Baldwin K., Dodabalapur A., Crone B., Raju V. R., Kuck V., Katz H., Amundson K., Ewing J., Drzaic P. 2001 “Paper-like electronic displays: Largearea rubber-stamped plastic sheets of electronics and microencapsulated electrophoretic inks,” [P. Natl. Acad. Sci.] Vol.98 P.4835-4840 google cross ref
  • 24. McCollugh G. T., Rankin C. M., Weiner M. L. 2005 “6.1: Roll-to-roll manufacturing considerations for flexible, cholesteric liquid crystal (ChLC) display media,” [Proc. SID Symp. Tech. Dig.] Vol.36 P.64-67 google
  • 25. Drzaic P. S. 1993 “Some factors influencing light scattering in PDLC films,” [Proc. SPIE] Vol.1911 P.153-159 google
  • 26. Hoppe C. E., Galante M. J., Oyanguren P. A., Williams R. J. J. 2004 “Optical properties of novel thermally switched PDLC films composed of a liquid crystal distributed in a thermoplastic/thermoset polymer blend,” [Mater. Sci. Eng.: C] Vol.24 P.591-594 google cross ref
  • 27. Jeng S.-C., Hsin L.-P., Sha Y.-A., Ding J.-M., Wang H.-L., Hung Y.-C., Liao C.-C. 2005 “Film-like liquid crystal displays,” [Jpn. J. Appl. Phys.] Vol.44 P.L159-L160 google cross ref
  • 28. Odahara S., Yamashita H., Momoi Y., Hasumi T., Koseki T., Shomitsu Y., Yamanaka H. 2001 “56.4: Post spacer technology for TFT/LCD [Proc. SID Symp. Tech. Dig.] Vol.32 P.1358-1361 google
  • 29. Choi M.-C., Kim Y., Ha C.-S. 2008 “Polymers for flexible displays: From material selection to device applications,” [Prog. Polym. Sci.] Vol.33 P.581-630 google cross ref
  • 30. MacLeod D. M., Marcel D. 1991 “Wire-wound rod coating,” google
  • 31. Kendall K. 1971 “The adhesion and surface energy of elastic solids,” [J. Phys. D: Appl. Phys.] Vol.4 P.1186-1195 google cross ref
  • 32. Lin Y.-R., Jeng S.-C., Hsin L.-P., Ding J.-M., Liao C.-C., Lien Y.-H., Shy J.-T. 2005 “Electro-optical performance of bending ultra-flexible film-like display,” [Proc. SID Symp. Tech. Dig.] Vol.36 P.1565-1567 google
  • 33. Yaroshchuk O., Elouali F., Maschke U. 2010 “Control of phase separation and morphology of thiol-ene based PDLCs by curing light intensity,” [Opt. Mater.] Vol.32 P.982-989 google cross ref
  • 34. Lin Y.-H., Ren H., Wu S.-T. 2004 “High contrast polymerdispersed liquid crystal in a 90° twisted cell,” [Appl. Phys. Lett.] Vol.84 P.4083-4085 google cross ref
  • 35. Gyselineck F., Maschke U., Traisnel A., Coqueret X. 2000 “PDLC films prepared by electron beam and ultraviolet curing: influence of curing conditions on the electro-optical properties,” [Liq. Cryst.] Vol.27 P.421-428 google cross ref
  • 36. Gulati S. T., Westbrook J., Carley S., Vepakomma H., Ono T. 2011 “45.2: Two point bending of thin glass substrate,” [Proc. SID Symp. Tech. Dig.] Vol.42 P.652-654 google
  • 37. Matthewson M. J., Kurkjian C. R., Gulati S. T. 1986 “Strength measurement of optical fibers by bending,” [J. Am. Ceram. Soc.] Vol.69 P.815-821 google cross ref
OAK XML 통계
이미지 / 테이블
  • [ FIG. 1. ]  Schematic diagrams of the two-step UV curing method used to fabricate PDLC films on plastic substrates by lamination with, from top to bottom, the Meyer rod-coating conditions, the first UV treatment of (left) the adhesion-enhancement layer on the top substrate and (right) the PDLC layer on the bottom substrate, and the lamination process and second UV treatment used to attach the two substrates by completing the polymerization of the UV-curable resin at the interface.
    Schematic diagrams of the two-step UV curing method used to fabricate PDLC films on plastic substrates by lamination with, from top to bottom, the Meyer rod-coating conditions, the first UV treatment of (left) the adhesion-enhancement layer on the top substrate and (right) the PDLC layer on the bottom substrate, and the lamination process and second UV treatment used to attach the two substrates by completing the polymerization of the UV-curable resin at the interface.
  • [ FIG. 2. ]  Schematic diagram of the peel-off test used to measure the adhesion strength of the laminated PDLC films.
    Schematic diagram of the peel-off test used to measure the adhesion strength of the laminated PDLC films.
  • [ FIG. 3. ]  Adhesion strengths of the laminated PDLC films as a function of the duration of the UV irradiation applied to the top and bottom films during the first UV treatment, as measured by the peel-off test shown in Fig. 2.
    Adhesion strengths of the laminated PDLC films as a function of the duration of the UV irradiation applied to the top and bottom films during the first UV treatment, as measured by the peel-off test shown in Fig. 2.
  • [ TABLE 1. ]  Duration of the UV irradiation applied to the top and bottom substrates (ttop and tbottom) of Samples I, II, and III during the first UV curing process shown in Figure 1, and their resulting adhesion strengths (fadhesion) as measured using the peel-off test shown in Fig. 2
    Duration of the UV irradiation applied to the top and bottom substrates (ttop and tbottom) of Samples I, II, and III during the first UV curing process shown in Figure 1, and their resulting adhesion strengths (fadhesion) as measured using the peel-off test shown in Fig. 2
  • [ FIG. 4. ]  Photographs of three different PDLC films (Samples I, II, and III; 16 cm × 10 cm) in the field-off and field-on states, placed above the logo of our university (“KNU”) to compare their uniformity and transparency. The UV irradiation conditions used to prepare the three PDLC films are listed in Table 1.
    Photographs of three different PDLC films (Samples I, II, and III; 16 cm × 10 cm) in the field-off and field-on states, placed above the logo of our university (“KNU”) to compare their uniformity and transparency. The UV irradiation conditions used to prepare the three PDLC films are listed in Table 1.
  • [ FIG. 7. ]  (a) Photograph of the experimental apparatus used for bending stability tests. For (b) Sample II and (c) Sample III, voltage-transmittance curves measured before and after applying the bending stress.
    (a) Photograph of the experimental apparatus used for bending stability tests. For (b) Sample II and (c) Sample III, voltage-transmittance curves measured before and after applying the bending stress.
  • [ FIG. 5. ]  Optical micrographs of three PDLC films (Samples I, II, and III) showing the distribution of the LC droplets in the polymer matrix. P1?P6 denote the positions at which measurements were taken, as shown in Fig. 4.
    Optical micrographs of three PDLC films (Samples I, II, and III) showing the distribution of the LC droplets in the polymer matrix. P1?P6 denote the positions at which measurements were taken, as shown in Fig. 4.
  • [ FIG. 6. ]  Average (Tavr) and (b) standard deviation (σ) of the light transmittance across Samples I, II, and III as a function of the applied voltage. The minimum and the maximum light transmittances measured in Sample i at each voltage are shown as Si(Tmin, Tmax).
    Average (Tavr) and (b) standard deviation (σ) of the light transmittance across Samples I, II, and III as a function of the applied voltage. The minimum and the maximum light transmittances measured in Sample i at each voltage are shown as Si(Tmin, Tmax).
  • [ ] 
  • [ FIG. 8. ]  Photographs of Samples II and III taken after the bending tests, at different applied voltages.
    Photographs of Samples II and III taken after the bending tests, at different applied voltages.
(우)06579 서울시 서초구 반포대로 201(반포동)
Tel. 02-537-6389 | Fax. 02-590-0571 | 문의 : oak2014@korea.kr
Copyright(c) National Library of Korea. All rights reserved.