The objectives of this research were to determine mean and maximum tolerance ranges of Carassius auratus (Ca) and Cyprinus carpio (Cc) populations on various physico-chemical parameters and ecological indicator metrics. Little is known about chemical tolerance ranges of the two species, even though these species are widely distributed species in aquatic ecosystems. Maximum tolerance ranges of Ca-population to total nitrogen (TN) and total phosphorus (TP) were 20.3 mg L-1 and 2.0 mg L-1, respectively. Optimal ranges of TN and TP in the Ca-population were 1.7-5.0 mg L-1 and 0.06-0.30 mg L-1, respectively. Such nutrient regimes of the Ca-population were evaluated as hypereutrophy, indicating high tolerance limits. The Cc-population had similar ecological characteristics to Ca-population, but the mean tolerance ranges of TN, TP, BOD, and COD were significantly (p < 0.05) greater than the Ca-population. Ecological patterns of trophic composition and tolerance guilds in the Ca-population were similar to those of the Cc-population. The model value of Index of Biological Integrity (IBI) of the habitat where C. auratus and C. carpio co-occurred averaged 15.0 ± 4.3 and 12.9±3.6, respectively. Based on the modified criteria of the United States Environmental Protection Agency (
In Korean streams and rivers, organic matter and nutrient pollution are nationwide problems, and are key issues in ecosystem health assessment and ecological management. This phenomenon is caused mainly due to rapid industrialization, urbanization, human population increase, and intensive farming (Limburg and Schmidt 1990, Ricciardi and Rasmussen 1999, Baer and Pringle 2000). Especially dredging, flow alteration, and channelization in the urban streams accelerated the degradation of physical habitat health (Paul and Meyer 2001, Allan 2004). Such anthropogenic disturbances influence biodiversity of various aquatic biota including fish, and disrupt food chains from the nutrient regime to top-carnivores in the lotic environment. For these reasons, the United States Environmental Protection Agency (Klemm et al. 1993) and the European Union (Didier et al. 1995, Oberdorff et al. 2002) developed an ecological health assessment system based on numerous multi-metric biological models and implemented the model for regional assessment. The fish models of the ecological multi-metric approach were originally based on the concept of “index of biological integrity” (IBI) to evaluate physical habitat, chemical, and biological conditions in lotic ecosystems (Karr 1981). This approach has been applied to streams and rivers of the U.S. (Karr et al. 1986), France (Oberdorff and Hughes 1992, Oberdorff et al. 2002) Australia (Harris 1995), India (Ganasan and Hughes 1998), Japan (Koizumi and Matsumiya 1997), and Korea (An et al. 2001, An et al. 2002, Choi et al. 2011, Lee and An 2014). One of the problems in the regional model applications, however, was the classification and class categorization of fish tolerance guilds and trophic guilds.
Fish are an ecological indicator to measure the chemical tolerance and assess habitat modifications in lotic ecosystems. The biological response or tolerance range differs depending on the magnitude of the pollution or ecological disturbances (United States Environmental Protection Agency 1988, Van Putten 1989). Especially, the presence or absence, and the abundance of regional fish fauna are frequently influenced by chemicals in the water. The tolerance based guild classification used in the biological integrity models is based only on fish dictionaries or experiences of fish ecologists or taxonomists. The classification of the tolerance guild into tolerant, intermediate or sensitive species (Klemm et al. 1993) is ambiguous, and an analysis based on quantitative data rather than simple field experiences is needed. In fact, the ecosystem health assessment model, which uses a metric of tolerance guild based on the subjective aspects and traditional experiences, were widely applied in national streams and rivers (Choi 1989, Kim 1997). The model values, thus, obtained from the multi-metric health assessments may be ambiguous in diagnosing the ecological health (Meador and Carlisle 2007). In spite of these facts, little is known about the tolerance ranges or magnitude of fish species in developed countries and Korea.
Each fish species has a set of optimal, sub-optimal, or lethal tolerance range in terms of temperature (thermal tolerance), physical habitat (habitat tolerance), water quality (chemical tolerance), and ecological relevance (ecological tolerance), and one or two factors in the tolerance level are critical to some fishes. Generally, physical hydrological factors such as water temperature (Beitinger et al. 2000), land use patterns (Wang et al. 2001), stream morphology (Wang et al. 2003), and flow regime (Bunn and Arthington 2002) are known to be important factors influencing the level of fish tolerance in aquatic ecosystems. Also, chemical parameters such as organic matter pollutant (Dyer et al. 2000), toxic chemicals (Brian et al. 2005), ionic content or salinity (Le François et al. 2004) or nutrients (N, P) are other key factors that control fish tolerance in the waterbodies of geographic regions. In addition, fish tolerance may also be associated with biological factors such as predation (Brown et al. 2005). The physical, hydrological and chemical preferences and needs for a certain type of stream condition greatly influence the regional distribution of fish species (Lee and An 2014). In real stream environments, multiple abiotic and biotic factors simultaneously influence any given fish species, which causes problems when quantifying the tolerance range of the fish.
The two target species,
>
Sampling methods and sampling gears
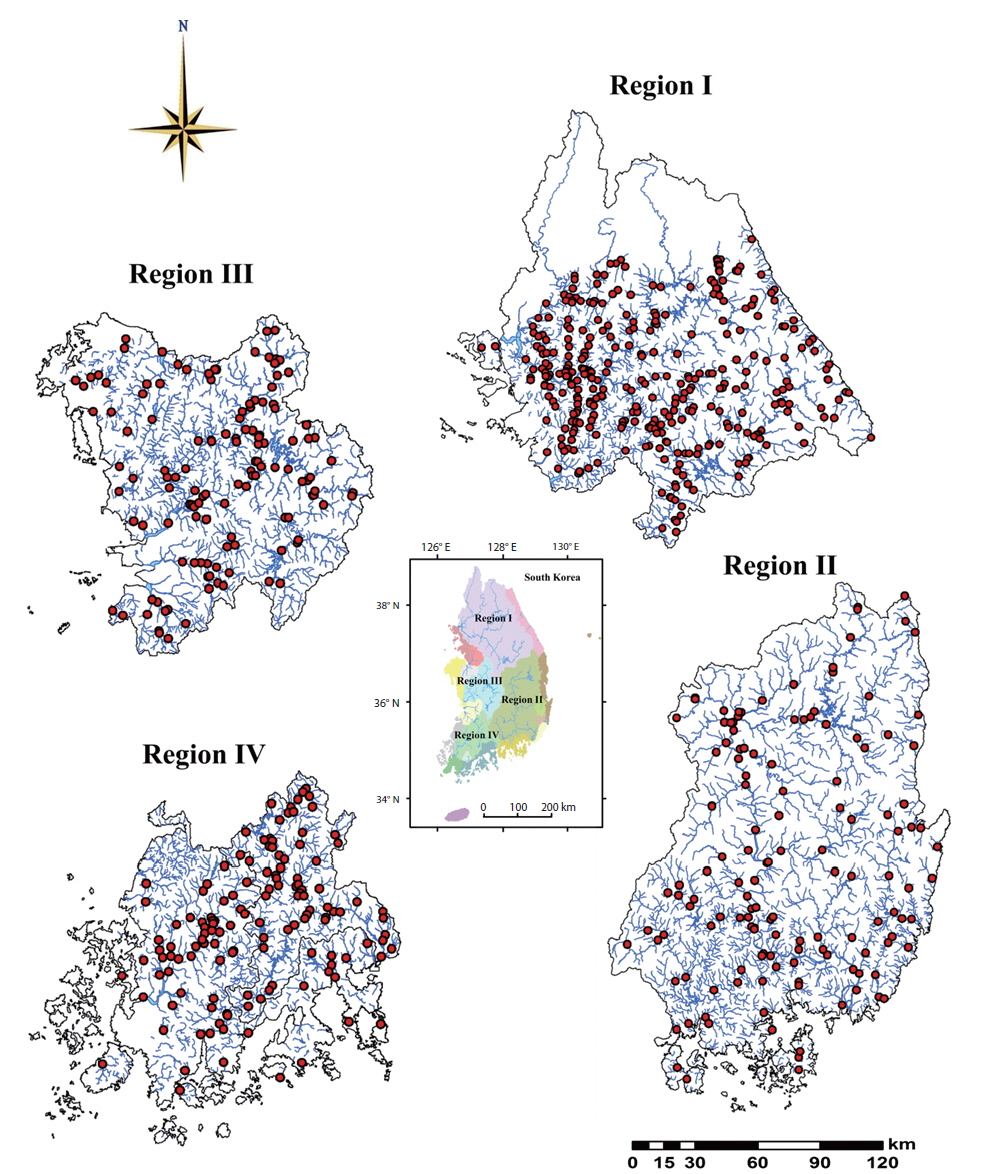
Fishes were collected by a modified wading method applied by An et al. (2006) based on the catch per unit effort (CPUE; Klemm et al. 1993). Fish sampling were conducted at 720 streams and rivers of the Han River watershed (river length (RL) = 514 km; basin area (BA) = 26,219 km2), the Nakdong River watershed (RL: 525 km, BA: 23,860 km2), Geum River watershed (RL: 414 km, BA: 9,886 km2), Yeongsan/Sumjin River watershed (RL: 348 km, BA: 8,267 km2) during 2008-2009 (Fig. 1). The time lapse for fish sampling was 60 minutes and all habitat types such as riffle, pool, and run area were included in 200m stream segments.
Sampled fishes were identified by using an IBI-approach developed by An et al. (2006) and returned to their natural habitats. Some ambiguous specimens were preserved in 10% formalin to identify the taxa in the laboratory. All fishes were examined for external anomalies of DELT, namely deformities (D), erosion (E: skin, barbells), patlesion (L: open sores, ulcerations), and tumors (T)on the basis of the criteria developed by Sanders et al. (1999). Casting nets (mesh 7 × 7 mm) and kick nets (4 × 4 mm), which are the most common sampling gears in Korea, were used for fish sampling. The casting net was used for open water fish habitats without any obstructions like riffles, pools, and slow runs, whereas, the kick net was used at places with fast currents and many obstructions where one could hardly use a casting net.
In addition to regular sampling, thirty-four reference sites were chosen from the watershed to calculate maximum species richness lines (MSRLs) against stream orders by following the approach of Hornig et al. (1995). Each reference stream number from the 1st to 5th order streams in the survey of reference sites were 3, 4, 3, 11, and 13, respectively. A 1:15,000 map was used to select candidate reference locations and determine stream order based on the methodology of Strahler (1957). The MSRL was determined by empirical methods developed by Karr (1981) and 1st order regression analysis developed by Rankin and Yoder (1999).
A total of eight parameters that include biological oxygen demand (BOD), chemical oxygen demand (COD), total nitrogen (TN), nitrate-nitrogen (NO3-N), total phosphorus (TP), phosphate-phosphorous (PO4-P), suspended solids (SS), and electric conductivity were analyzed in this study. We analyzed monthly datasets that were obtained from the Ministry of Environment, Korea (MEK) from January 2008 to December 2009. The criteria of physico-chemical water quality were based on a 7-rank system set by the Ministry of Environment, Korea.
>
Stream ecosystem health model
Fish samples were first analyzed according to the Index of Biological Integrity (IBI) developed by Karr (1981) and Barbour et al. (1999) and run through an ecological health assessment model. The samples were collected from four major watersheds of the Han River, Nakdong River, Geum River, and Yeongsan/Sumjin River during 2008-2009. The metrics (M) reflected three major ecological characteristics: species richness and composition, trophic composition, and fish abundance and health condition. The three groups each consisted of eight metrics: M1, total number of native species; M2, number of riffle-benthic species; M3, number of sensitive species; M4, proportion of individuals as tolerant species; M5, proportion of individuals as omnivores; M6, proportion of individuals as native insectivores; M7, total number of individual native species; and M8, proportion of abnormal individuals. The four metrics (M1, M2, M3, and M7) were evaluated using the maximum species richness line (MSRL) with stream orders. Each metric was given 1, 3, or 5 points respectively. The points were then summed up to determine 4 class criteria that ranged from excellent (A: 40-36), good (B: 35-26), fair (C: 25-16), and very poor (D: ≤ 15). Detailed descriptions with specific characteristics and scoring criteria of the model have been previously reported by An et al. (2006).
Habitat assessments were modified according to the Qualitative Habitat Evaluation Index (QHEI) described by Plafkin et al. (1989). Six habitat parameters chosen from widely used references (Hamilton and Bergersen 1984, Lafferty 1987, Bartholow 1989), were used for assessing QHEI: epifaunal substrate/available cover (Q1), embeddedness (Q2), channel flow status (Q3), dam construction impact (Q4), channel alteration (Q5), and sediment deposition (Q6). Each of the assessed habitat attributes was summarized and divided into 4 categories: “optimal (20, 18, 16),” “sub-optimal (15, 13, 11),” “marginal (10, 8, 6),” and “poor (5, 3, 1).”
SPSS ver. 18.0 (SPSS Inc., Chicago, IL, USA) was used to test significant differences between Ca-population (n = 479) and Cc-population (n = 145) by using datasets from four major rivers and streams. Two independent sample
>
Impact of stream morphology and land use patterns on Ca-population and Cc-populations
An analysis of stream morphology and land use patterns were carried out at sites where Ca-population and Cc-populations were sampled (Table 1). Stream width, stream order, and altitude were used as key variables for stream morphology. Three categories were set up to differentiate land use patterns, namely urban land, agricultural land, and forestry. The Ca-population occurred in habitats with a mean stream width of 73.3m (range: 1-550), mean stream order of 3.35 (1-6), and mean altitude of 38.2m (0-359), while the Cc-population occurred in habitats with a mean stream width of 89.6m (range: 1.1-625), mean stream order of 3.48 (1-6), and mean altitude of 30.9m (0-175; Table 1). Two statistically independent sample
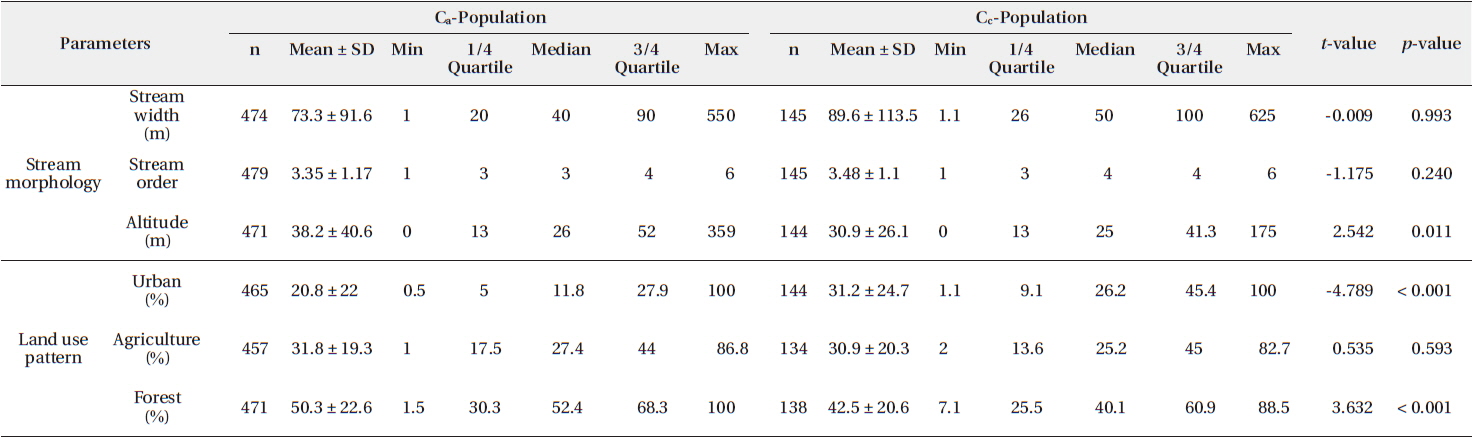
Means, range (maximum-minimum) and quartile (1/4 quartile, median and 3/4 quartile) on stream morphologic parameters and land use pattern in streams and rivers where Ca-population and Cc-population was sampled
Analysis of land use pattern showed that occurrence frequency of the Ca-population was 50.3% (1.5-100%) in the forestry region, 31.8% (1.0-86.8%) in the agricultural region, and 20.8% (0.5-100%) in the urban region. In the meantime, occurrence frequency of the Cc-population was 42.5% (7.1-88.5%) in the forestry region, 30.9% (2.0- 82.7%) in the agricultural region, and 31.2% (1.1-100%) in the urban region. Two statistically independent sample ttests on land use patterns between the two populations showed that there were significant differences (
Statistical tests in the Ca-population and Cc-population indicated that stream morphology agreed with land use patterns in both populations. Both Ca-population and Cc-populations had a significant probability of
>
Chemical tolerance of Cc-population and Ca-population for water quality
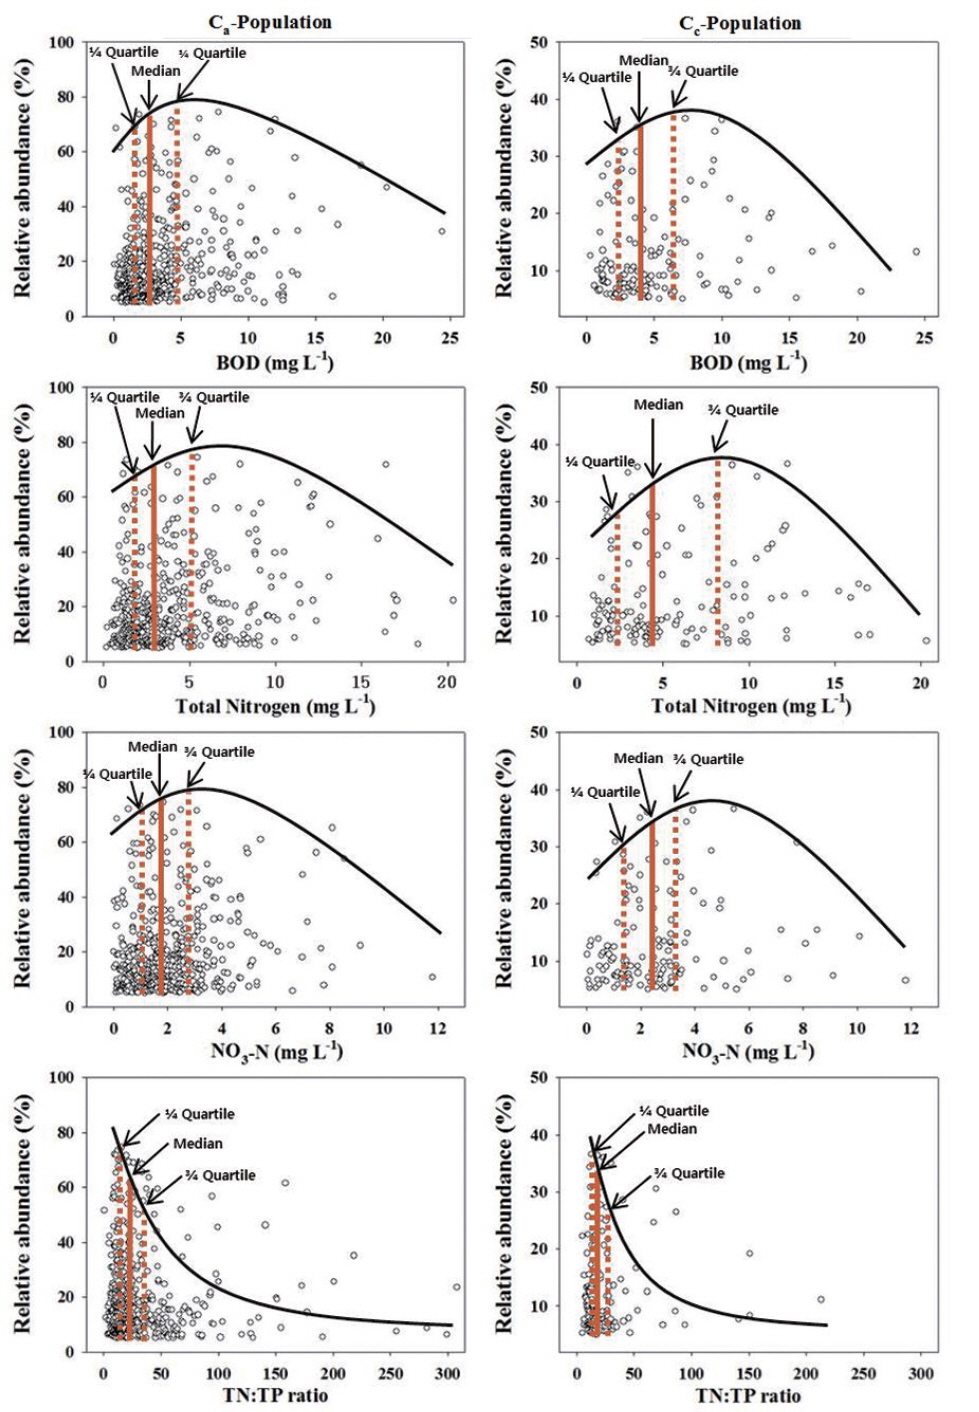
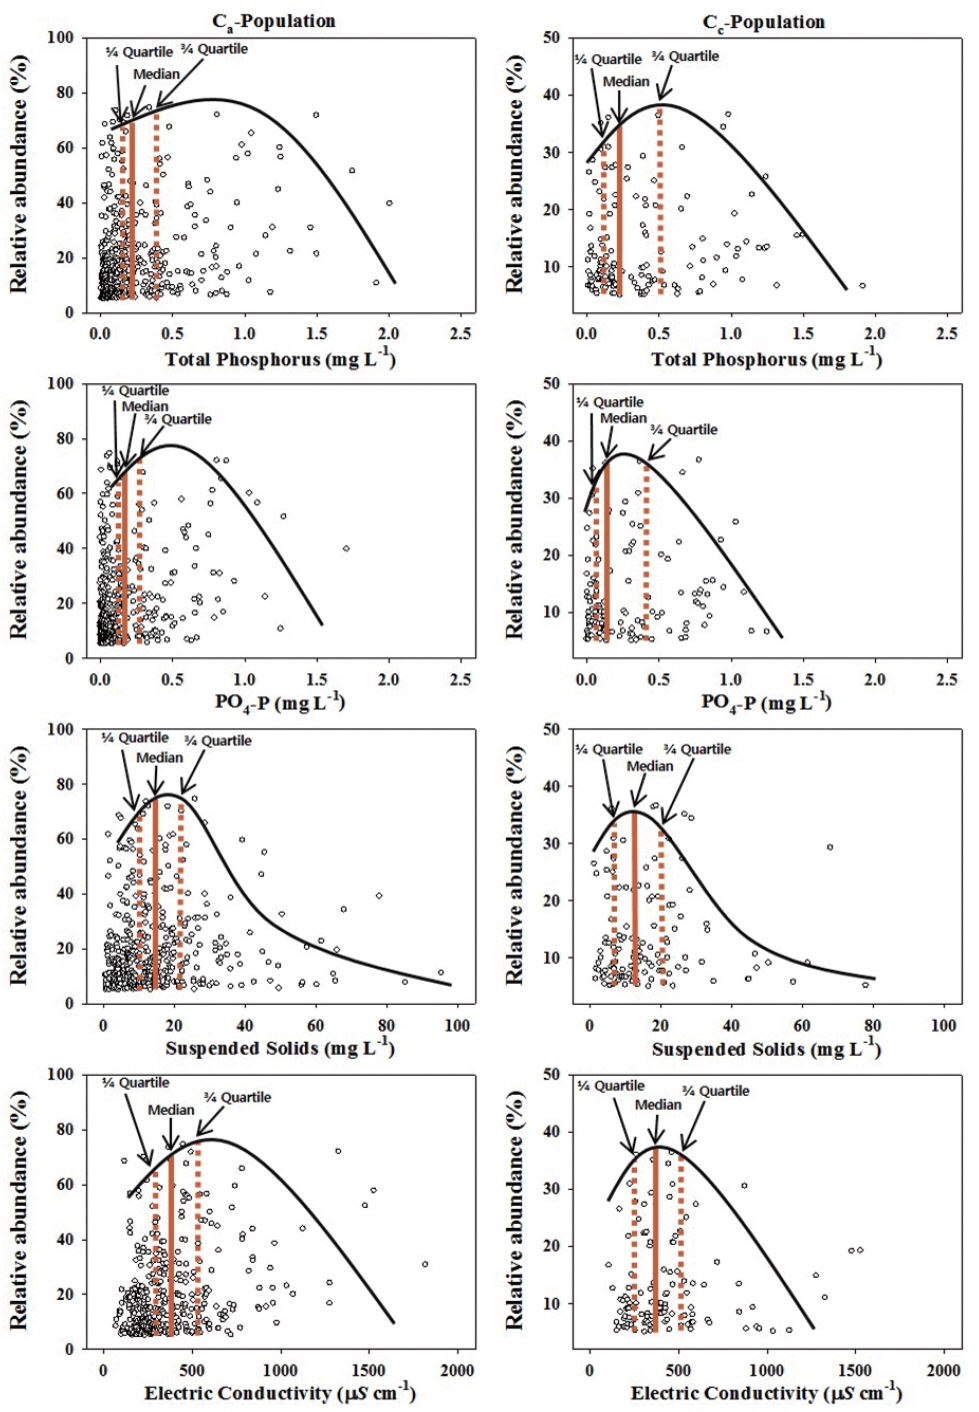
The chemical tolerance ranges of the Cc-population and Ca-population were determined after assessing water chemistry factors such as biological water quality (BOD), chemical oxygen demand (COD), total nitrogen (TN), nitrate-nitrogen (NO3-N), total phosphorus (TP), phosphate- phosphorus (PO4-P), total suspended solids (SS), and electric conductivity (Table 2; Figs. 2 and 3). Mean and maximum tolerance ranges for organic matters of BOD in the Ca-population were 3.71 mg L-1 and 24.4 mg L-1, respectively, and the tolerance values for COD were 7.14 mg L-1 and 27.3 mg L-1. Mean and maximum tolerance ranges for TP were 0.24 mg L-1 and 2 mg L-1 in the Ca-population, respectively. In the meantime, mean and maximum tolerance ranges for BOD in the Cc-population were 5.1 mg L-1 and 24.4 mg L-1, respectively, and the tolerance values for COD were 8.07 mg L-1 and 27 mg L-1. Mean and maximum tolerance ranges for TP were 0.39 mg L-1 and 1.9 mg L-1 in the Cc-population. Two statistically independent sample
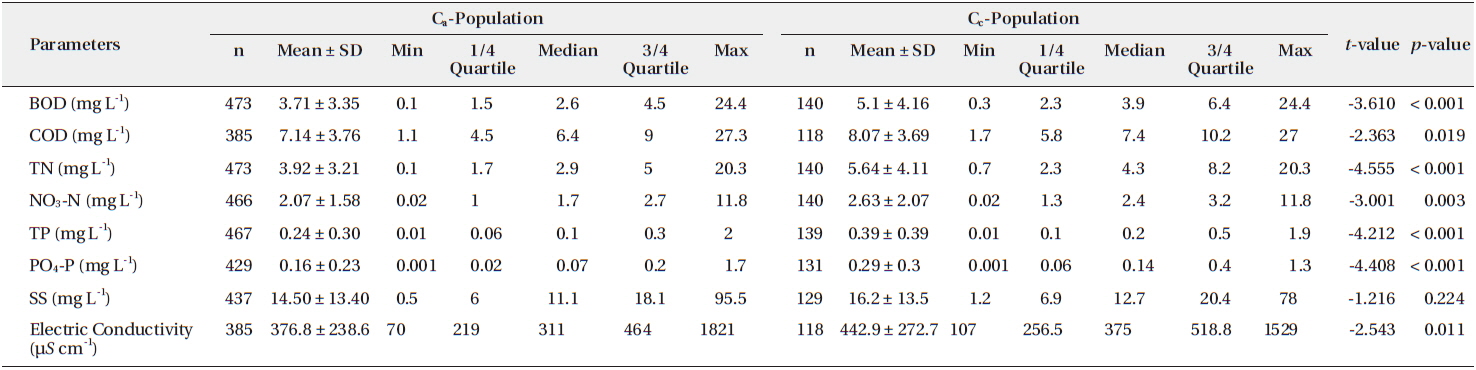
Means, range (maximum-minimum) and quartile (1/4 quartile, median and 3/4 quartile) on water quality in streams and rivers where Ca-population and Cc-population was sampled
In addition, optimal peak ranges for two fish populations were determined by using quartile analysis (Table 2, Figs. 2 and 3). As shown in Figs. 2 and 3, the tolerance range for chemical parameters were wide in both the Cc-population and Ca-population, and the mean values for BOD, COD, and TP fell in the high chemical concentrations, indicating that both the Cc-population and the Ca-population are tolerant fish species along the chemical gradients. The chemical ranges of one-fourth and threefourths, based on the quartile, were a major distribution of the fish populations, and were also compared with criteria of stream water quality according to the Ministry of Environment, Korea (2006). Major distribution of the Ca-population on BOD was 1.5-4.5 mg L-1, indicating that the stream chemical health, based on BOD, was judged as a little fair (III) to good health condition (Ib) according to the criteria of MEK (2006). Similarly, the major distribution range of the Ca-population on COD was 4.5-9 mg L-1 and the distribution range on TP was 0.06-0.3 mg L-1, indicating poor (IV) to good health (Ib) condition. Also, the Ca-population from 479 sampling sites were observed and 156 sites out of 479 sites turned out to be in very poor condition (BOD > 10 mg L-1; COD > 11 mg L-1; TP > 0.5 mg L-1), and unfit for the survival of the Ca-population. Also, the Ca-population was observed in the clean environment (Ia), indicating that the fish can distribute in pristine conditions, even though the Ca-population is widely known as a tolerant fish population (Kim and Park 2002, Lee and Noh 2006).
Major distribution of the Cc-population on BOD was 2.3-6.4 mg L-1, indicating that the stream chemical health, based on BOD, was judged as poor (IV) to somewhat good health condition (II) according to the criteria of MEK (2006). Similarly, the major distribution range of the Cc-population on COD was 5.8-10.2 mg L-1, and the distribution range on TP was 0.1-0.5 mg L-1, indicating a poor (V) to somewhat good health (II) condition. Also, the Cc-population from 145 sampling sites were observed and 53 sites out of 367 sites turned out to be in very poor condition (VI), unfit for survival of the Cc-population. Only 9% (13 of 145 sampling sites) of the Cc-population was observed in a clean environment (Ia), indicating that Cc-population was generally distributed in fairly poor quality water than in clean environments.
All analysis of the chemical tolerance range indicated that both fish populations had wide range of tolerance in major chemical parameters. However, the Ca-population was distributed in both polluted regions and clean regions, while the Cc-population was distributed more widely in severely polluted regions than the clean regions. These results suggest that the Cc-population has adapted more to the polluted region than the Ca-population, and that
>
Statistical tests of two populations in relation to the water quality variables
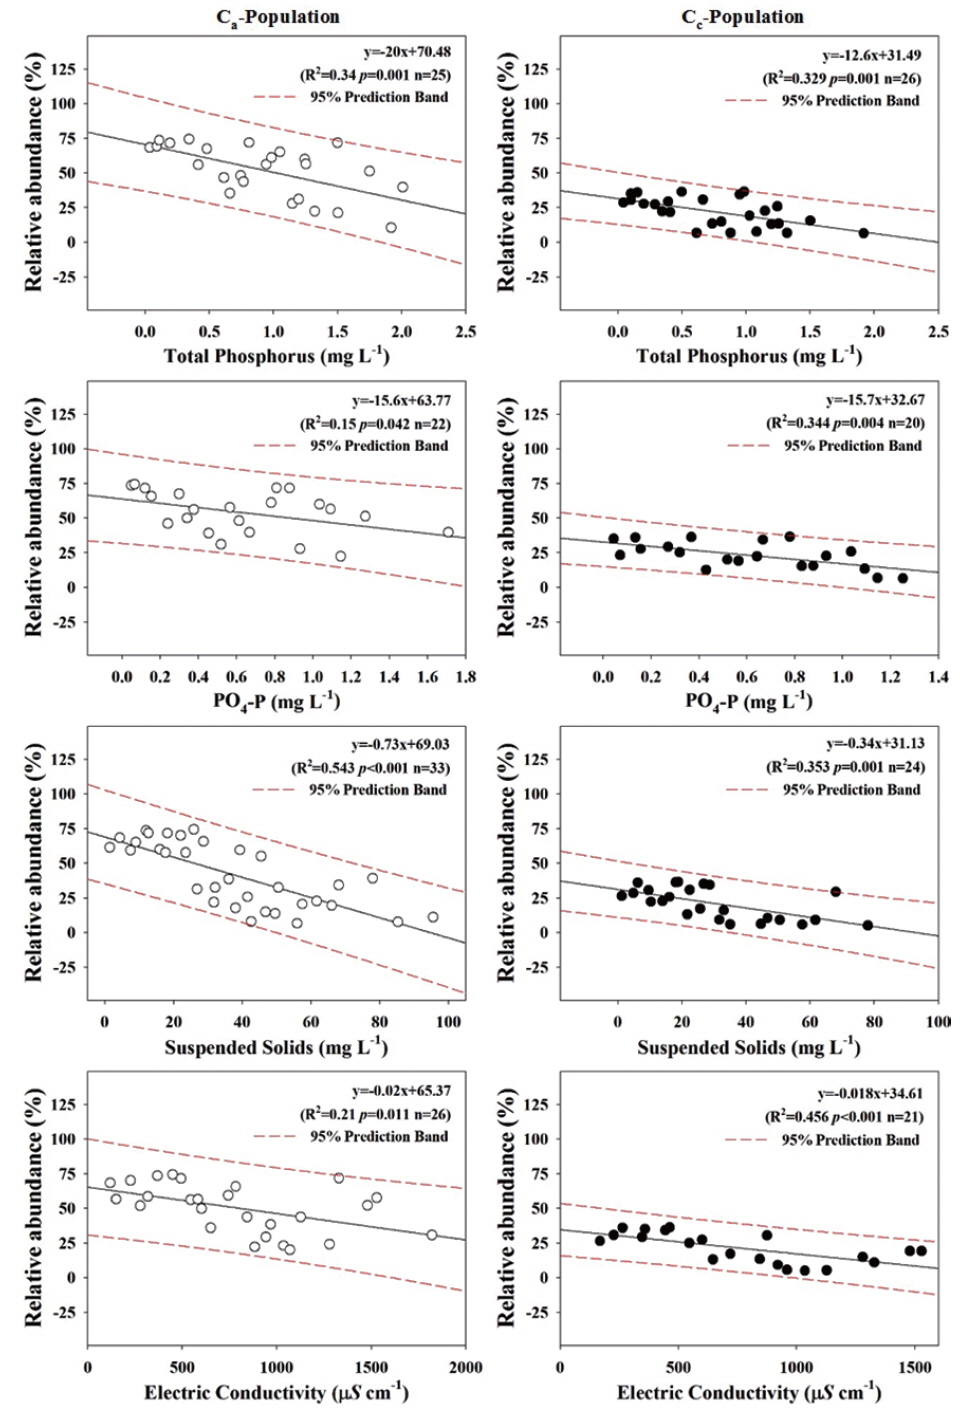
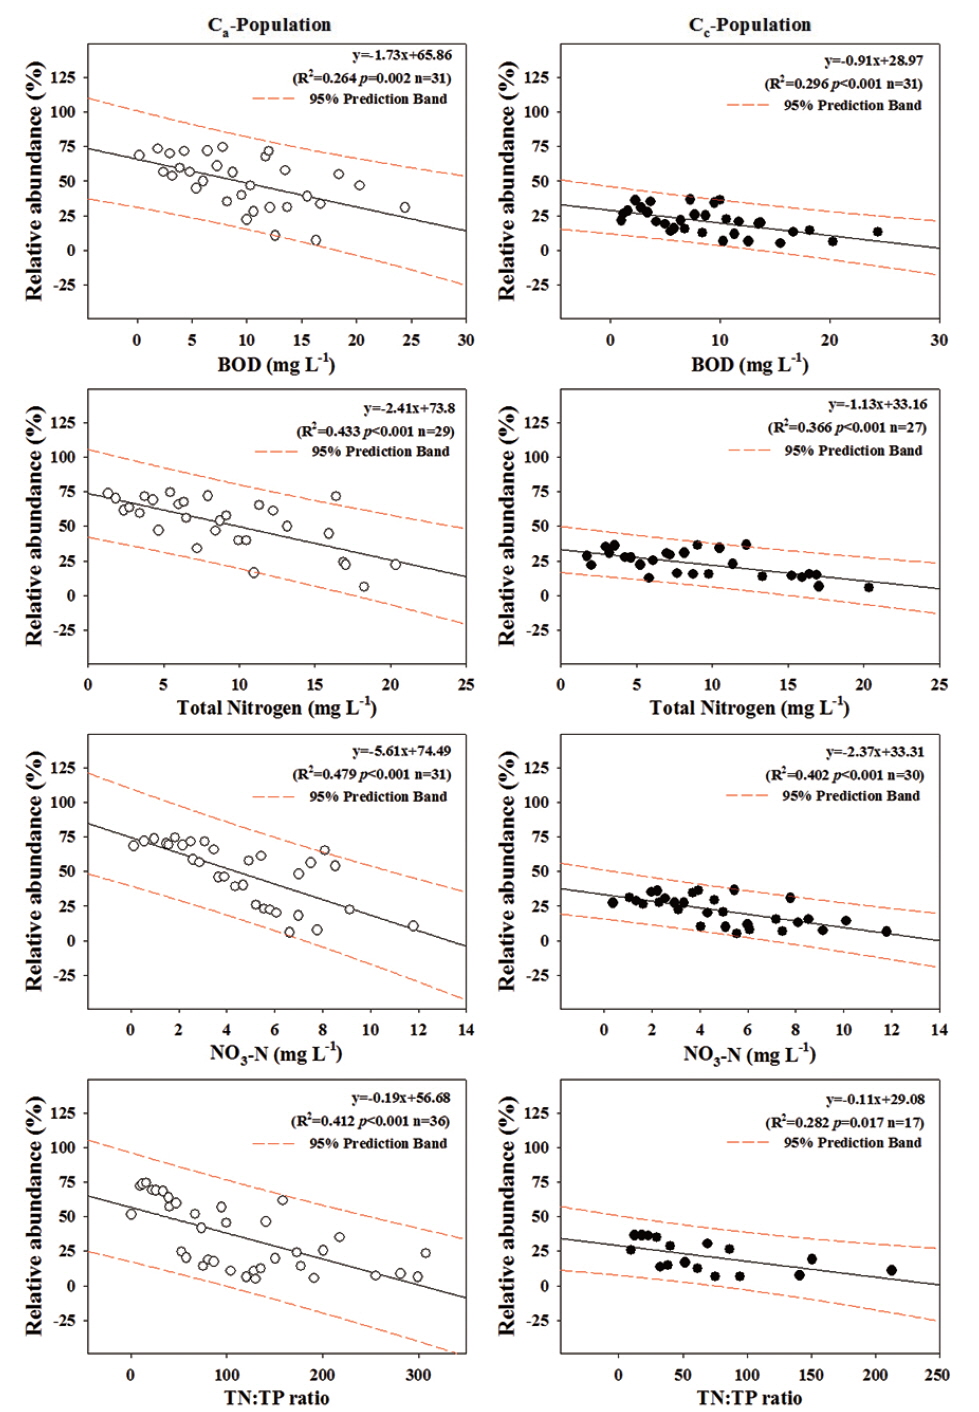
Regression analysis on relative abundance of the Ca-population and the Cc-population to the water chemical parameters are shown in Figs. 4 and 5. The data analysis was conducted by dividing the intervals of water quality data uniformly. The maximum relative abundance (Max Ra) values of the fish population were obtained from the intervals of water quality (Figs. 4 and 5). These two populations were statistically significant in all water chemical parameters in the level of
>
Trophic / tolerance preference tests of two populations in the co-occurring fish
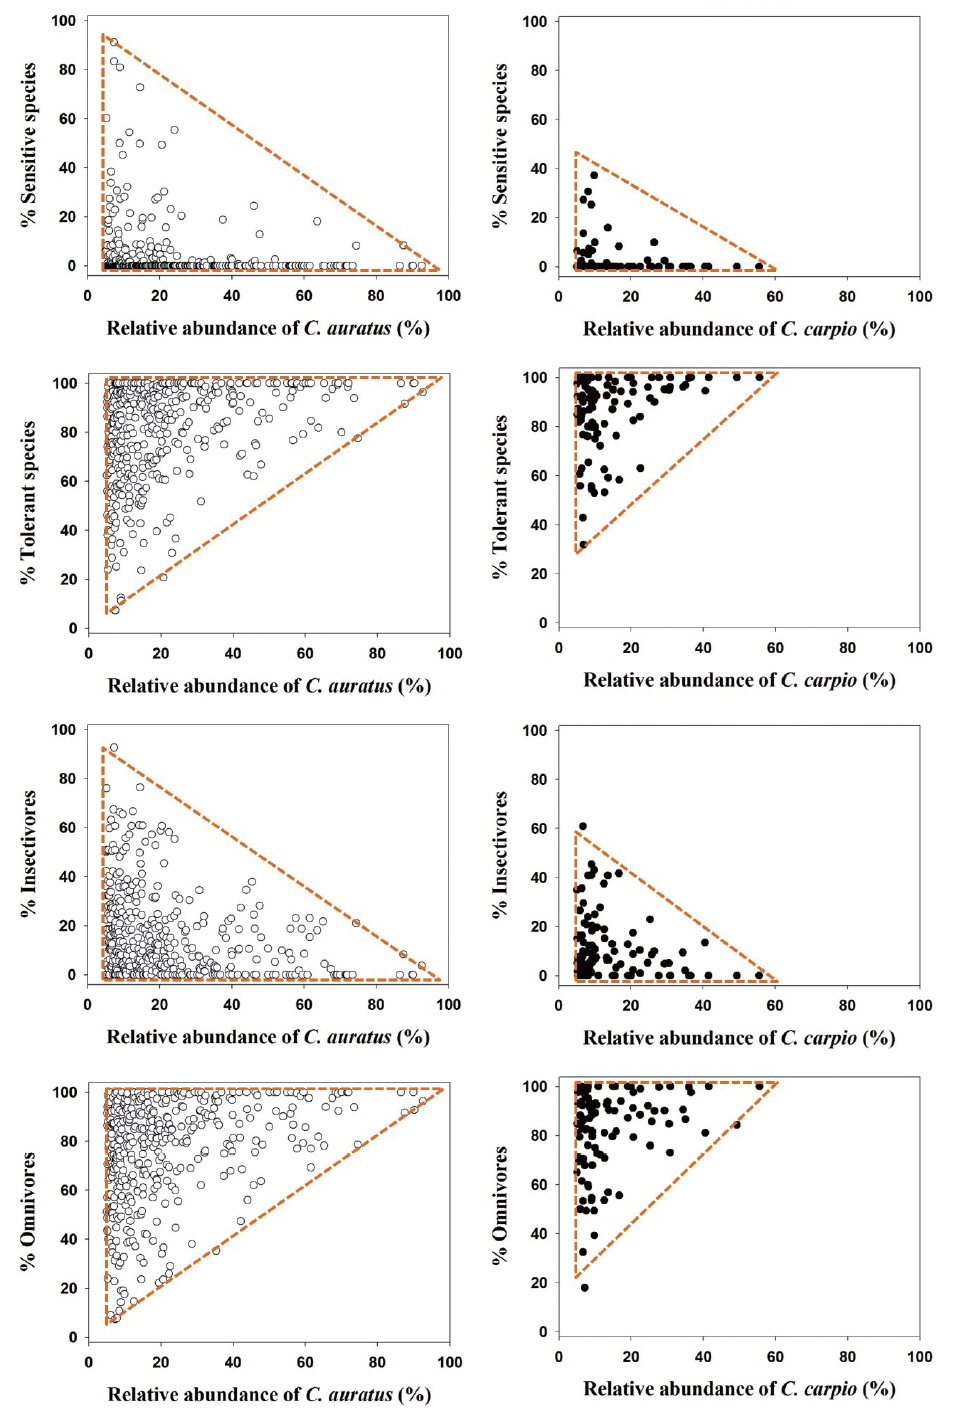
Trophic preferences of two fish populations were analyzed by comparing insectivore and omnivore species, and also, tolerance preferences were analyzed by studying sensitive and tolerant species (Fig. 6). Barbour et al. (1999) pointed out that trophic guild and tolerance guild of fish are closely associated with water chemistry parameters such as organic matter and nutrient (N, P) pollution. Previous research on biological integrity of fish showed that omnivore species and tolerant species are frequently observed in the polluted regions, while insectivore species and sensitive species are frequently observed in the clean riffle regions (An et al. 2001, An et al. 2006, Choi et al. 2011, Lee and An 2014). These attributes of the fish compositions are usually used for classification of fish guilds (Karr 1981, Klemm et al. 1993). As shown in Fig. 6, the relative abundance of the Ca-population decreased with the percentage of insectivore and percentage of sensitive species and increased with the percentage of omnivores and the percentage of tolerant species. The relative abundance of the Cc-population also decreased with the percentage of insectivore and percentage of sensitive species and increased with the percentage of omnivores and percentage of tolerant species, even when the distribution range of the Ca-population was wider than the Cc-population (Fig. 6).
>
Ecological indicator analysis of Ca-population and Cc-population
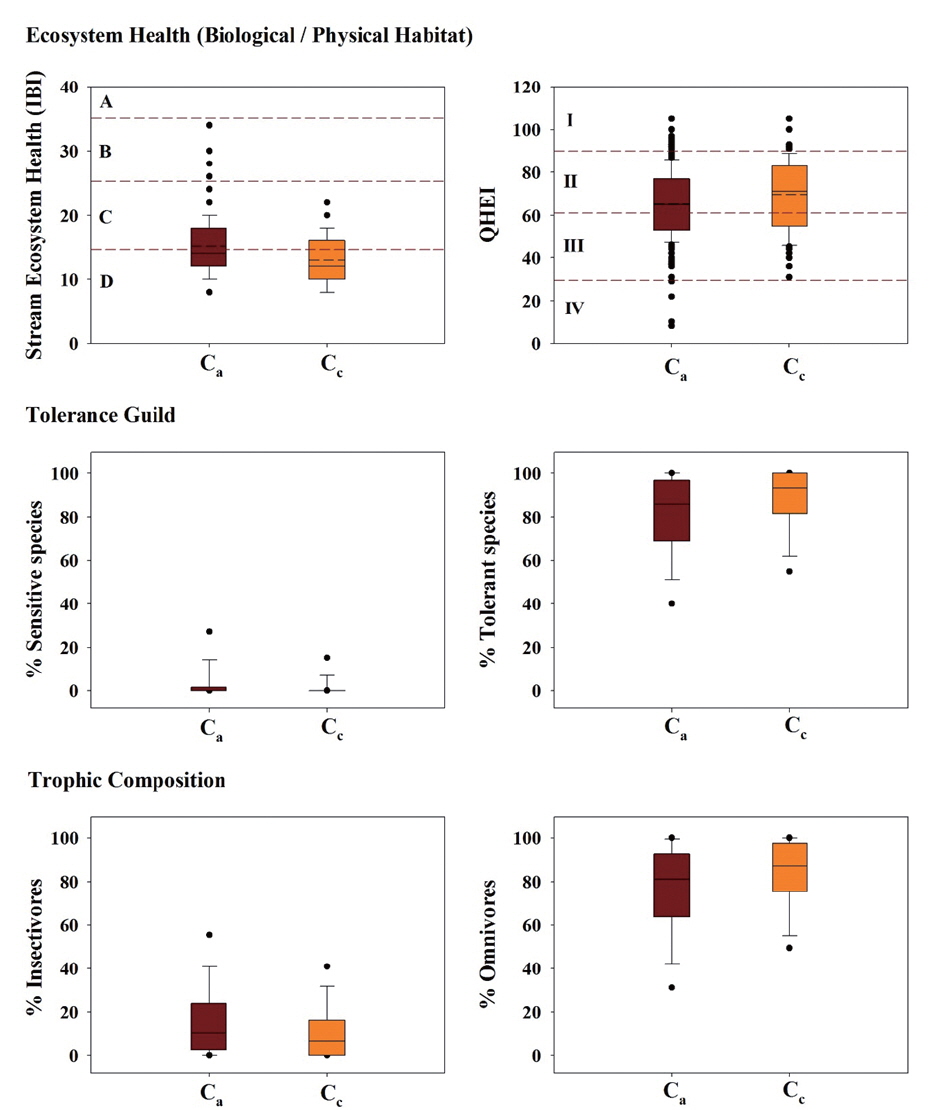
According to the analysis of ecological indicators co-occurring in the two populations (Fig. 7), the relative abundance of tolerant species co-occurring with the Ca-population and Cc-population was 80.2% and 89.1%, respectively. In contrast, the relative abundance of sensitive species that co-occurred with the Ca-population and Cc-population was only 4.5% and 1.7%, respectively (Fig. 7). Numerous studies of tolerance guild metric (Karr 1981, Klemm et al. 1993, Barbour et al. 1999) showed that the tolerance guild of fish is closely associated with water chemistry parameters such as organic matter and nutrient (N, P) pollution. So, tolerant species tend to increase in polluted streams while sensitive species decrease in polluted streams.
Analysis of the trophic guild indicator co-occurring in the two populations showed that the relative abundance of omnivore and insectivore species that co-occurred with the Ca-population was 74.5% and 16.4%, respectively (Fig. 7). In contrast, the relative abundance of omnivore and insectivore species that co-occurred with the Cc-population was only 79.8% and 11.9%, respectively (Fig. 7). These outcomes suggest that omnivore species dominated the community in both fish populations and the magnitude of omnivore dominance was greater in the Cc-population than the Ca-population. Thus, based on the trophic indicator (omnivore, insectivore), biological tolerance was greater in the Cc-population than the Ca-population. Our results are supported by the fact that the predominance of omnivore species in the fish community is a typical example of water pollution (Klemm et al. 1993) and a good indicator for ecological disturbance in the stream environment (Shin et al. 2013). Both Ca-population and Cc-population groups were considered to be tolerant species in the stream regions with organic matter pollution.
>
Ecological health analysis in the distribution of Ca-population and Cc-population
The model value of the Index of Biological Integrity (IBI) in habitats co-occurring with
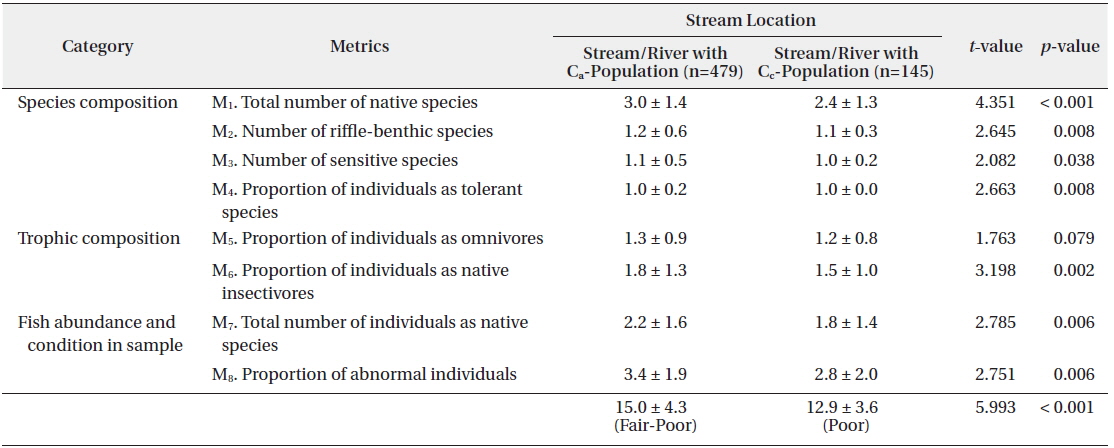
Comparison of fish community metrics according to Index of Biological Integrity (IBI) between streams and rivers with Ca-population and Cc-population
The largest difference (≥ 0.3) in the metric values between the Ca-population and the Cc-population was seen in metrics M6, M7, and M8. These metric values suggest that both species are categorized as highly tolerant species in the waterbodies, and the magnitude of tolerance (pollution) based on the multi-metric model, was greater in the Cc-population than the Ca-population. Statistically independent sample
>
Physical habitat health analysis of Ca-population and Cc-population
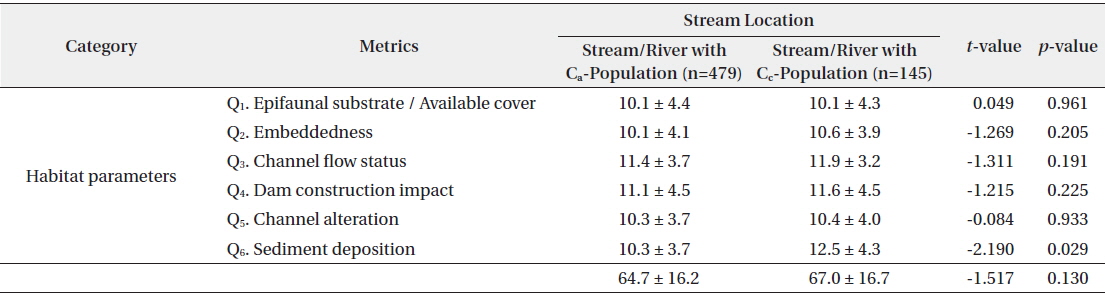
Qualitative Habitat Evaluation Index (QHEI) in the Ca-population and Cc-population were evaluated as shown in Table 4. The model value of QHEI co-occurring with

Comparison of habitat parameters according to Qualitative Habitat Evaluation Index (QHEI) between streams and rivers with Ca-population and Cc-population.
To determine differences in physical habitats between the two populations, statistical tests were conducted under the assumption of equal variance on all metrics. According to the results of habitat health, values of probability (
Tests on overall tolerance range showed that both the Ca-population and Cc-population can be classified as tolerant groups after the analysis of land use-pattern, stream morphology, chemical water quality, habitat parameters, and ecological indicators (trophic compositions and tolerance guilds) of co-occurring fish along with the multimetric ecological health model. The magnitude of the tolerance range, however, was greater in the Cc-population than the Ca-population, and this was evident in chemical variables such as organic matter pollutants (BOD, COD), nutrients (TP, TN), suspended solids, and ionic contents. In the past, all research just categorized these two species as tolerant species using empirical methods such as simple descriptions of fish habitat, chemical conditions and fish dictionaries. International or domestic references with quantitative analysis based on land use pattern, stream morphology, chemical water quality, habitat parameters, ecological indicators, and ecological integrity model values did not exist. This research provides a clearcut evaluation of tolerance ranges or guild classification of the Ca-population and Cc-population in relation to physical, chemical, and ecological indicators, which are closely associated with external tolerance in the aquatic environment.