A dramatic decline in the abundance of the scaled quail (Callipepla squamata) has been observed across most of its geographic range. In order to evaluate the influence of land cover patterns and their changes on scaled quail abundance, we examined landscape patterns and their changes from the 1970s to the1990s in two large ecoregions with contrasting population trends: (1) the Rolling Plains ecoregion with a significantly decreased scaled quail population and (2) the South Texas Plains ecoregion with a relatively stable scaled quail population. The National Land Cover Database (NLCD) and the U.S. Geological Survey’s (USGS) Land Use/Land Cover data were used to quantify landscape patterns and their changes based on 80 randomly located 20×20 km2 windows in each of the ecoregions. We found that landscapes in the Rolling Plains and the South Texas Plains were considerably different in composition and spatial characteristics related to scaled quail habitats. The landscapes in the South Texas Plains had significantly more shrubland and less grasslandherbaceous rangeland; and except for shrublands, they were more fragmented, with greater interspersion among land cover classes. Correlation analysis between the landscape metrics and the quail-abundance-survey data showed that shrublands appeared to be more important for scaled quail in the South Texas Plains, while grassland-herbaceous rangelands and pasture-croplands were essential to scaled quail habitats in the Rolling Plains. The decrease in the amount of grassland-herbaceous rangeland and spatial aggregation of pasture-croplands has likely contributed to the population decline of scaled quails in the Rolling Plains ecoregion.
The scaled quail (
It is unclear why the population of scaled quails is relatively steady in the South Texas Plains, but declining rapidly in the Rolling Plains. Many factors, including rangeland management practices such as brush control (Rollins 2000), the Conservation Reserve Program (CRP; Schemnitz 1993), precipitation patterns (Bridges et al. 2002), and disease (Rollins 2000) have been suggested to cause discrepancies in the decline of scaled quail populations in the two ecoregions. Rollins (2000) found that the number of scaled quails had periodically increased and decreased in the Rolling Plains. Changes in landscape patterns of scaled quail habitats were also suspected to be a major factor causing the long-term population decline in areas such as the Rolling Plains ecoregion (Bridges et al. 2002). Although many studies have addressed the effects of landscape patterns and their changes on the abundance of species, landscape characteristics and scaled quail abundance has received little critical attention. Therefore, for the conservation of scaled quails, it is important to examine patterns of landscapes and their changes in regions with contrasting population trends. It is also important to explore how changes in a specific landscape relate to changes in scaled quail populations.
The objective of this study is to examine landscape patterns of the Rolling Plains and the South Texas Plains ecoregions, and landscape pattern changes that had occurred between the 1970s and the 1990s, and the possible relationship with the contrasting trends of the scaled quail populations in these ecoregions. Scaled quails in the Rolling Plains and South Texas Plains are assumed to be different subspecies: the Arizona scaled quail (
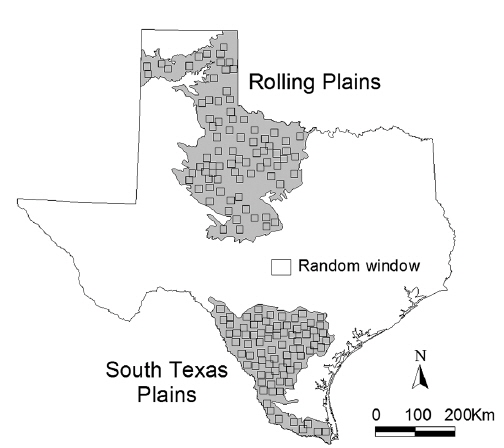
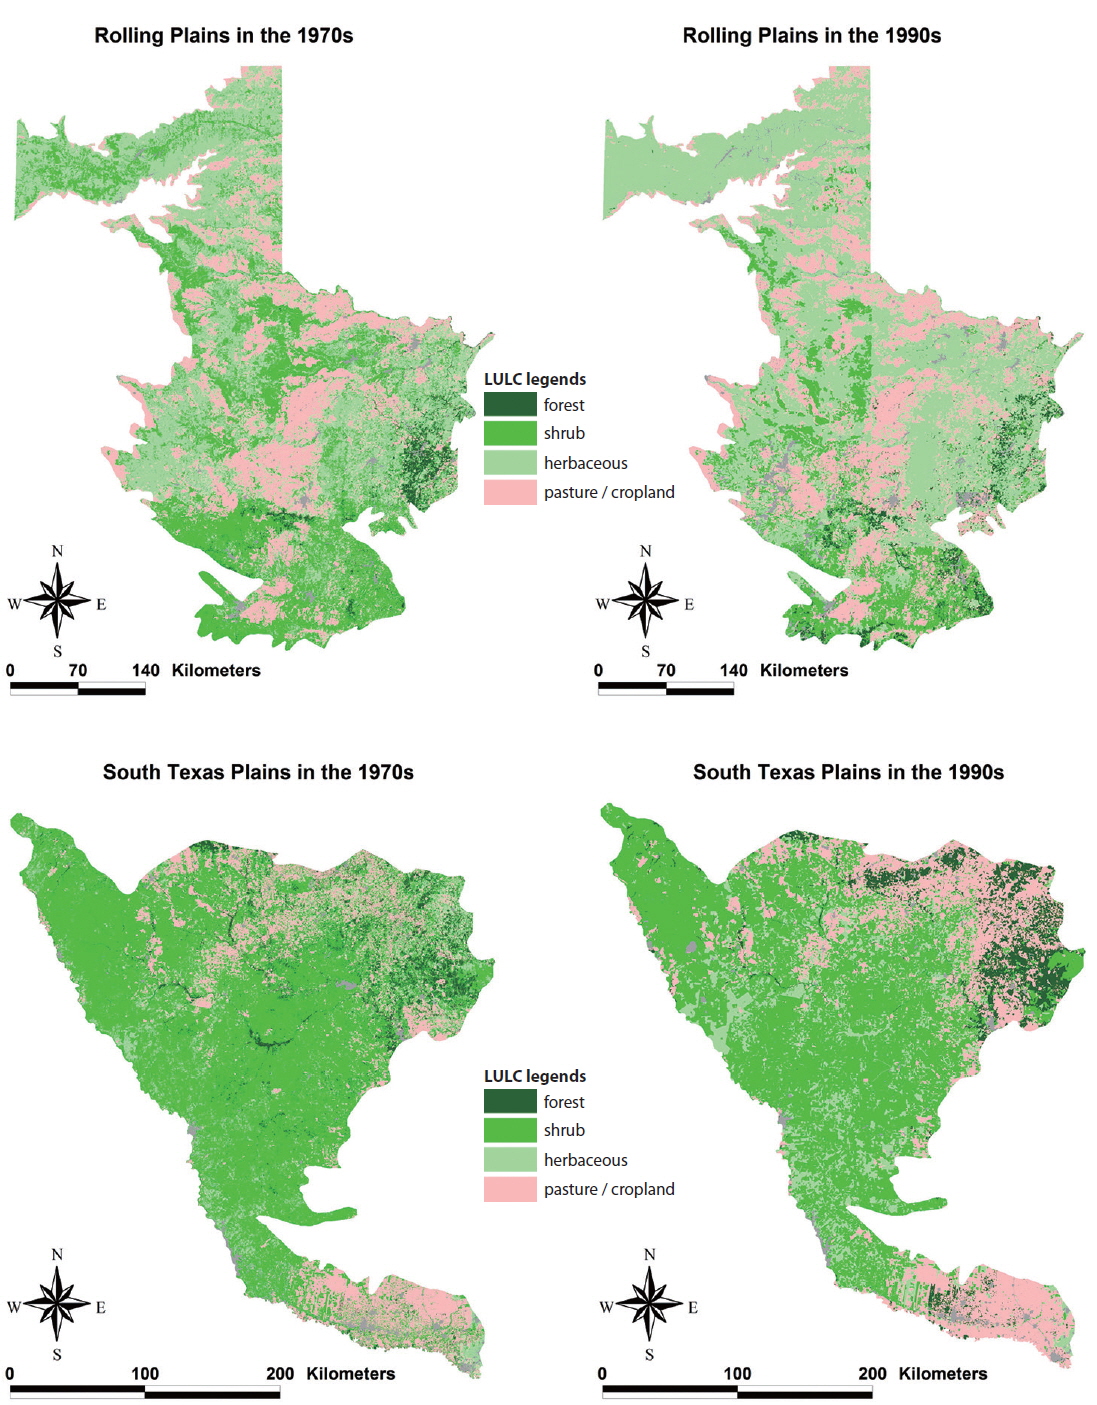
The Rolling Plains and South Texas Plains ecoregions were selected as study areas (Fig. 1). The Rolling Plains, composed of approximately 9,700,000 ha of alternating shrublands and native prairies, has a gently rolling to moderately rough topography that ranges from 245-915 m in elevation. Annual rainfall ranges from about 55 cm in the west to 75 cm in the eastern region, and peaks in May and September. Typically, there is a dry summer period, with high temperatures and high rates of evaporation. Soils vary from coarse sands along outwash terraces adjacent to streams, to tight or compact clays or red-bed clays and shales (Wu et al. 2002).
The South Texas Plains are composed of about 8,000,000 ha of subtropical brushland with small trees, shrubs, cacti, forbs, and grasses, with level to rolling topography and elevation range of 305 m above sea level. The average annual precipitation range is 40-90 cm, and this increases from west to east with largest amounts of rainfall in May and September. Summer temperatures are high, with extremely high evaporation rates in the west. Periodic droughts are common in this ecoregion. Soils range from clays to sandy loams, and vary in chemical properties from calcareous to slightly acidic (Wu et al. 2002).
>
Spatial data development and analysis
The National Land Cover Database (NLCD, Riitters et al. 2000) was acquired and used to quantify landscape patterns of the Rolling Plains and the South Texas Plains ecoregions in the 1990s. This fine (30 m) resolution data was developed based on Landsat 5 Thematic Mapper (TM) satellite imagery from the early 1990s by the Multi-Resolution Land Characteristics Consortium (MRLC), which is made up of multiple federal agencies. Quantification of landscape patterns for an entire ecoregion would be unfeasible with conventional computing power. Therefore, analyses based on randomly located landscapes (subsets of the ecoregion) with smaller spatial extent can be effective, and may even be necessary as to quantify the landscape pattern and statistical variation of each ecoregion. ArcView GIS Spatial Analyst (Environmental Systems and Research Institute, Inc., Redlands, CA, USA) was used to generate 160 random windows (80 for each ecoregion) of 40,000 ha (20 × 20 km2) each in order to compare the landscape patterns between the Rolling Plains and the South Texas Plains (Fig. 1).
A wide variety of landscape metrics are available for evaluating spatial patterns of individual patches and patch types such as land-cover classes, and whole landscapes (Uuemaa et al. 2009). For this study, a set of metrics related to scaled quail habitats, including patch density (PD), mean patch size (MPS), edge density (ED), mean shape index (MSI), interspersion-juxtaposition index (IJI), and Shannon’s evenness index (SEI), were used to quantify the pattern of forests, shrublands, grassland-herbaceous rangelands, and pasture-cropland cover types. PD expresses the number of patches within the entire landscape of each random window, and MPS is the average size of patches in the landscape. In order to quantify landscape heterogeneity, ED, the total edge length calculated per unit area, and MSI, the average perimeter-to-area ratio of all patches in the landscape are measured (McGarigal and Marks 1995). The value of IJI, a measure of the spatial configuration of patch types, increased when the patches were more evenly interspersed in a “salt and pepper” mixture. SEI quantifies evenness among landscapes. It is equal to zero when the observed patch distribution is low and approaches one when the distribution of patch types becomes more even at the landscape level (McGarigal and Marks 1995). These landscape metrics were selected based on the fact that scaled quails inhabit a variety of land-cover types throughout their life cycle; require interspersion of habitats for breeding, escaping, food, and loafing; and more quails observed near the edges between different cover types (Schemnitz 1961, Silvy et al. 2007). The Patch Analyst extension for ArcView (Elkie et al. 1999), based on the FRAGSTATS software (McGarigal and Marks 1995), was used to calculate the landscape metrics.
The USGS Land Use/Land Cover data (LULC; USGS 1990) was obtained and used to quantify landscape patterns for the 1970s. It was then compared to the NLCD of the 1990s to assess the regional landscape changes in the Rolling Plains and the South Texas Plains. Although these two datasets are standard, regional-scale land-cover data widely used in large-scale studies, they have considerable differences in source materials, classification schemes, and spatial resolution. GIS modeling approaches were used to standardize the two datasets in order to make comparisons between them as valid as possible. Raster maps of LULC with different spatial resolutions (30 m, 50 m, 100 m, and 300 m) were first generated from the vector data. Landscape metrics for each of these raster maps were calculated and compared to the landscape metrics of the original vector map in order to find the appropriate spatial resolution for resampling. Based on this analysis, 100 m was determined as an appropriate resolution for vector-to-raster conversion of the LULC data. The 30 m resolution NLCD data was converted into 90-m resolution data with a 3 × 3 majority filter, and then resampled to 100-m resolution data in order to compare to the rasterized LULC data. The resampled NLCD data was further processed by removing all patches smaller than the minimum map unit for LULC, and using the RegionGroup and Nibble function to better match with the LULC data (Environmental Systems Research Institute 1998).
Correlation analyses were conducted to examine the relationship between landscape pattern metrics and scaled quail abundance. Species abundance was calculated based on the Texas Parks and Wildlife Department (TPWD) quail abundance survey data (Wilson 1992). Due to the nature of scaled quail population dynamics, which is characterized by substantial annual fluctuations, expected levels of scaled quail abundance developed using route regression (Geissler and Sauer 1990) over the 1978-2000 period were used in the analysis. A raster map of species abundance, which represents the number of scaled quails seen in each 1.6-km transect segment, was developed by interpolation. The average value of the interpolated raster map for each random window was calculated and used to correlate scaled quail abundance to landscape pattern metrics of 1978 and 1992.
>
Landscape patterns: Rolling Plains compared with South Texas Plains
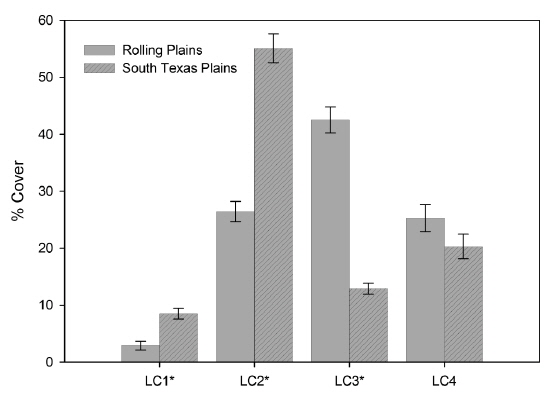
Landscape composition, which is the proportion of total land area occupied by each land cover type, was significantly different between the Rolling Plains and the South Texas Plains (Fig. 2). Shrubland cover occupied the largest area in the South Texas Plains followed by pasture-croplands and grassland-herbaceous rangelands. In contrast, grassland-herbaceous rangelands were the most abundant cover type in the Rolling Plains, followed by substantial amounts of shrublands and pasture-croplands (Fig. 3).
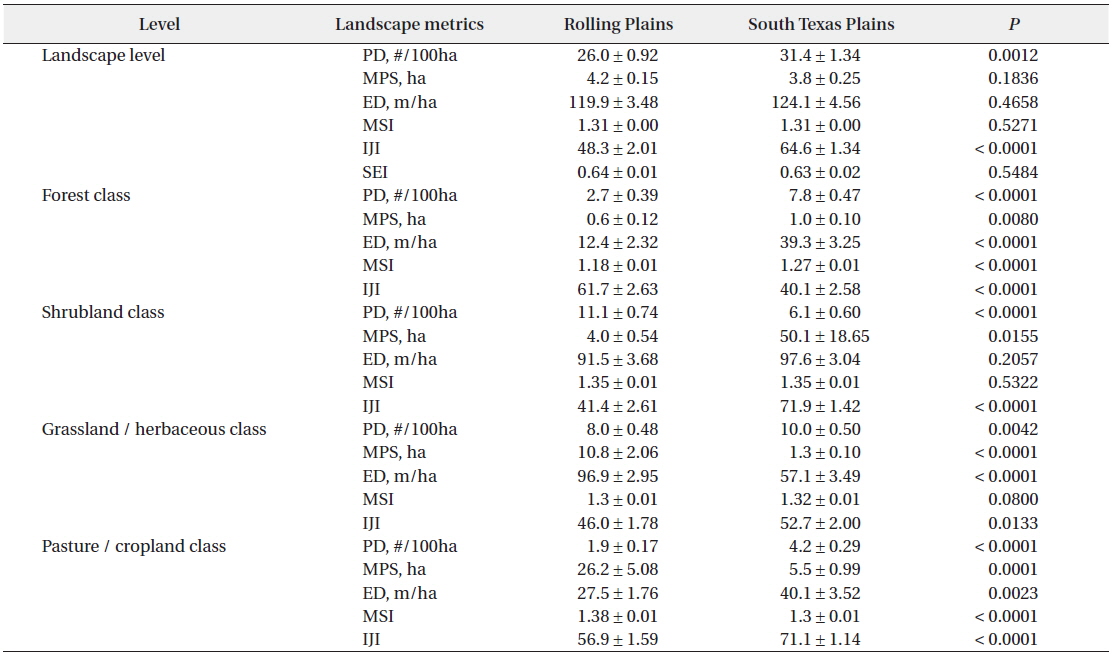
Contrary to the landscape composition, analysis based on whole landscapes showed that spatial patterns of landscape elements in the Rolling Plains and the South Texas Plains were similar even though the South Texas Plains had significantly higher PD and interspersion among land cover classes. Examination of the spatial patterns of individual land cover classes, however, revealed significant differences between the Rolling Plains and the South Texas Plains (Fig. 2). For example, pasture-cropland patches in the South Texas Plains had twice the PD and about 5 times smaller than those in the Rolling Plains (Table 1). The South Texas Plains had a greater amount of pasture-cropland edges, and were more interspersed with other land cover classes.

Mean ± S.E. of landscape pattern metrics at landscape and class level for the Rolling Plains and the South Texas Plains in the 1990s
>
Landscape change: the 1970s compared with the 1990s
Despite the difference in landscape composition of the Rolling Plains and the South Texas Plains, trends concerning their changing landscapes from the 1970s to the 1990s were similar. Rho (2003) observed that shrubland cover increased in both the Rolling Plains (12.2% to 24.7%) and the South Texas Plains (51.1% to 59.7%). Grassland-herbaceous rangeland decreased in both the Rolling Plains (53.9% to 44.6%) and the South Texas Plains (15.2% to 9.9%). Pasture-cropland and forest patches decreased slightly in both ecoregions (Rho 2003).
At the landscape level, PD increased significantly both in the Rolling Plains (1.56 to 7.07/100 ha) and the South Texas Plains (1.91 to 8.28/100 ha) from the 1970s to the 1990s. ED also increased significantly in the Rolling Plains (11.26 to 25.61 m/ha) and the South Texas Plains (12.43 to 25.46 m/ha). However, MPS decreased in the Rolling Plains (1,404 to 160 ha) and the South Texas Plains (674 to 155ha). MSI increased slightly, but not significantly statistically, in the Rolling Plains (1.57 to 1.65) and the South Texas Plains (1.55 to 1.59). IJI decreased in the Rolling Plains (53.57 to 50.26), but increased in the South Texas Plains (50.93 to 54.67). SEI remained relatively stable for both ecoregions.
Landscape patterns of pasture-cropland patches had dramatically changed during the period from the 1970s to the 1990s when compared to other land cover classes. Pasture-cropland landscape in the South Texas Plains became more fragmented in the 1990s than that in the Rolling Plains. For example, pasture-cropland patches of the South Texas Plains were relatively few (0.40 compared to 0.58/100 ha) and large (981 compared to 901 ha) in the 1970s, but they transformed into many (1.56 compared to 1.13/100 ha) and small (201 compared to 506 ha) patches in the 1990s when compared to the Rolling Plains whereas IJI of pasture-cropland patches remained stable during this period and consistently higher in the South Texas Plains than that of the Rolling Plains.
>
Correlations between species abundance and landscape characteristics
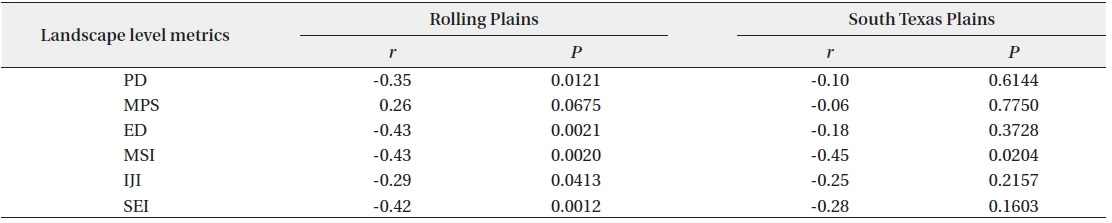
Scaled quail abundance had significant negative correlations with landscape-level PD, ED, MSI, IJI, and SEI in the Rolling Plains. In the South Texas Plains, scaled quail abundance was negatively correlated with the mean shape index, but had no significant correlation with other landscape metrics (Table 2).

Correlations between landscape level metrics and scaled quail abundance for the Rolling Plains and the South Texas Plains in the 1990s
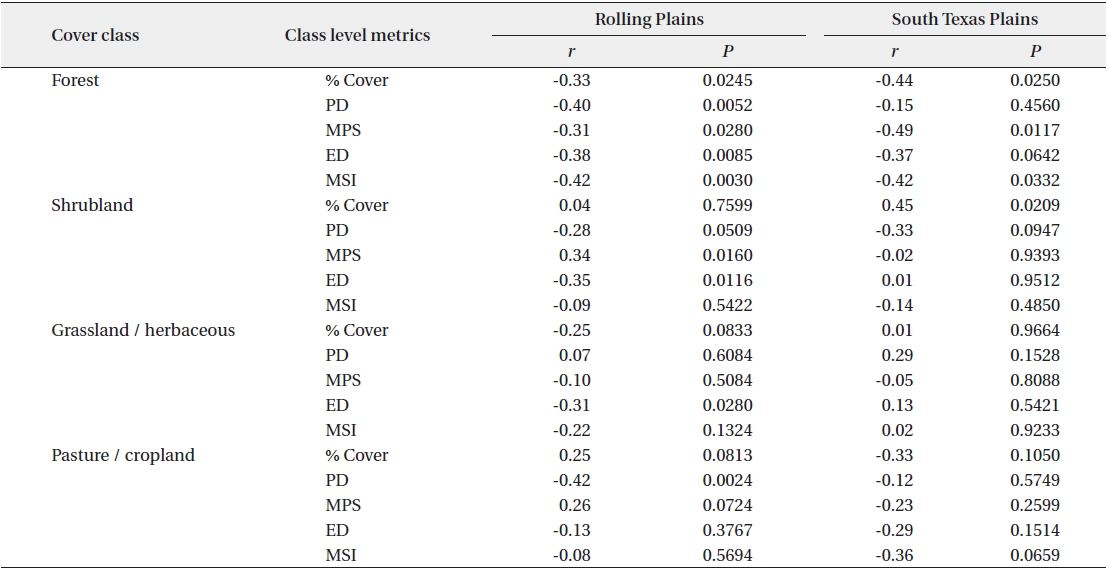
The percentage of cover and most of the spatial attributes of forests were significantly correlated with scaled quail abundance (Table 3). In the Rolling Plains, negative correlations were found between scaled quail abundance and percent cover, PD, ED, MPS, and MSI of forest patches. Negative correlations between species abundance and percentage of forest cover, average size of forest patch were statistically significant in the South Texas Plains, indicating that scaled quail number decreases as forest area and patch size increases in the ecoregion. A highly positive and statistically significant correlation was found between scaled quail abundance and shrubland cover in the South Texas Plains, but not in the Rolling Plains. There was a negative correlation between species abundance and percentage cover of grassland-herbaceous rangeland in the Rolling Plains, but a weak and insignificant correlation in the South Texas Plains.

Correlation between class level metrics and scaled quail abundance for the Rolling Plains and the South Texas Plains in the 1990s
>
Vegetation cover and scaled quail abundance
We observed different relationships between landscape patterns and their changes on scaled quail abundance in the Rolling Plains and South Texas Plains, which are consistent to results from previous studies. Guthery et al. (2001) noted that scaled quails in the South Texas Plains have different requirements for vegetation cover, compared to other regions. They described shrubland as a key habitat in the South Texas Plains, where scaled quails frequently use woody plants and clusters as escaping cover to avoid harsh weather and predators (Wilson and Crawford 1987), and scaled quail whistle counts positively correlated with shrubland cover (Reid et al. 1979). Our research revealed that the percentage of shrubland cover positively correlated with scaled quail abundance in the South Texas Plains, but not in the Rolling Plains (Table 3).
In the Rolling Plains, grassland-herbaceous rangeland was described as an essential habitat for scaled quails, as it provided loafing (Stormer 1981) and roosting cover (Stormer 1984). Decrease in grassland-herbaceous rangeland and increase of shrublands over the 1970s to the1990s suggested that increase in woody cover in the Rolling Plains might be related to the decline of scaled quail population, which is contrary to the South Texas Plains, where scaled quail population remained stable even when the shrubland cover increased. Tall and dense areas of woody plants have long been recognized to be of little use to scaled quails, particularly in southeastern Arizona and northwest Texas (Goodwin and Hungerford 1977, Stormer 1981), because densely vegetated cover impedes the bird’s progress on the ground when foraging and escaping.
The reason for different impacts of landscape patterns and their changes on scaled quail abundance of these ecoregions is probably caused by the different scaled quail subspecies in the Rolling Plains and the South Texas Plains, respectively. Wallmo (1957) mentioned that southern Arizona and northwestern Texas had the same subspecies and southern Texas had other subspecies. Interestingly, habitat selection described by Guthery et al. (2001) coincided with the boundary of scaled quail subspecies. But landscape patterns and their changes rarely correlated with population dynamics of the subspecies in the range. Our research showed that the percentage of grassland-herbaceous cover negatively correlated with the abundance of scaled quails in the Rolling Plains, but not in the South Texas Plains.
>
Percentage and spatial arrangement of pasture-cropland patches
Pasture-cropland might play a different role with respect to scaled quail habitats in the Rolling Plains compared to the South Texas Plains. It was suggested that croplands was an important habitat in the Rolling Plains ecoregion (Schemnitz 1961, Leyva-Espinosa 2000), but CRP that was initiated in 1985 might be one of the reasons causing population decline in the ecoregion because of expansion of homogeneous cropland patches in the Rolling Plains (Schemnitz 1993). Studies are rarely conducted to evaluate pasture-croplands impact on subspecies abundance in the South Texas Plains. Our results showed there were greater numbers of smaller pasture-cropland patches with more edges and greater interspersion with other cover classes in the Rolling Plains than in the South Texas Plains in the 1970s. These spatial patterns were suitable for scaled quails in the Rolling Plains, since agricultural grains and man-made features (e.g., machinery, fences, brush piles) near or within the cropland patches were frequently used as winter food and loafing-escaping sites by scaled quails (Schemnitz 1961, Silvy et al. 2007). However, from the 1970s to the 1990s, pasture-cropland cover became aggregated (with fewer but larger patches) in the Rolling Plains, and fragmented in the South Texas Plains. These changes in pasture-croplands suggest that declining scaled quail abundance was possibly associated with the decrease and increase in spatial aggregation of pasture-croplands in the Rolling Plains.
>
Uncertainty of landscape comparison between NLCD and LULC data
Although the NLCD and LULC data was adjusted to make them comparable, the degree of reliability of the landscape comparisons between the 1970s and the 1990s was uncertain. Landscape comparisons based on the assessment of relative differences between the two ecoregions from the 1970s to 1990s, however, should be reliable and can offer insights on differential landscape dynamics. Our study on absolute values of landscape metrics between 1970s and 1990s indicated fragmentation processes in the Rolling Plains and the South Texas Plains landscapes. Changes in landscapes of both the Rolling Plains and the South Texas Plains were different during that period as is shown by pasture-cropland class metrics. For example, pasture-cropland patches in the South Texas Plains were relatively few and large in the 1970s, but they transformed into many small patches in the 1990s, compared to the Rolling Plains. The decrease of pasturecropland and more aggregated configuration in the Rolling Plains are possibly linked to the long-term population decline of scaled quail in the ecoregion.
The relative differences in landscape pattern metrics from the 1970s to the 1990s remained unchanged in the shrubland and grassland-herbaceous between the Rolling Plains and the South Texas Plains. These results suggest that landscape patterns of vegetation cover remained temporally consistent between the 1970s and 1990s. For example, the number of grassland-herbaceous patches in the Rolling Plains was higher than in South Texas Plains in the 1970s, and continued to grow in the 1990s. Compared to the subspecies in the South Texas Plains, scaled quails in the Rolling Plains were influenced by the decrease in grassland-herbaceous land cover and the aggregation of cropland-pasture landscape. Habitat management of scaled quail ecology and life cycles is closely related to the CRP and anthropogenic factors affecting the percentage cover of grassland-herbaceous and cropland-pastures.