Ailanthus altissima, which is recognized as an invasive tree in the Western world, has been widely observed in Japan. To investigate how A. altissima expanded within-population and to new populations within a region, 446 A. altissima trees were sampled from three separate sites (A, B, and C) including 35 distantly positioned patches, with three chloroplast DNA markers and nine nuclear microsatellite markers. We detected 2, 2, and 3 chloroplast haplotypes in sites A, B, and C, respectively. In addition, 271, 40, and 41 nuclear genotypes were detected in sites A, B, and C, respectively. The clonal richness value was 0.85, 0.78, and 0.53 in sites A, B, and C, respectively. Most trees with the same genotypes were distributed in the same patch, indicating that range expansion by asexual reproduction was limited to a maximum of 45 meters. According to autocorrelation analysis, the extent of nonrandom spatial genetic structure was approximately 0-2 km in sites A and C. KINGROUP analyses showed that 812, 74, and 111 nuclear genotype pairs were detected to have kinship in sites A, B, and C, respectively. Most nuclear genotype pairs were detected within the same patches or sites. These results indicate that the number of A. altissima trees gradually increased from seeds, some of which were produced by trees within sites, meaning that this species could regenerate naturally. This shows the need for the future management of A. altissima as an invasive species in Japan.
Kolar and Lodge (2001) indicated that invasiveness of a plant species is related to characteristics such as taxon, the history of invasion, and asexual reproduction. While an accurate history of the expansion of an introduced species is difficult to obtain, the range expansion of some invasive plants has been demonstrated through population-genetic analysis (Bossdorf et al. 2005, Rosenthal et al. 2008, Pairon et al. 2010). For
It is known that the use of microsatellite markers for polymorphism analysis is quite effective for reproductive analyses in a wide range of organisms, from fungi to higher plants and animals. Nuclear microsatellite (nSSR) markers with high polymorphism can contribute to the analysis of parenthood, kinship, and population differentiation (Kurokochi and Hogetsu 2014). The capability of asexual reproduction of woody species via adventitious roots could form large genets with a lot of ramets (Gyokusen et al. 1991, Kowarik 1995, Ogawa and Hukusima 1996, Kurokochi et al. 2010), and genets can be readily detected with high polymorphism nuclear DNA markers (Jung et al. 2009, Kurokochi et al. 2010).
In this study, to gain a better understanding of the method of range expansion of
>
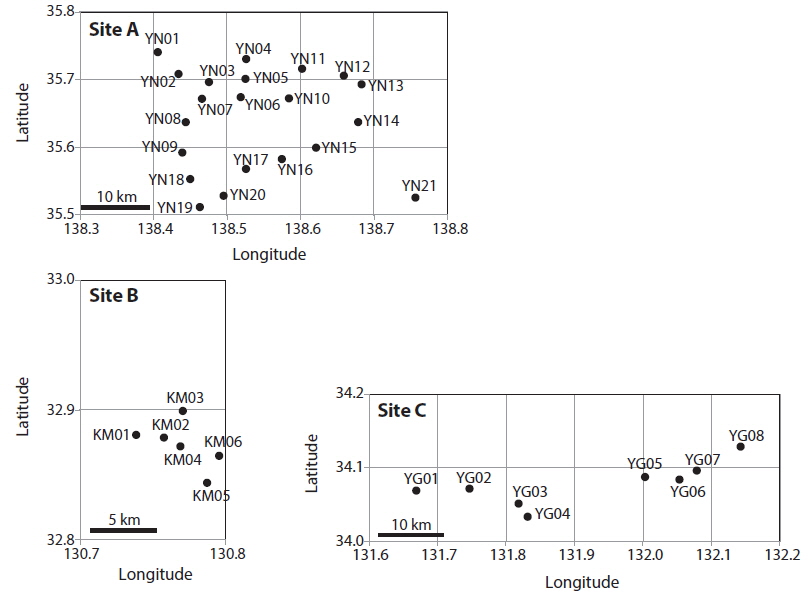
Site, patch, and sample collection
We collected
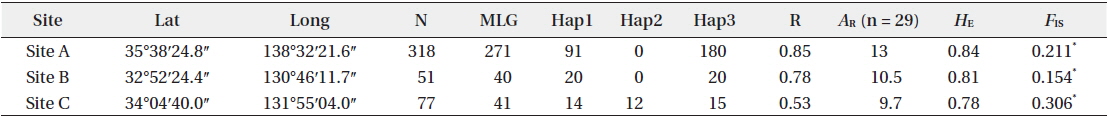
[Table 1.] Site information and genetic indices of each site

Site information and genetic indices of each site
There were many

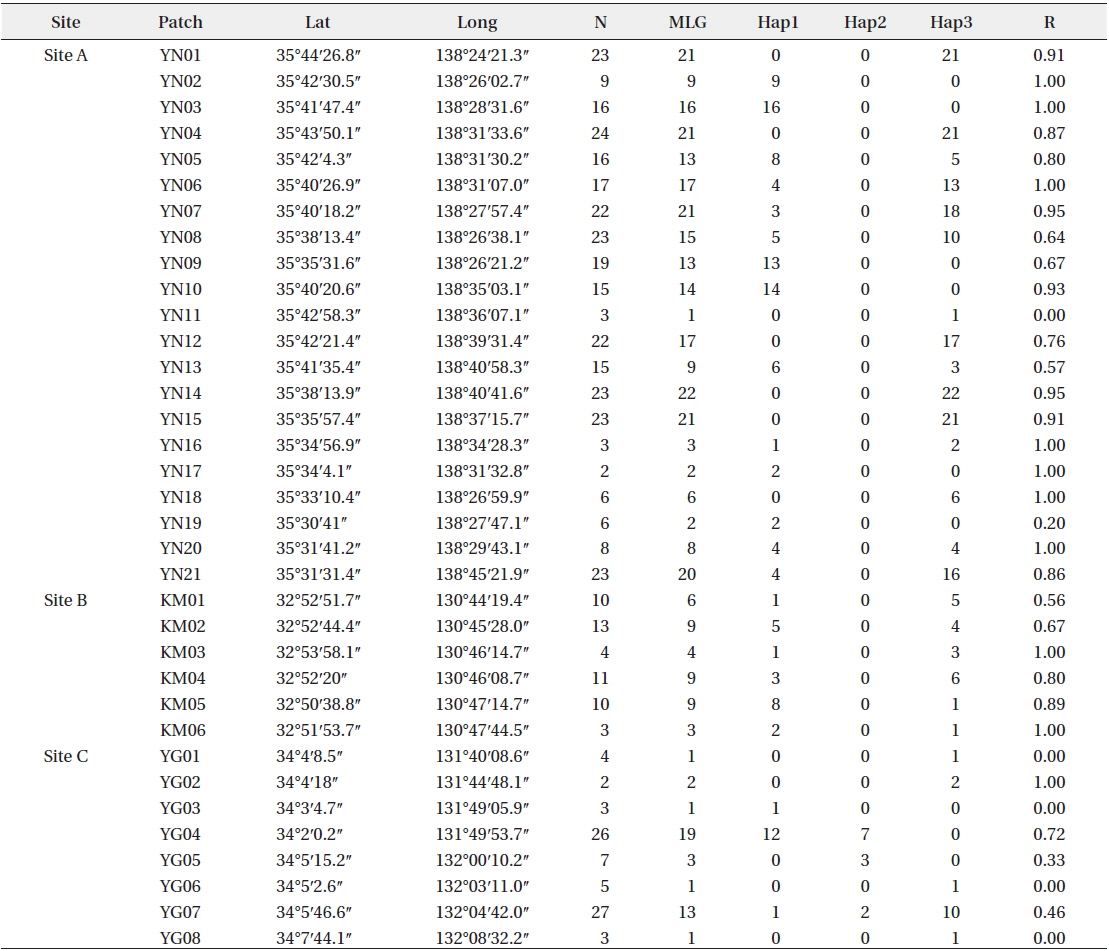
Patch information and detected multi-locus genotypes including the distribution of chloroplast haplotypes
After
>
DNA extraction and microsatellite analysis
DNA was extracted from each leaflet using a modified CTAB method (Kurokochi et al. 2013). Three chloroplast DNA (cpDNA) markers (Aacp01, Aacp02, and Aacp03; Kurokochi et al. in press) and nine nuclear SSR (nSSR) markers (Aa22, Aa68, Aa69, Aa75, Aa76, Aa79, Aa80, Aa82, and Aa92; Dallas et al. 2005) were used. All loci from the cpDNA and nSSR markers were amplified by polymerase chain reaction (PCR) with the Type-IT kit (Qiagen, Hilden, Germany). PCR products were electrophoresed using an ABI 3130 automated DNA sequencer (Applied Biosystems, Foster City, CA, USA), and their fragment sizes were analyzed with a GeneMapper software (Applied Biosystems).
Marker resolution, genotyping, and clonality
Chloroplast haplotypes (cp-haplotypes) of each tree were determined using the three cpDNA markers. For the nine nSSR markers, the number of alleles (
For the following statistical analyses, in cases where one n-genotype was detected for multiple trees, we selected one tree as a representative of that n-genotype.
Genetic diversity for each site and genetic differentiation among sites
To understand the genetic diversity of each site, allelic richness (El Mousadik and Petit 1996), Nei’s unbiased expected
In order to detect genetic differentiation among sites, pairwise
Genetic similarity among trees
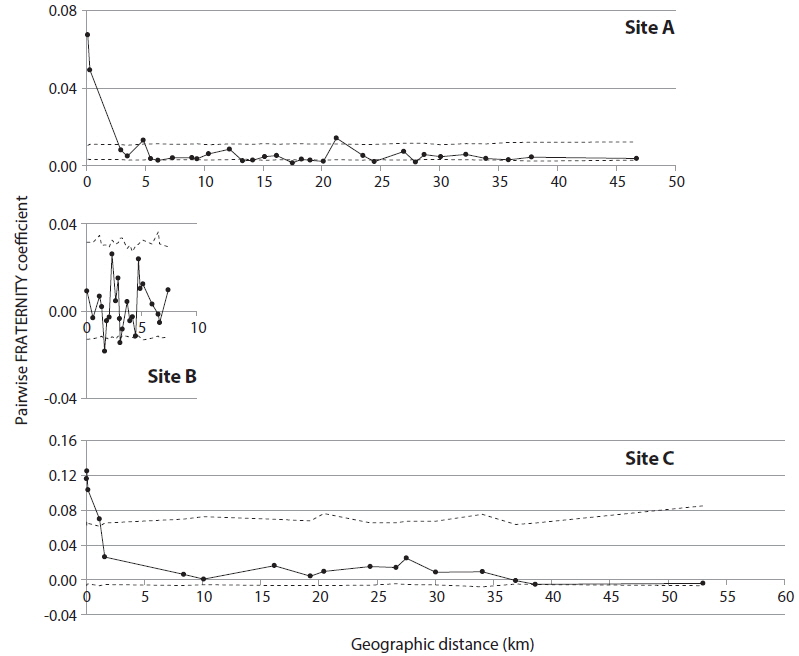
In order to detect genetic correlation with geographic distance among trees, autocorrelation analysis was performed with SPAGeDi (Hardy and Vekemans 2002), using the nSSR data set. Genetic correlation was calculated by Pairwise FRATERNITY coefficients.
For the detection of genetic relationship among trees, the presence of potential kinship among sampled trees was tested using the nSSR markers at a significance level of 0.01 with KINGROUP ver. 2 (Konovalov et al. 2004) using 10,000,000 permutations following the protocol of Kurokochi and Hogetsu (2014). N-genotype pairs with detected full-sibling and half-sibling relationships were considered as having kinship.
>
Marker resolution, genotyping, and clonality
In total, 318, 51, and 77 samples from sites A, B, and C, respectively, were analyzed. Two, 2, and 3, cp-haplotypes were detected in sites A, B, and C, respectively. In addition, 271, 40, and 41 n-genotypes were detected in sites A, B, and C, respectively. Trees with the same n-genotype always had the same cp-haplotype. Cp-haplotypes were shared between patches within sites whereas no n-genotype was found in more than one patch. The clonal richness statistics were 0.85, 0.78, and 0.53 at sites A, B, and C, respectively (Table 1). Using 271, 40, and 41 n-genotypes detected in sites A, B, and C, respectively, the values of
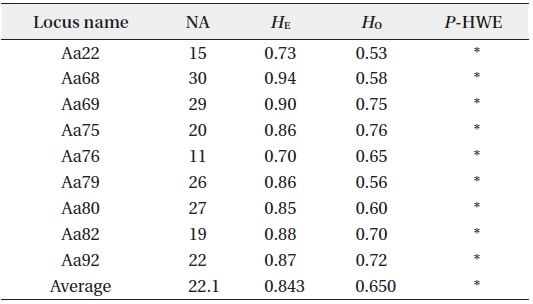
Summary of genetic diversity based on nine nuclear microsatellite markers of Ailanthus altissima
In our previous study on a countrywide scale, we observed that some
Kowarik and Säumel (2007) indicated that
>
Genetic diversity for each site and differentiation among sites
>
Genetic relationship among trees
KINGROUP analyses showed that 812, 74, and 111 n-genotype pairs had kinship in sites A, B, and C, respectively. Most of those pairs (782 of 812, 45 of 74, and 78 of 111 n-genotype pairs) were detected within the same patches or sites (Table 4). These results also supported the autocorrelation analysis, suggesting that the dispersed seeds were mostly established within several hundred meters from mother trees and contributed to the expansion of
When cp-haplotypes of each tree were subjected to KINGROUP analyses, most n-genotype pairs showing kinship were detected among trees belonging to the same cp-haplotypes and only a few of these pairs showed different cp-haplotypes (Appendix 1). Given that some n-genotype kinship pairs showed different cp-haplotypes, it is possible that two trees derived from different intercrossed cp-haplotype groups. Therefore, one reason why most of these n-genotype pairs were detected among trees belonging to the same cp-haplotypes despite the presence of several cp-haplotypes in the same patches may be due to the low number of initial trees in a location and/or short history of
[Appendix 1.] Numbers of nuclear genotype pairs connected by kinship in pairs of patches
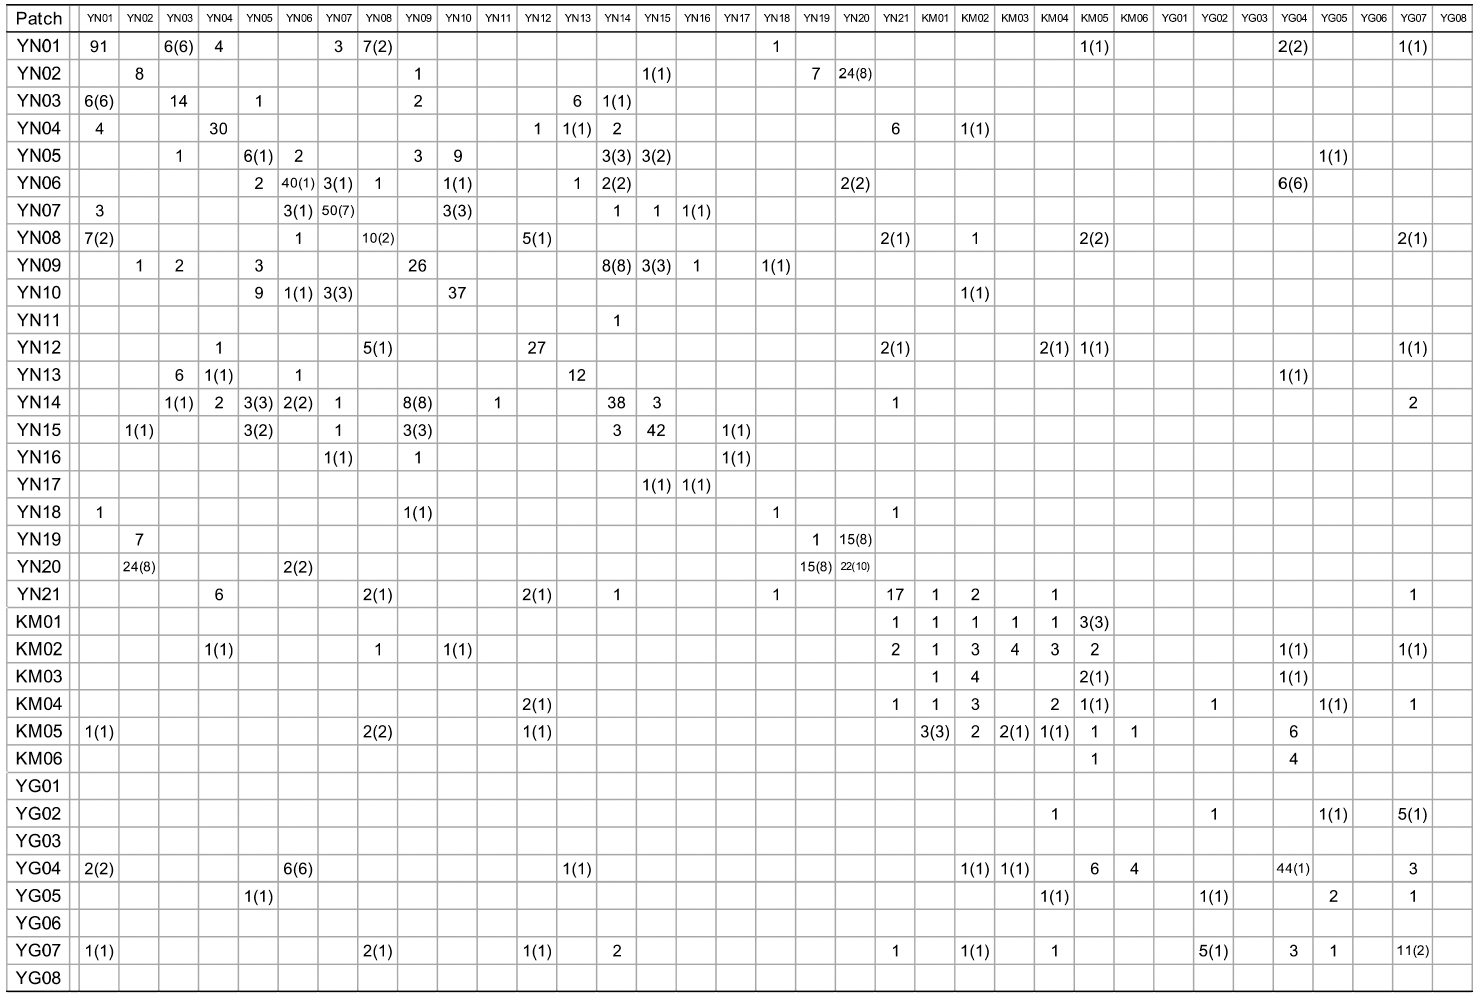
Numbers of nuclear genotype pairs connected by kinship in pairs of patches
>
Range expansion of Ailanthus altissima in Japan
The mechanism of the range expansion of
First, some
[Table 4.] Kinship pairs of nuclear genotypes
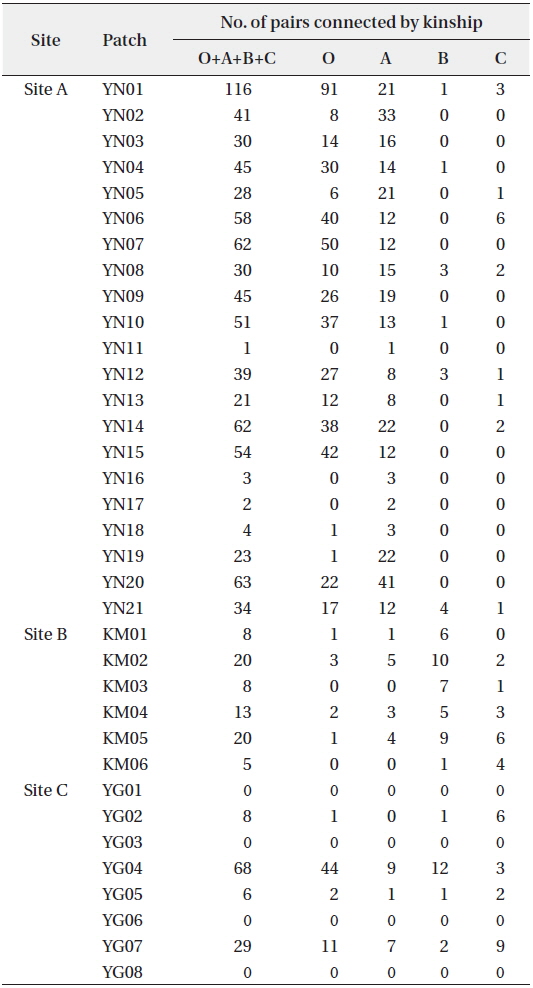
Kinship pairs of nuclear genotypes