This study was based on water quality data of the Lake Doam watershed, monitored from 2010 to 2013 at eight different sites with multiple physiochemical parameters. The dataset was divided into two sub-datasets, namely, non-rainy and rainy. Principal component analysis (PCA) and factor analysis (FA) techniques were applied to evaluate seasonal correlations of water quality parameters and extract the most significant parameters influencing stream water quality. The first five principal components identified by PCA techniques explained greater than 80% of the total variance for both datasets. PCA and FA results indicated that total nitrogen, nitrate nitrogen, total phosphorus, and dissolved inorganic phosphorus were the most significant parameters under the non-rainy condition. This indicates that organic and inorganic pollutants loads in the streams can be related to discharges from point sources (domestic discharges) and non-point sources (agriculture, forest) of pollution. During the rainy period, turbidity, suspended solids, nitrate nitrogen, and dissolved inorganic phosphorus were identified as the most significant parameters. Physical parameters, suspended solids, and turbidity, are related to soil erosion and runoff from the basin. Organic and inorganic pollutants during the rainy period can be linked to decayed matters, manure, and inorganic fertilizers used in farming. Thus, the results of this study suggest that principal component analysis techniques are useful for analysis and interpretation of data and identification of pollution factors, which are valuable for understanding seasonal variations in water quality for effective management.
Lake Doam, located in Daegwallyeong, Gangwon-do was formed as part of a constructed dam in the upper reaches of River Song at the highest elevation of 712 m in South Korea in 1990. The dam has generated hydroelectricity since August of the same year. Water withdrawn from the dam was transported to the hydroelectric power plant through a tunnel, which subsequently reduced water discharge in the downstream and degraded the water quality. Therefore, the electric power generation was halted in 2001 (Cho 2001). The watershed includes residential areas, forests, mid-upland agricultural lands, pastures, golf links, and recreational resorts. Pollutant discharges from point sources (domestic wastewater and wastewater treatment plants) and non-point sources (agricultural, urban runoff, and forest) have been a big concern for Lake Doam. Long-term trends of summer season water quality by Kwak et al. (2013) showed that Lake Doam was a mesoeutrophic lake where the average values of chlorophyll-a (Chl-a), total nitrogen (TN), and total phosphorus (TP) were 11.8 mg m-3, 3.13 mg L-1, and 0.077 mg L-1, respectively.
Non-point source pollution caused by stormwater runoff is difficult to manage and high values of suspended solids (SS), total phosphorus (TP), and chemical oxygen demand (COD) were observed from 2009 to 2011 (Heo 2012). Agricultural activities in alpine areas with steep slope and soil conditioning practices are the major causes of soil erosion and sediment yield in the watershed. And the use of chemical fertilizers and livestock manure is a great concern of non-point source pollutant discharge, as it deteriorates the ecology and environment of water bodies (Shin 2004, Heo et al. 2006, Heo et al. 2007). Park et al. (2012) demonstrated that contamination in the water of Lake Doam and watershed streams was serious. Soil conservation to reduce SS and appropriate management are needed in the Lake Doam watershed to improve the water quality during wet weather conditions (Choi et al. 2012). Water quality degradation of water bodies due to runoff from highland agricultural areas is a major problem in South Korea (Heo et al. 1998, Park et al. 2005, Kim et al. 2007, Jung et al. 2009).
Water body contamination in rivers and lakes is one of the major global environmental problems. Pollution control is necessary to maintain good quality of water bodies. Therefore, a monitoring program is needed to provide a representative and reliable estimation of the quality of surface water bodies. And data analysis is required to interpret and understand the nature of pollution (Dixon and Chiswell 1996). The surface water sampling over time at various locations within the watershed for multiple physical, chemical, and biological water quality parameters is needed for a comprehensive water quality investigation. Multivariate statistical methods are applied to reduce the large and complex dataset matrices to better understand the water quality and ecology of the studied systems (Olsen et al. 2012). Principal component analysis (PCA) and factor analysis (FA) techniques are frequently applied to identify important components or factors of water variables. Water quality variables accounting for higher coefficients or loadings in the same principal component (PC) are interrelated and interpretation of PCs will help to understand temporal and spatial variations. This process of grouping variables and finding major parameters enables the identification of the sources of contamination (Thurston and Spengler 1985, Cao et al. 1999, Alberto et al. 2001, Simeonov et al. 2003, Ouyang et al. 2006, Shrestha and Kazama 2007). PCA and FA methods have been applied to analyze and assess the water quality of several water bodies around the world over the last decade: River Elbe, Germany (Petersen et al. 2001); Gomti River, India (Singh et al. 2005); Jajrood River, Iran (Razmkhah et al. 2010); Qiantan River, China (Huang et al. 2010); Kinta River, Malaysia (Gazzaz et al. 2012); Tigris River basin, Turkey (Varol et al. 2012); and the Alqueva reservoir, Portugal (Palma et al. 2014).
This study aims to assess temporal and spatial variations of water quality parameters monitored from 2010 to 2013 in the Lake Doam watershed. Applying the multivariate statistical methods, PCA and FA, will make it easier to understand major water quality components or factors affecting water bodies in the watershed. The results of this work will help water managers to understand major pollutants and sources of pollution in the Lake Doam watershed.
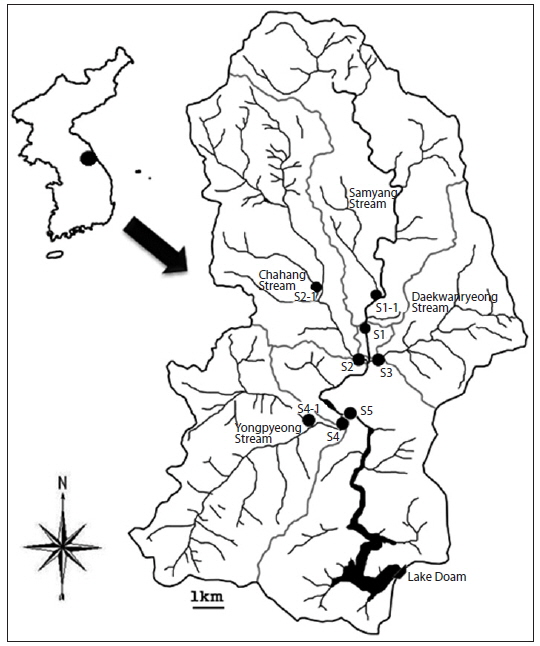
River Song, the main stream flowing into Lake Doam, is 52.06 km in length. Tributaries of River Song are the Samyang Stream (15.67 km), Chahang Stream (10.45 km), Daegwallyeong Stream (17.34 km), and Yongpyeong Stream (8.60 km). The basin area (119 km2) consists of sub-watershed areas: Samyang (42 km2 ), Chahang (29.6 km2), Daegwallyeong (16.8 km2 ), and Yongpyeong (30.6 km2). Lake Doam watershed is made up of forested areas (56%), agricultural areas (36%), and other areas (8%; residential infrastructures, roads, and streams). These eight sites (S1, S1-1, S2, S2-1, S3, S4, S4-1 and S5) were chosen for the monitoring program (Fig. 1). According to the Wonju Regional Environmental Office’s 2011 report, the total population in the area was 5,541 and the cattle population was 3,700 as of 2009. Alpensia and Yongpyeong ski resorts, which are located in this watershed, also attract large tourist populations.
Sampling was conducted in two different weather conditions: such as rainy and non-rainy seasons. During the non-rainy season, water samples were collected once a month and tested, whereas during the rainy season, water samples were collected at the intervals of 1-2 hours in the rain. Overall, there were 22 notable rainfall events: 5, 4, 8, and 5 times in 2010, 2011, 2012 and 2013, respectively (Table 1).
[Table 1.] Major rainfall events at Lake Doam watershed from 2010-2013
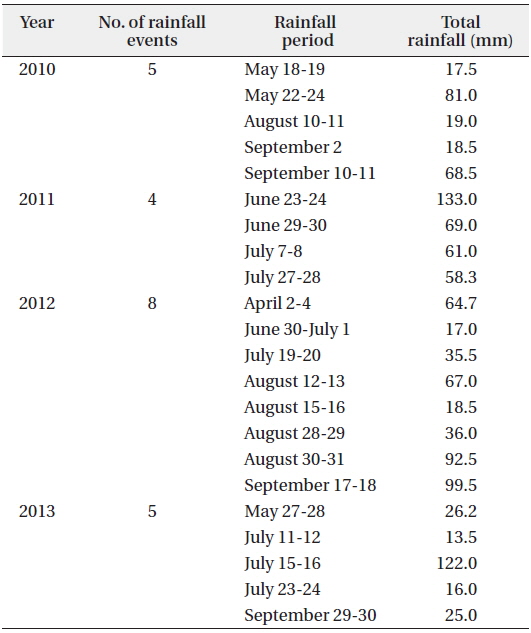
Major rainfall events at Lake Doam watershed from 2010-2013
The following water quality parameters were chosen for this study: water temperature (WT), electric conductivity (EC), pH, turbidity (Tur), suspended solids (SS), chemical oxygen demand (COD), total phosphorus (TP), dissolved inorganic phosphorus (DIP), total nitrogen (TN), nitrate nitrogen (NO3-N), and ammonia nitrogen (NH3-N) (Table 2). WT, EC, and pH were monitored at the sites using a multi-probe (YSI 556 MPS; YSI Incorporated, Yellow Springs, OH, USA). Water samples were collected in 2 L low density polyethylene (LDPE) bottles from each site and tested at the laboratory according to the standard method (American Public Health Association 1998) and the standard water pollution process test method (Institute of Environmental Research 1999). BRAN-LUEBBE Auto-Analyzer 3 (Bran Luebbe, Chicago, IL, USA) and UV-Vis spectrophotometer (Perkin-Elmer, Waltham, MA, USA) were used to test nitrogen and phosphorus components, respectively.
[Table 2.] Water quality parameters, units and analytical methods/instruments
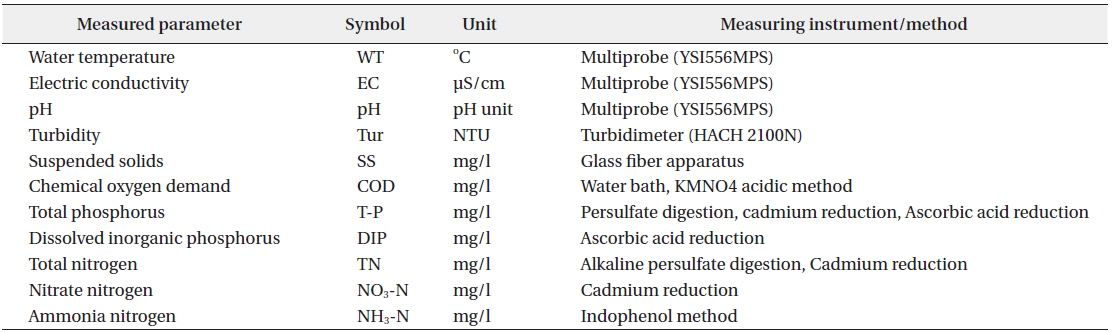
Water quality parameters, units and analytical methods/instruments
The large dataset was divided into two pools for the present study, rainy and non-rainy datasets, from all eight stations monitored during the four-year period of 2010 to 2013. The number of total observations in the non-rainy dataset was 360 (Table 3, sum of observations of 8 sites), while the number of total observations in rainy dataset was 1392 (Table 4, sum of observations of 8 sites). The multivariate statistical techniques, PCA and FA, were applied to each dataset to identify the most valuable components and factors to assess the water quality of the watershed. The PRINCOMP and FACTOR procedures were performed on Statistical Analysis System (SAS) software, ver. 9.3 (SAS Institute Inc., Cary, NC, USA). The exploratory data analysis methods, PCA and FA, use the correlation structure among multiple parameters and produce a new set of variables that contain information on the original dataset. The PCA gives the eigenvalues of the correlation matrix, their proportions, and principal components as many as the parameters used in the dataset and corresponding eigenvectors of each component. The PC with the highest eigenvalue is known to be the most significant, and eigenvalues of 1.0 or greater are considered significant. The principal component can be expressed as:

where z is the component score; a, the component loading;
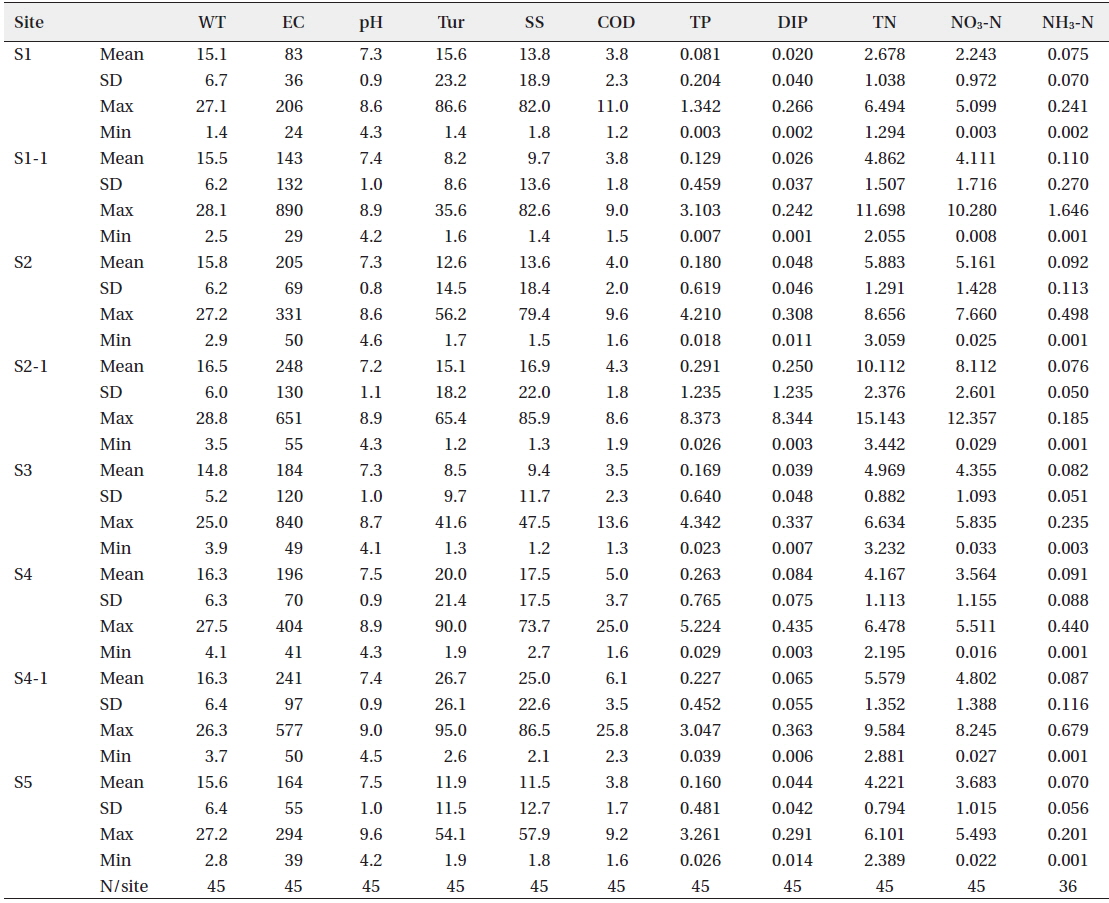
[Table 3.] Descriptive statistics of non-rainy dataset of Lake Doam watershed from 2010-2013

Descriptive statistics of non-rainy dataset of Lake Doam watershed from 2010-2013
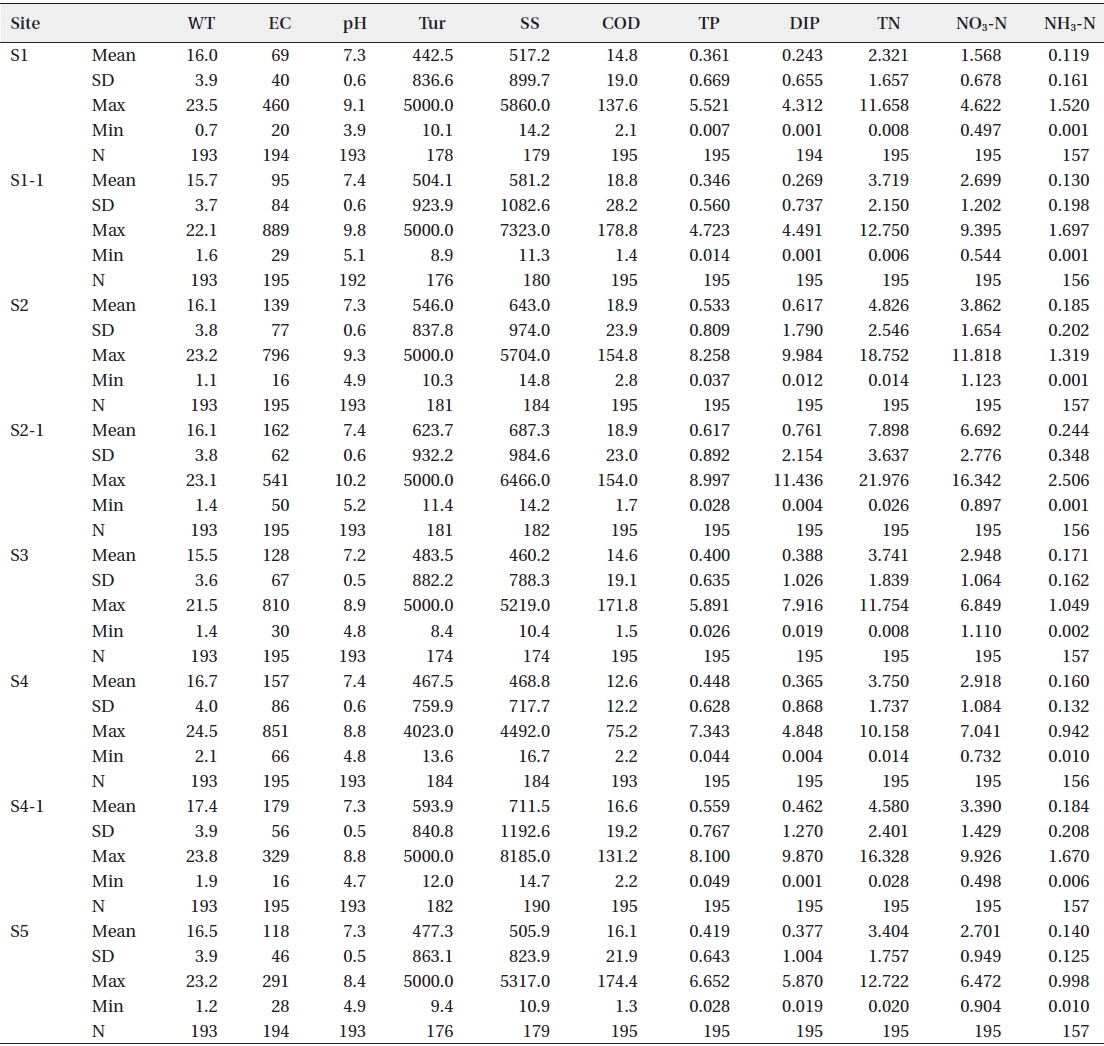
[Table 4.] Descriptive statistics of rainy dataset of Lake Doam watershed from 2010-2013

Descriptive statistics of rainy dataset of Lake Doam watershed from 2010-2013
Varifactors (VFs) are produced by further rotation of axis of new variables defined by the PCA. Factor analysis procedures follow the PCA for reduction of dataset to obtain only a few factors/components that have eigenvalues greater than 1.0. And it further reduces the contribution of less significant variables. The factors are valuable to get a good description of the entire dataset variability (Ouyang et al. 2006, Olsen et al., 2012). The expression of FA can be:

where z is the measured variable;
The non-rainy and rainy datasets in Table 3 and 4 provide descriptive statistics (mean, standard deviation, etc.) of the monitored parameters for all eight sites during the four-year period of 2010 to 2013. These two tables show a similar pattern for all the sites: mean values of parameters, EC, TN, and NO3-N, were higher during the non-rainy condition, and Tur, SS, COD, TP, DIP, and NH3-N were higher during the rainy condition. Lower mean values of EC, TN, and NO3-N during the rainy condition could be the result of dilution during high flow. The highest mean turbidity was observed at site S2-1, with a value of 624, followed by sites S4-1 of 594 and S2 of 546. Site S4-1 had the highest mean value of SS, with a value of 712, and sites S2-1 and S2 also recorded high mean values of SS, with mean values of 687 and 643, respectively. Sites S2 and S2-1 observed the highest COD. Phosphorus components TP and DIP were recorded high at site S2-1 with the mean values of 0.617 and 0.761, respectively. Nitrogen components TN, NO3-N, and NH3-N were also higher at site S2-1 and the mean values were 10.11, 8.11, and 0.244, respectively. These parameters were also recorded high in two other sites, S2 and S4-1. The two sites, S2-1 and S2, which recorded high mean values of water quality parameters, are located in the Chahang stream and S4-1 is located in the Yongpyeong stream. According to Heo (2012), nearly 97% of the total cultivated land of the Lake Doam watershed lies in the sub-watersheds of Chahang and Yongpyeong streams. The Chahang stream sub-watershed and Yongpyeong stream sub-watershed are made up of about 62% and 52% of cultivated land, respectively. Soil erosion and agricultural runoff could be the main sources of the high values of water quality parameters in these two stream sites. The rainy data observations in this study were mostly monitored from June to September, which is the monsoon season in Korea. The monsoon brings large and intense rainfall in this area. Soil erosion from the watershed is the major cause of water turbidity water and high concentrations of SS and pollutants (Heo et al. 1998). Upper stream sites at the tributaries of the Song Stream receive direct discharge from natural and anthropogenic point and non-point sources of pollution, and obvious influences were shown in the results.
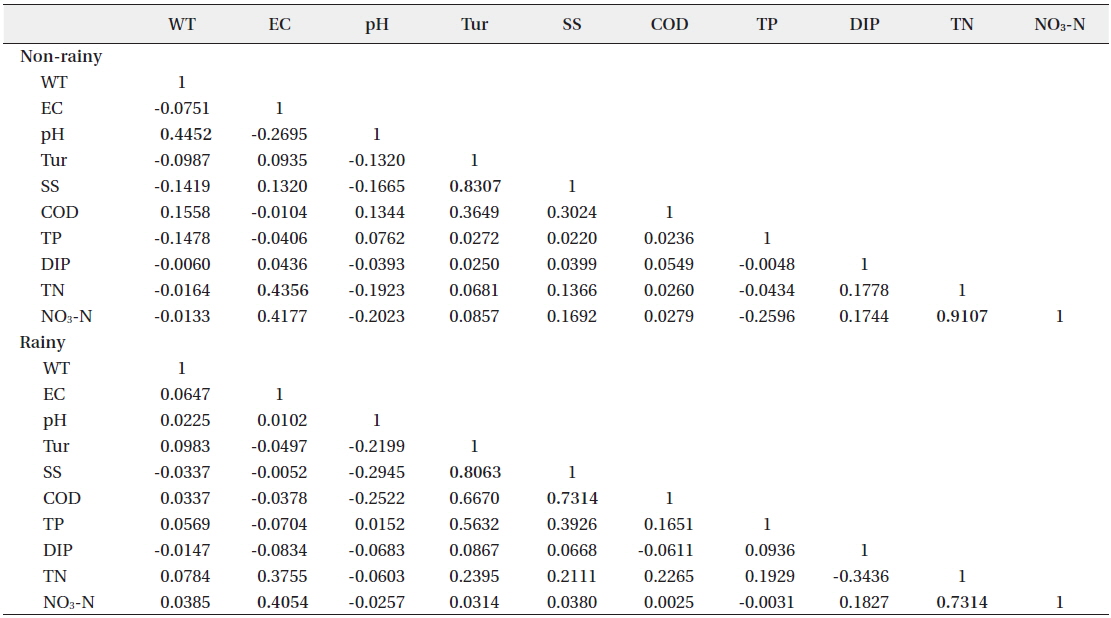
Data in Table 5 demonstrate the correlation matrices for both rainy and non-rainy datasets. Overall, correlations between parameters were very low in both datasets. However, in the non-rainy dataset, SS and Tur, and TN and NO3-N, showed strong significant correlations of 0.83 and 0.91, respectively. Among the parameters of the rainy dataset, SS had highly significant positive correlations with Tur and COD, which were 0.81 and 0.73, respectively. Significant positive correlations were also recorded between parameters, Tur and COD, and TN and NO3-N, of 0.67 and 0.73, respectively. The high correlation between COD and SS is a very interesting case. Discharge from organic pollutants in the stream from natural and anthropogenic sources is the cause of high COD (Simeonov et al. 2003, Singh et al. 2005). Stormwater runoff from residential areas, cattle farms, forest, and the manure used on agricultural lands could be the main reason behind the positive correlation between SS and COD.
[Table 5.] Correlation matrix of the 11 water quality parameters monitored in Lake Doam watershed

Correlation matrix of the 11 water quality parameters monitored in Lake Doam watershed
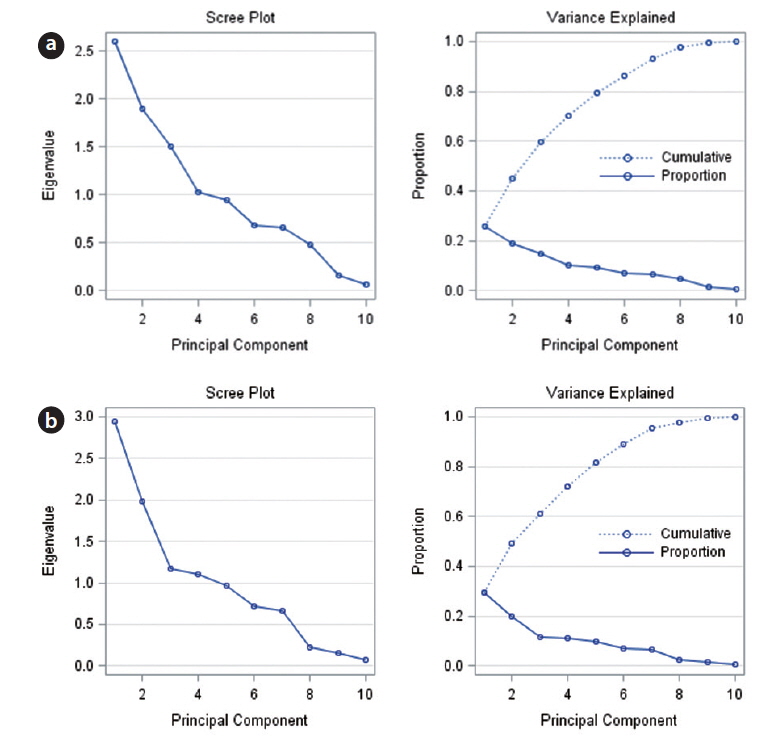
The results demonstrated by the PCA procedure were presented in Fig. 2 and 3. Eigenvalues, proportions, and variance explained by each principal component and the loadings on the first five components were presented in these two figures. The eigenvalues accounted for the first five PCs of non-rainy data, which were 2.60, 1.90, 1.50, 1.03, and 0.94. And the eigenvalues for the first five PCs of rainy data were 2.95, 1.99, 1.17, 1.11, and 0.97. The total variances explained by the first five PCs of non-rainy and rainy datasets were 80% and 81%, respectively. Therefore, the first five PCs for both datasets that had eigenvalues greater than 1.0 or near to unity are only considered for further analysis.
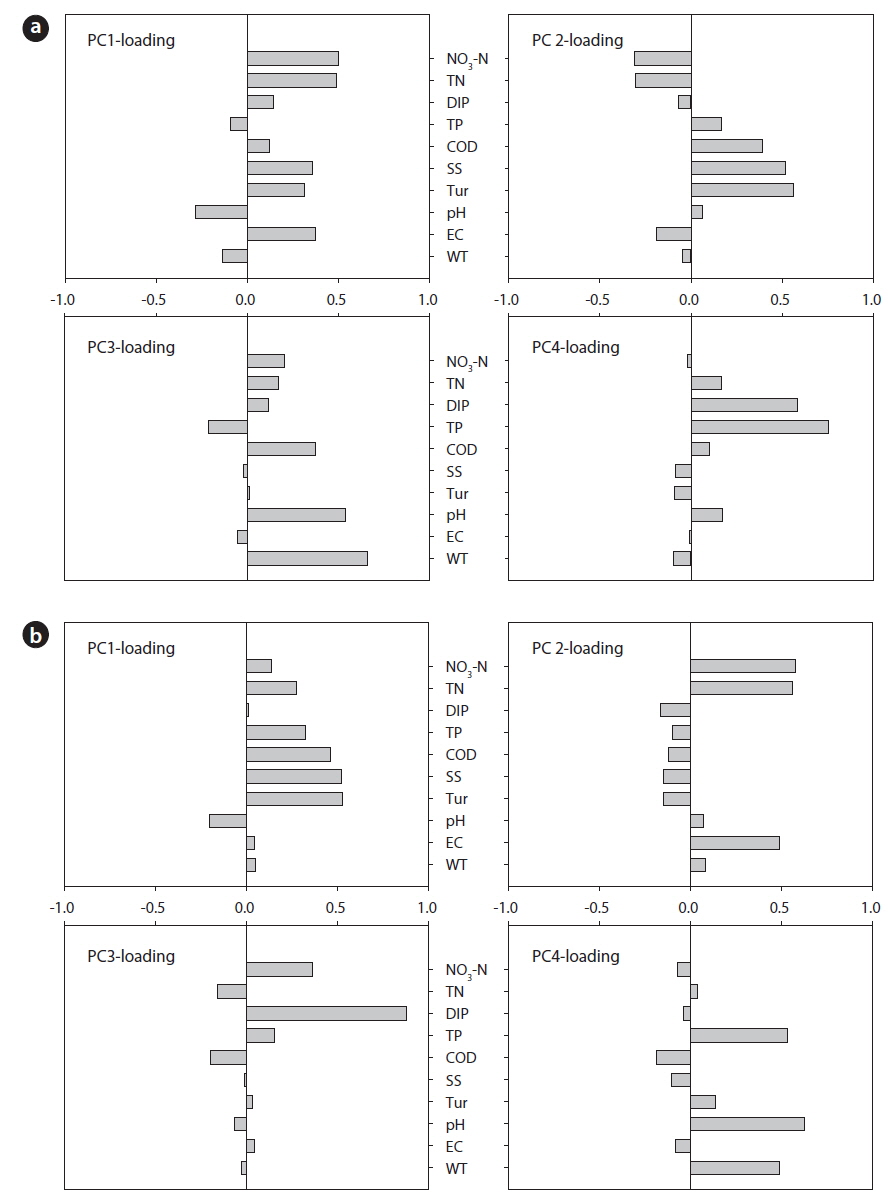
Component loadings of the first four PCs with eigenvalues of greater than 1.0 were retained and presented in Fig. 3 for both monitored conditions. The first principal component of the non-rainy dataset (Fig. 3a) explained 26% of the total variance and was largely and positively contributed by TN and NO3-N. Moderate contributions were from EC, SS, and Tur. This factor represents high nutrient pollutants of organic and in-organic nature from point and non-point sources of pollution. And the moderate loadings on EC, SS, and Tur are from the physical source of variability. Strong and positive loadings on Tur and SS were observed in PC2 along with positively loaded variations of COD and TP. Therefore, PC2 represents erosion related to physical and organic sources of pollutants. PC3 had strong and positive loadings on WT, pH, and COD due to physical and organic sources of pollution. And PC4 loadings were mostly dominated by TP, DIP, and TN, which can be interpreted as representing influences from point sources and non-point sources. The sources of organic and in-organic pollutants in the stream are discharges from domestic wastewater, wastewater treatment plants, cattle farms, and agricultural lands. Park et al. (2005) reported that TP and TN were also recorded high in the Seomjin River, which receives inflows from paddy fields and dry fields. The variances explained by PC2, PC3, and PC4 of non-rainy data were 19%, 15%, and 10%, respectively.
Unlike the case of the PC1 of non-rainy data, the PC1 of rainy data (Fig. 3b) was largely contributed by Tur, SS, and COD. Small positive contributions in PC1 were noted from nutrient constituents TN and TP, and negative from pH. The high loading on suspended solids indicates the soil erosion from upland areas during the rainy season and the positive correlations with chemical oxygen demand indicates the presence of partially decayed organic matter in washout from forests and agricultural areas (Shrestha and Kazama 2007). This component reveals that WT, EC, and DIP were less important. The PC1 of rainy dataset had a slightly higher variance than the PC1 of non-rainy data, which was 30%. The PC2 of rainy dataset explained 19% of the total variance and was largely and positively contributed by EC (mineral component) and nitrogen components, TN and NO3-N. The PC3 showed strong positive loadings on in-organic related parameters, DIP and NO3-N. The PC4 was loaded on organic source parameters, pH and TP, and the physical parameter WT.
Component loadings for the first five principal components of both datasets showed that all PCs were negatively and positively influenced by most of the variables, which makes it quite difficult to interpret which parameters were more important than others in affecting water quality. Therefore, factor analysis is needed to better understand the major parameters influencing water quality during non-rainy and rainy conditions. The FA process assigns higher correlation coefficients for the significant parameters and lower correlation coefficients for the less significant parameters.
Varimax rotated factor patterns for the first five PCs, which accounted for more than 80% for both datasets, were presented in Table 6 and Table 7. In this study, any water quality parameter with an absolute correlation coefficient value of >90% was considered to be an important parameter and greater than 80% was considered to be a moderately important parameter. The absolute value of the correlation coefficient >95% was considered by Ouyang et al. (2006) as important, but Shrestha and Kazama (2007) considered >75% as important. In the non-rainy dataset, TN and NO3-N were the most important parameters of Factor 1 and their correlation coefficients were 0.93 and 0.91, respectively. TP and DIP had correlation coefficients of 0.98 and 0.97 in Factor 4 and Factor 5, respectively. Tur and SS in Factor 2 and WT in Factor 3 also had significant correlation coefficients (Table 6). Factor 1 of the rainy dataset showed significant correlation coefficients of Tur, SS, and COD, which were 0.93, 0.91, and 0.80, respectively. The most important parameters in Factor 2 of the rainy data were NO3-N (0.91) and TN (0.84) with positive correlations. The other highly significant coefficients were shown in Factor 3 by DIP and in Factor 5 by WT (Table 7).
[Table 6.] Varimax rotated factor pattern of non-rainy dataset
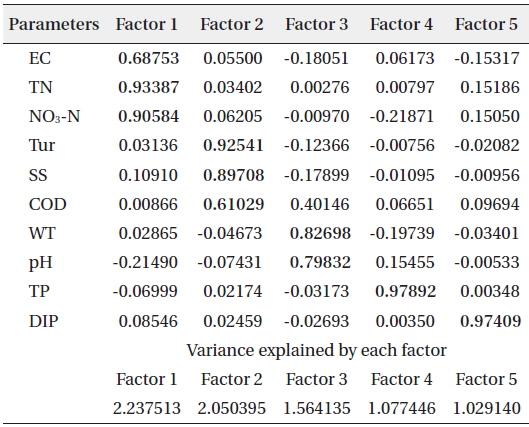
Varimax rotated factor pattern of non-rainy dataset
[Table 7.] Varimax rotated factor pattern of rainy dataset
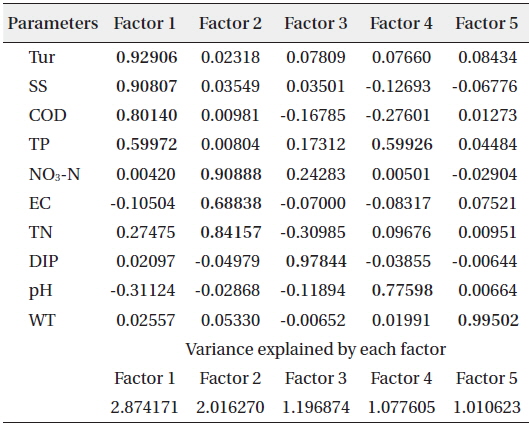
Varimax rotated factor pattern of rainy dataset
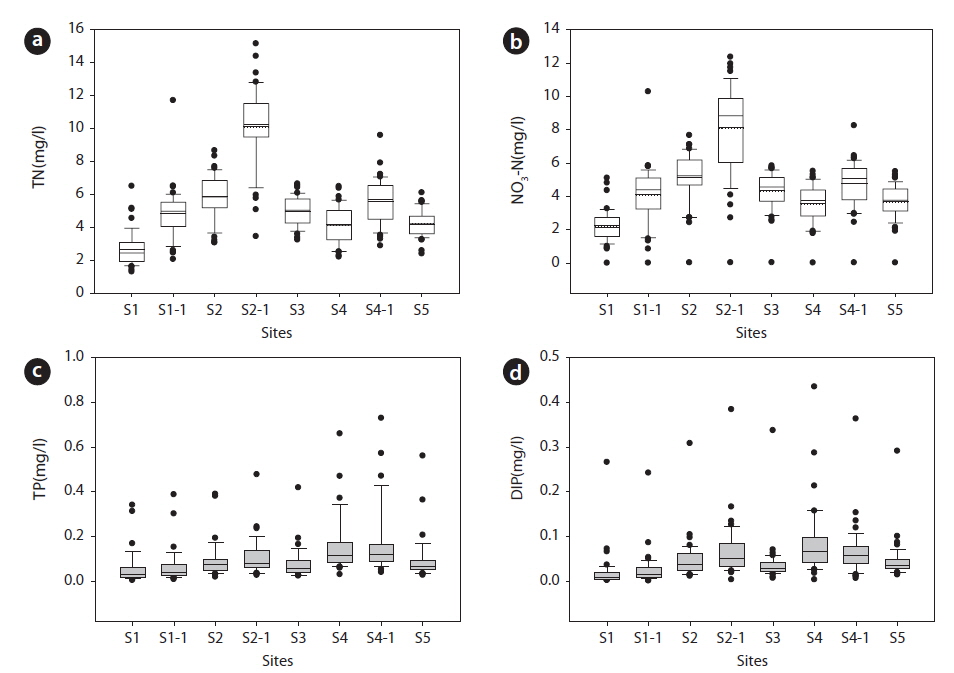
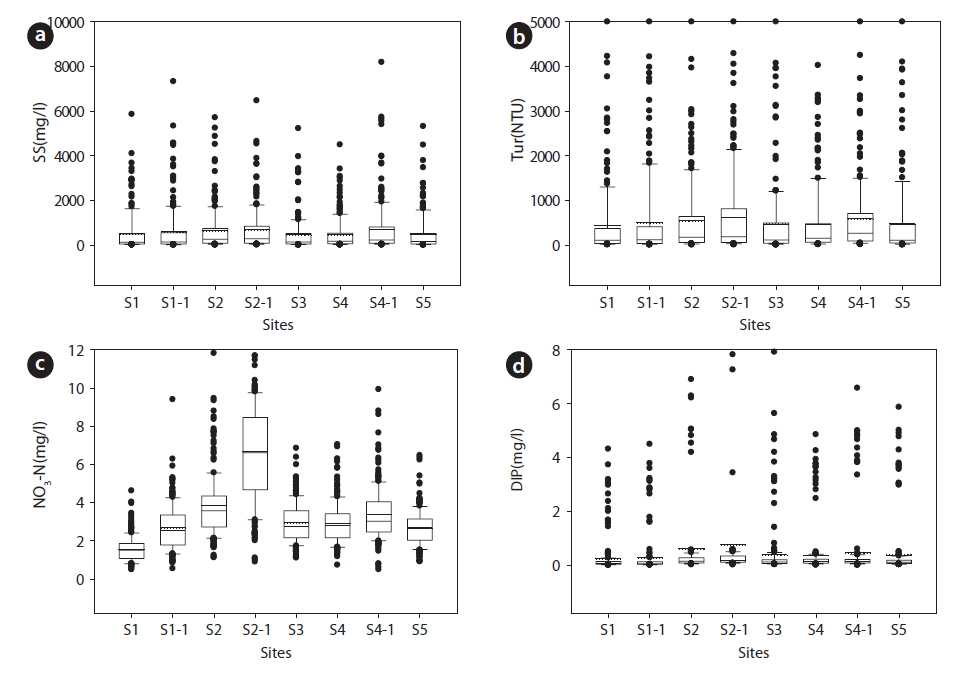
The variations of most important parameters identified by a principal component method were presented in Fig. 4 and Fig. 5. Spatial distributions presented in box and whisker plot trends give clear information that the sites with high variations of the major parameters were S2-1, S4-1, S2, and S4. These four sites are located in the upper reaches of Lake Doam watershed and receive discharge from sub-watersheds, which are mainly dominated by forest and agricultural areas. The main reason for high concentration of variables can be erosion and runoff related discharge of organic and inorganic pollutants in the streams. During the non-rainy conditions, nitrogen components (TN, NO3-N) showed higher variations at sites S2-1, S4-1 and S2, and phosphorus components (TP, DIP) showed higher variations at sites S4-1 and S4 than the other sites. Nitrate nitrogen (NO3-N) variations were high during rainy conditions at sites S2-1, S4-1, and S2, too. During rainy conditions, high variations of SS, Tur, and DIP were observed at sites S2, S2-1 and S4-1.
This study demonstrated that the water quality variations of Lake Doam watershed under non-rainy and rainy conditions were distinctly different. The highly significant parameters (total nitrogen and total phosphorus) identified in the non-rainy dataset were less significant in the rainy dataset. Turbidity, suspended solids, and chemical oxygen demand were highly significant in the rainy dataset but less significant in the non-rainy dataset. Therefore, water managers and administrators must consider nonrainy and rainy seasonal water quality variations while selecting parameters to reduce pollutant loads.
This study used principal component analysis techniques to analyze and interpret the water quality variations of streams in the Lake Doam watershed during nonrainy and rainy conditions. Principal component analysis demonstrated that the first five principal components represented 80% of the total variance explained in each dataset. Varifactors obtained from the factor analysis process indicate that the significant parameters influencing water quality in one condition were not entirely same in the other condition. As presented in the results, nitrate nitrogen, total nitrogen, total phosphorus, and dissolved organic phosphorus were the most important variables for non-rainy conditions, while suspended solids, turbidity, nitrate nitrogen, and dissolved inorganic phosphorus were the most important variables for rainy conditions. The pollutants loading into the streams during the nonrainy conditions can be related to point source pollution and non-point source pollution from the watershed. Soil erosion and decayed matter related pollutants were dominantly loaded during rainy conditions. The spatial distribution of the FA identified that the most important parameters had higher concentrations at the sites of Chahang and Yongpyeong tributaries than the other sites. These sites receive discharges mainly from cultivated areas in the uplands. Thus, the principal analysis techniques can be helpful to analyze and interpret the water quality data and information can be used to assess the water quality of water bodies in the watershed.